Domestic factors - introduction
Generally the way for a country to improve its economic growth is through the 2Qs of Factors of Production
Q1 is quantity of Factors of Production
Simply put if the country increases its Factors of Production it will be able to prooduce more goods and services. In Brazil the oil discoveries of the last decade meant economic growth (and therefore development).
Q2 is quality of Factors of Production
Policies that improve
the ability of Factors of Production to produce more (ie increasing
productivity) will allow the country to have economic growth (and
therefore development). For example education and training in Brazil
will increase the productivity (productivity is defined as average
production) of labour.
- Education and health
- The use of appropriate technology
- Access to credit and micro credit
- The empowerment of women
- Income distribution
Economic Growth and Development
Using Aggregate Demand and Supply Model
Actual Economic Growth
 Economic
Growth can be defined either as an increase in the production of goods
and services (increase in real GDP) or an increase in the production
potential of the Economy.
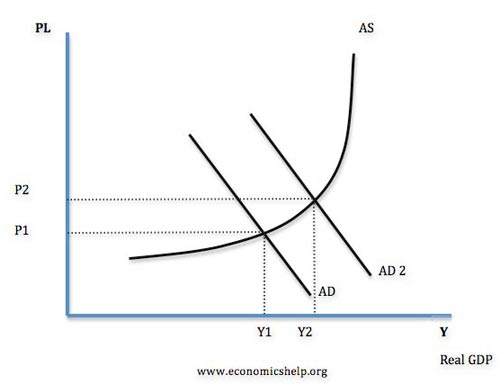
The diagram on the left shows one way to illustrate actual economic growth. Equilibrium is first at Y1 and a change in one or more of the components of Aggregate Demand shifts AD to AD2 and the new equilibrium is at Y2. Because Y2 is larger than Y1 there has been economic growth. Note the economy has moved closer to Full Employment (not shownbut you know where that is).
Compare this with using the PPC on page 58 (next page)
Potential Economic Growth
 The potential output of the economy is given by the LRAS curve since it shows full employment output (real GDP).
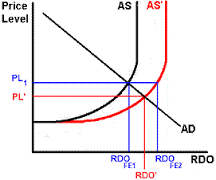
Increases in the Quantity and/or Quality of factors of production mean full employment real GDP is increased shown by a shift to the right of the AS curve to AS`
Remember what actually happens is given by equilibrium changes.
Compare this with using the PPC on page 58 (next page)
Using Aggregate Demand and Supply Model
Actual Economic Growth
 Economic
Growth can be defined either as an increase in the production of goods
and services (increase in real GDP) or an increase in the production
potential of the Economy.
Economic
Growth can be defined either as an increase in the production of goods
and services (increase in real GDP) or an increase in the production
potential of the Economy.The diagram on the left shows one way to illustrate actual economic growth. Equilibrium is first at Y1 and a change in one or more of the components of Aggregate Demand shifts AD to AD2 and the new equilibrium is at Y2. Because Y2 is larger than Y1 there has been economic growth. Note the economy has moved closer to Full Employment (not shownbut you know where that is).
Compare this with using the PPC on page 58 (next page)
Potential Economic Growth
 The potential output of the economy is given by the LRAS curve since it shows full employment output (real GDP).
Increases in the Quantity and/or Quality of factors of production mean full employment real GDP is increased shown by a shift to the right of the AS curve to AS`
Remember what actually happens is given by equilibrium changes.
Compare this with using the PPC on page 58 (next page)