To
illustrate your answers to examination questions on Growth and
Development you can use the most basic economic model very effectively.
The Production Possibility Curve (PPC) also known as Production Possibility Frontier (PPF) :
Assumption - only two goods or types of goods are produced for
example: Consumer Goods and Capital Goods OR Capital Goods and
Welfare Services etc
Remember the PPC shows all the combinations of output an economy can
produce (potential output) using all its factors of production
efficiently
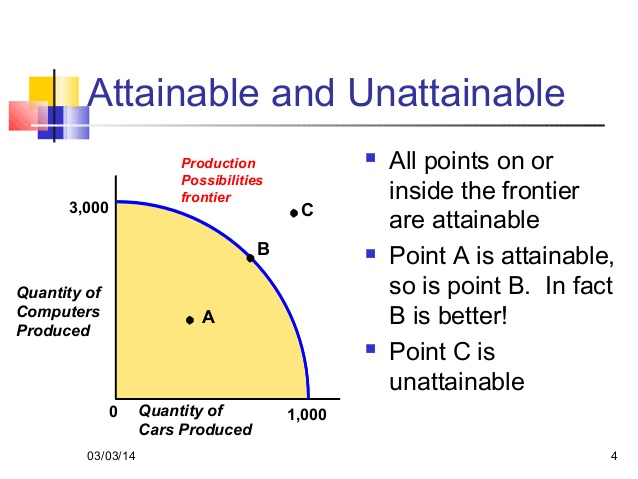
Production
Possibility Curve showing all the possible combinations of Computers
and Cars an economy could produce. Combinations outside the boundary
(frontier) are unattainable (like point C) because there are not enough
resources.
To
explain the PPC you need to describe how it is constructed. The diagram
on the left shows that if the country were to produce only computers
(Y-axis) using all its resources efficiently it could produce 3,000 -
this is one point on the Computers axis (0 Cars:3,000 Computers).
Similarly if the country produced only cars, using all its resources
efficiently, it could produce a maximum of 1,000 cars. This is an
alternative point (1,000 cars: 0 computers), this time on the Cars axis
(X-axis).
Alternatively the country can produce any combination of computers and cars along the PPC.
Point A (300 Cars: 400 Computers) is attainable because it is inside
the PPC and shows that all resources (Factors of Production) are not
being used efficiently. In fact we could infer there is unemployment at
this point.
Point B
(700 Cars:2,000 Computers) is also attainable and because it lies on
the PPC we can infer all resources are being used efficiently - no
unemployment.
Point C (900 Cars: 2900 Computers) is unattainable because it is
outside the limit of the PPF and there are not enough resources to
produce both these quantities).
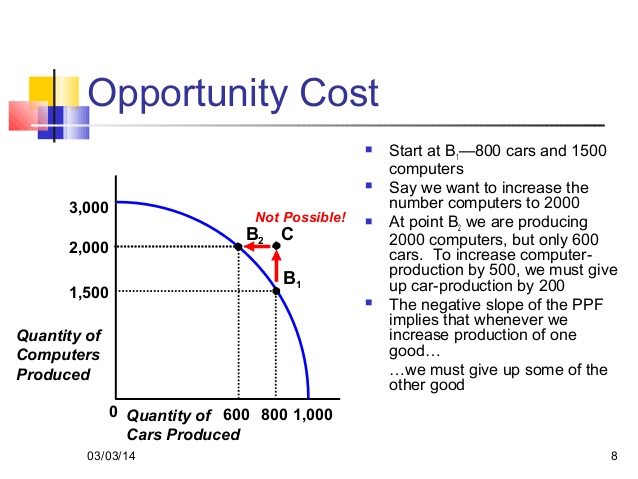
Using the PPC to show Opportunity Cost (See diag below) NB
The PPC is downward sloping showing a trade-off: More cars must mean
less Computers along the PPC. It is curved outward to reflect that
resources are not perfectly interchangable - Diminshing Marginal Rate
of Transformation.
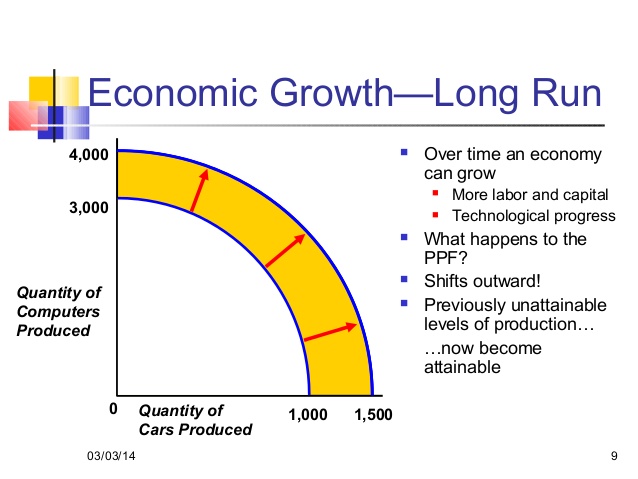
Using the PPC to show Economic Growth
Economic Growth is defined as the ability of an economy to produce more
goods and services (increase in GDP). In the diagram on the left there
has been an increase in either (or both) the Quantity or Quality of
Factors of Production.
This means the PPC shifts outwards reflecting the increased ability of the economy to produce both Cars and Computers.
Actual Growth is shown by a movement from one point to another point,
moving outwards - in the first diagram above actual growth could be a
movement from point A to point B.
Potential growth is a shift of the whole PPC outwards as in the diagram to the left.
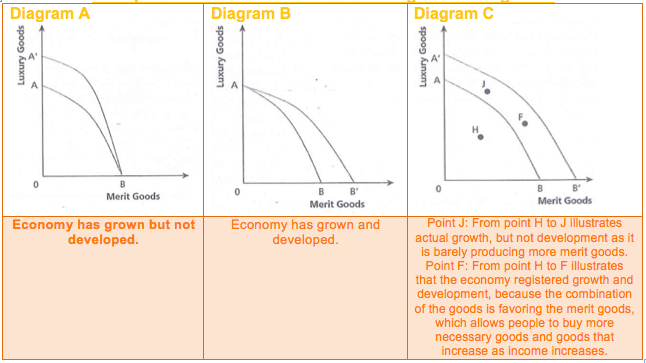
Using PPC to distinuish between Economic Growth and Development