Completing a break-even chart
In some exercises you may be given a break-even chart with some data on it. You have to read the case material, extract the important data, and then complete the chart.

Look at the two examples below.


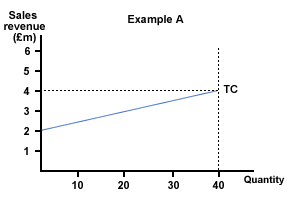
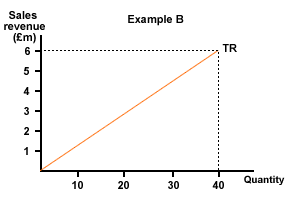
The text for the two examples gives the following:
| Example A | Example B |
|---|---|
| At present the company sells 40 units for $150 000 each. | The company has fixed costs of $3 million and variable costs of $50,000 per unit |
| What is the BEQ? | What is the BEQ? |
| You know the TC, so have to find the TR. | You know TR so have to find TC |
| When sales = 40, Revenue = $6 million | FC = $3 million on Y Axis = TC for output 0 |
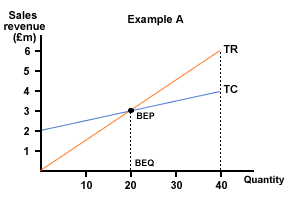
| Plot this. Where TC = TR = break-even point |
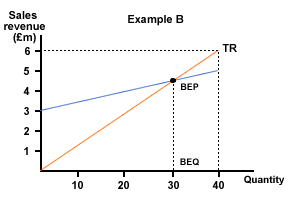
TC at output 40 = $3 million + 40($50,000) = $5 million |
| Plot this and find BEP and BEQ |
The completed break-even diagrams are as follows:


This is supposed to be a little easier to do than draw one from scratch.
Remember, when drawing a break-even chart, or completing one, always label the X and Y axes and give the diagram a title. You may even get a mark for doing this!
