Building a break-even chart

Break-even chart
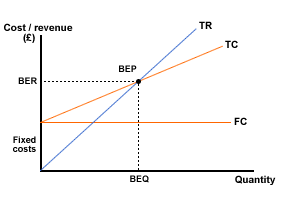
A diagram showing how total costs and revenue change with increasing production / sales.
If you would prefer to view this interaction in a new web window, then please follow the link below:
To be able to handle break-even questions, you have to be able to identify and draw the total cost and the total revenue lines. Let's do some quick revision of these, and then some very useful mathematics:
![]()
![]()
![]()
Remember from section 5.2; costs are either fixed (FC) or variable (VC). Total costs (TC) are the sum of fixed and variable costs. Also remember, that fixed costs are those costs which do not vary with the number made or sold and that variable costs are those that change in proportion to production and sales.
![]()
![]()
![]()
If the maths has just blown you away, don't worry at this stage - we will come back to some numerical examples.
Drafting a break-even diagram
You must be able to draw the following diagram: figure 1, from given information.

Figure 1 Break-even diagram
You may be asked either to draw a break-even chart from scratch, to complete one on a given piece of graph paper, or to modify a given chart to reflect changes given in the case. Any of these versions tests your knowledge and understanding of break-even analysis. As with any question, the first stage is to read it carefully before you rush in and put pen to paper. Make sure that you know exactly what is expected of you.
On the following pages, we look at these two possibilities - drawing from scratch and modifying a given chart.
