Drawing a break-even diagram
Do not rush into drawing. Think first, and you will see it is wise to work out the BEQ before putting pencil to paper.
Having read the question you may now start to follow a procedure. You will be given fixed costs, price and variable costs for a product and a period of time. Remember the alternative words for fixed and variable costs.
Step 1 Extract the data
Extract the data required from the question or text. (The use of case study questions and the provision of written stimulus material provides the scope for the 'hiding' of data.)
You should now have identified: FC per period of time, price per unit and VC per unit. Assume you have extracted the following information from your case study:
- FC: $480 000 per month.
- VC: $60 per unit
- Price: $120 per unit
The decision whether a cost is fixed and variable sometimes causes problems. Do not be confused by the title, or name, but look at the units given. If costs are 'per unit' or 'per number made or sold' then the cost concerned is variable. If the costs are 'per unit time', e.g. per year, then the costs are fixed costs.
Step 2 Calculate the BEQ
The break-even formula is relatively simple:
![]()
We have already discussed contribution in some detail and said its full title is contribution to fixed costs and overheads. In a break-even question there are two terms you will probably never see:
- Overheads
- Semi-variable costs
Both these terms add unnecessary complications to the analysis and are not used.
So, for simplicity, we will define contribution here as contribution to fixed costs.
This break-even formula is very logical really. If each unit sold covers its variable (direct costs) and then contributes another $20 to fixed costs, it is very easy to say when fixed costs will be paid, e.g.
| Fixed costs $ | Contribution $ | Break-even quantity |
|---|---|---|
| 40 | 20 | 2 |
| 80 | 20 | 4 |
| 400 | 20 | 20 |
| 800 | 20 | 40 |
In all of these examples, fixed costs are paid when enough units are produced and sold to generate enough contribution.
![]()
Insert the correct numbers (watch the zero's)
![]()
So we now know that the BEQ is 8,000 units per month. We know where the TC line will cross the TR line. This is a useful check when you construct your graph.

N.B. If the question asks you to construct a break-even graph, just using the BEQ formula will result in you losing marks.
Now we can start drawing, step by step.

It is advisable to construct a table before drawing the break-even chart:
Your table should look like this:
| Quantity/output | Costs ($000) | Revenues ($000) | Profit/loss ($000) | ||
|---|---|---|---|---|---|
| Fixed costs | Variable costs $60 per unit | Total cost | Total revenue (P x Q) $120 per unit | ||
| 0 | 480 | 0 | 480 | 0 | (480) |
| 2 000 | 480 | 120 | 600 | 240 | (360) |
| 4 000 | 480 | 240 | 720 | 480 | (240) |
| 6 000 | 480 | 360 | 840 | 720 | (120) |
| 8 000 | 480 | 480 | 960 | 960 | 0 |
| 10 000 | 480 | 600 | 1 080 | 1 200 | 120 |
| 12 000 | 480 | 720 | 1 200 | 1 440 | 240 |
| 14 000 | 480 | 840 | 1 320 | 1 680 | 360 |
| 16 000 | 480 | 960 | 1 440 | 1 920 | 480 |
Immediately from the table, it can be seen that the break-even point is 8000 units where TR = TC and profit is zero.
Also notice the patterns in the table which make the calculations easier. For example, for every 2000 units of output:
- VC/TC increases 120 000
- Total revenues increase 240 000
- Profit increases 120 000
Step 3 Fix the X axis (capacity)
You will be able to start drawing very soon!
If you are given a maximum capacity, use that figure. If not, double the break-even quantity is a good guide figure, or 16,000 units in this case.
Now sketch that information.
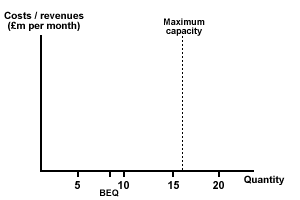
Figure 4 Building a break-even diagram from scratch (1)
Step 4 Fix the Y axis (revenue and costs)
Revenue is usually the greatest figure. In this case the maximum revenue is 16,000 x $120 = $1.92 million (price per unit x maximum possible sales).
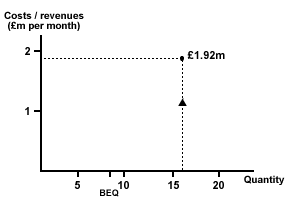
Figure 5 Building a break-even diagram from scratch (2)
Step 5 Plot the TR axis
This passes through the origin, since there is no revenue if there are sales. You also know that TR = $1.92 million when sales = 16,000
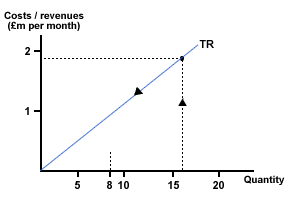
Figure 6 Building a break-even diagram from scratch (3)
Step 6 Add the FC line
Fixed costs are the same, irrespective of output. So mark on the Y axis the value of the FC. In this case it is $480,000. Then draw the fixed cost curve.
Remember, fixed costs are the costs of producing at 'output zero'.
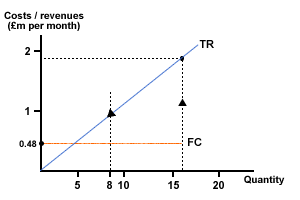
Figure 7 Building a break-even diagram from scratch (4)
Step 7 Add the TC Line
You know that this crosses the TR line at the BEQ, and that it starts at the FC at output zero, so draw it.
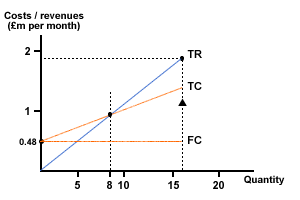
Figure 8 Building a break-even diagram from scratch (5)
You also know that the TC at maximum output of 16,000 units is:
$480,000 + 16,000 ($60) = $1.44 million.
Remember to add labels to the two axes and to give the chart a title! It is no exaggeration; there may be a mark or two available for this. Always take the 'gift marks'.
You now have an exact break-even diagram.
Break-even route map
Note and remember the 'Route Map' for drawing a break-even chart.
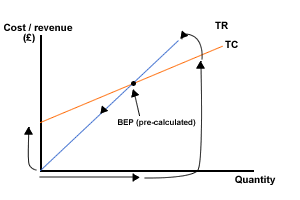
The other tasks you may be given are based on this basic technique.
