Topic pack - Operations management - introduction
Welcome to this Triple A Learning topic pack for Operations management. The pack has a wide range of materials including notes, questions, activities and simulations.
A few words about Navigation
So that you can move to the next page in these notes more easily, each page has navigation tools in a bar at the top and the bottom. These tools are shown below.
![]() The right arrow at the top or bottom of the page will take you to the next page of content.
The right arrow at the top or bottom of the page will take you to the next page of content.
![]() The left arrow at the top or bottom of the page will take you to the previous page.
The left arrow at the top or bottom of the page will take you to the previous page.
![]() The home button will take you back to the table of contents for the pack.
The home button will take you back to the table of contents for the pack.
The pack is split into a series of sections and to access each section, the easiest way is to use the table of contents on the left-hand side of the page. To return to the full table of contents, please click on the 'home button' at any stage.
Higher level extension material
Some of the material in this pack relates to the higher level extension topics in the Business and Management guide. This material is marked by icons as follows:

This icon indicates the start of the higher level extension material.

This icon indicates either:
- The higher level extension material continues on the next page or
- The higher level extension material continues from the previous page

This icon indicates the end of the higher level extension material.
Terms and definitions
One of the key things you need to be sure to know, are the definitions of all key business terms. In this section we give you explanations and definitions.

If you would prefer to view this interaction in a new web window, then please follow the link below:
Click on the right arrow at the top or bottom of the page to start looking at the definitions.
Aims of the business and management course
The aims of the business and management course at HL and SL are to:
- promote the importance of exploring business issues from different cultural perspectives
- encourage a holistic view of the world of business
- enable the student to develop the capacity to think critically about individual and organisational behaviour
- enhance the student's ability to make informed business decisions
- enable the student to appreciate the nature and significance of change in a local, regional and global context
- promote awareness of social, cultural and ethical factors in the actions of organisations and individuals in those organisations
- appreciate the social and ethical responsibilities associated with businesses operating in international markets.
Assessment Objectives
Having followed the business and management course at HL or SL, students will be expected to:
- demonstrate knowledge and understanding of business terminology, concepts, principles and theories
- make business decisions by identifying the issue(s), selecting and interpreting data, applying appropriate tools and techniques, and recommending suitable solutions
- analyse and evaluate business decisions using a variety of sources
- evaluate business strategies and/or practices showing evidence of critical thinking
- apply skills and knowledge learned in the subject to hypothetical and real business situations
- communicate business ideas and information effectively and accurately using appropriate formats and tools.
In addition to the above, students at HL will be expected to:
- synthesize knowledge in order to develop a framework for business decision-making.
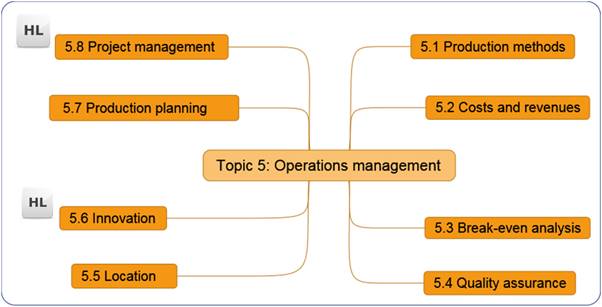
Topic Five Structure
Topic five has six core sub-topics and two HL extension topics.
Operations Management (OM) - Introduction
All businesses produce something, be this tangible or intangible. Traditionally, when we think of production we tend to think of firms manufacturing physical goods in factories and on production lines. However, the experience of most modern, developed economies is that the manufacturing element is actually a smaller part of the economy than the provision of services. There are exceptions; Germany, for example, is still a significant manufacturing and exporting economy.
Production is concerned with converting inputs such as raw materials into finished products which will meet the needs and wants of the market and the customers within them. The process of production will add-value allowing firms to charge a higher price for the finished product than it paid in terms of costs
Production describes a relatively static process, but the term operations management refers to the management of the production process and describes a far wider range of activities; it is far also better suited to firms that produce services rather than physical goods.
What is Operations Management?

Operations Management is concerned with the design of products and services and the management of processes and supply chains. It describes the acquisition, development, and utilisation of the resources that firms require to produce and deliver the goods and services that their customers want.
Operations management covers both strategic and tactical activities. For example, senior management will need to make strategic decisions about the size and location of factories and the levels of research and development as well as planning appropriate supply chains. Middle management and supervisory staff will be more concerned with tactical issues including factory design, layout and structure, project management and equipment selection and replacement. At an operational level, decisions will focus on activities like production scheduling, stock processes and material handling, quality control and maintenance policies.
Operations management is concerned with activities within all three sectors of the economy:
- primary sector, e.g. extracting raw materials and the harvesting of crops
- secondary sector, e.g. manufacturing, construction and processing
- tertiary sector, e.g. service provision.
5.1 Production methods notes
In this section we will examine production methods.

By the end of this section you should be able to:
- Describe and compare the features and applications of each method

- Analyse the implications for marketing, human resource management and finance that arise from changing the production system
- Analyse the most appropriate method of production for a given situation
- Understand the needs for organisations to use more than one method of production
Production methods
We start this module on operations management by looking at the methods used by firms to produce. Different products require different production techniques. As you work through this section, try to think what impact these different production methods will have on the other areas of the firm's activities - such as marketing, human resource management and finance. Production is part of an integrated system and cannot be considered in isolation; it will impact on other areas of business as well as being influenced by these.
The production techniques used by industry can be divided into three main categories.
- Job production
- Batch production
- Flow production
We look at each of these on the following pages.
Job production

Job production
Job production is the manufacture of individual 'one-off' or unique items made to customer specifications. The product is seen through the whole process, from start to finish, by an individual or group of workers. The production of the next individual item does not begin until the previous job is complete.
 Job production is associated with bespoke production, where each product is made individually and to order; customised to the buyer's specification, such as buildings, paintings, designer clothes, meals and haircuts. Production is a highly skilled process and goods may be handmade and labour intensive. Production costs are usually high, particularly the labour element and, as a consequence, premium prices can be charged.
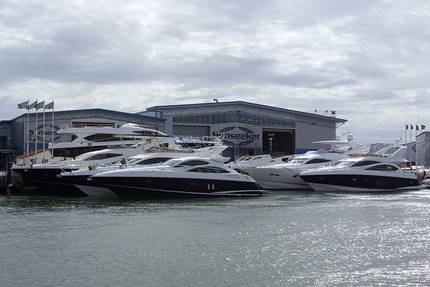
Job production covers both small-scale, low technology projects as well as large, complex projects involving high technology. Products are one-off and often unique, such as portraits or tailor made suits, but may be produced singly to a repeated design, such as aircraft, luxury sports cars and yachts.
Job production is well suited to smaller firms as there are few opportunities for economies of scale and the market is less price-sensitive. However, large-scale projects may satisfy the objectives of larger firms in terms of revenues and profit levels; examples of which include major one-off construction projects. At both ends of the scale, job production is appropriate for a business which focuses on meeting customer needs.
The management of job production may be difficult, as the processes differ from job to job. Management of larger products need to place emphasis on cost control and cash flow because payments for products made to order, such as yachts and buildings, may not be made until completion and/or delivery. There may also be penalties for late delivery of large products, so management need to monitor progress (we cover this in more detail in section 5.8 on project management).
For the advantages and disadvantages of each production method, see the advantages and disadvantages summary interaction (page C7).
Batch production

Batch production
Batch production is where the manufacturing process is split into a number of different operations; each of which is carried out on the whole batch before it is moved on and another batch received. The batch is moved on from one stage of production to the next until all the manufacturing processes are completed. Batch production involves the manufacture of a group of identical items and is normally used when the demand for the product is relatively constant.
 Batch production involves the production of identical products made in groups (batches). The group remains together as it passes through each stage of production until all processes are complete. Changes may be made between batches. For example, clothing may be produced in batches of different sizes and colours. The process, therefore, includes a delay between batches while equipment is changed or recalibrated; this is known as downtime.
Production is less personal in that products are not individualised to customer requirement; the focus is on making high quality products at an affordable price. Workers specialise and are less likely to be highly skilled or multi-skilled. Specialised equipment is probably used since it is possible to get higher capital utilisation. Products are cheaper, but capital cost is significantly higher than for job production.
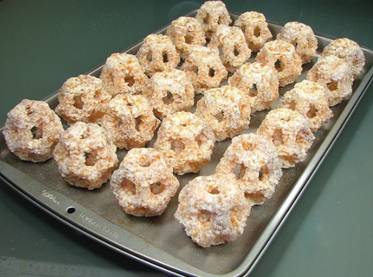
Typical products produced in batches include bakery products, clothing, 'fast-food', shoes and pharmaceuticals.
For the advantages and disadvantages of each production method, see the advantages and disadvantages summary interaction (page C7).
Flow/mass production

Flow production
Flow production is where all the different operations required for production are carried out in a sequence one after the other. It is usually used where mass production is required to meet high levels of demand and when the product being manufactured is reasonably standardised.
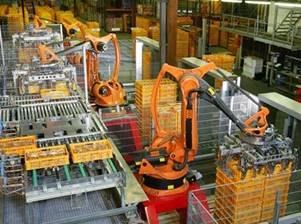 Flow production is the continuous movement of items through each stage of production, often along a conveyor belt or assembly line. Individual jobs are done in sequence. Also known as mass or line production, the process involves the manufacture of a large volume of identical, standardised products. Flow production is highly capital-intensive and has high set-up costs, requiring firms to operate near capacity (high capacity utilisation).
Employees are normally semi-skilled and the process is suited to both mechanisation and automation. The assembly line is often associated with the motor industry, with the Ford 'Model T' being given as one of the first examples of this method of production.
Flow production allows for Economies of Scale and Specialisation (Division of Labour), which are examined in more detail in the Business organisation and environment topic pack. Specialised staff tend to work on a single task, but as we see in the next section, this may not always be the case, especially if a firm employs cell production techniques.
Although standardisation is given as both an advantage and disadvantage of flow production, new technologies have allowed varied products to be designed, developed and produced more rapidly, flexibly and cheaply, often with better quality, e.g. computer assisted design (CAD), computer assisted manufacture (CAM) and automation using robots. More flexible and sophisticated automation of lines has allowed mass produced items to be more customised.
The following video on the Ferrari assembly line illustrates how mass production can be adapted to a more customised product.
For the advantages and disadvantages of each production method, see the advantages and disadvantages summary interaction (page C7).
Halo Custom Guitars

Read the article Halo Custom Guitars Offers Build-to-Order Musical Instruments (you can do this in the window below or follow the previous link to read the article in a separate window) and then consider answers to the questions below.

Question 1
Distinguish between job production and mass production.
Question 2
Explain how automation offers opportunities for increased customisation in the process of mass production.
Question 3
Analyse the advantages and disadvantages of using mass production to produce guitars.
Summary of production methods
Job Production - made to order with specific features e.g. Olympic Stadia.
Batch Production - a group of items passing through a number of stages as a batch, together e.g. bread: dough made, loaves produced, put in oven, sliced, wrapped, or McDonalds burgers.

Mass/Flow Production - an item moves or flows from one stage of a process directly to the next, often by conveyor belt (a continuously moving process) e.g. cars , electronic and 'white goods'.


Task
Have a look at the 'How everyday things are made' web site. This shows you the production process of a wide range of goods. You can look at the site in the window below, or you can follow the previous link to view it in a separate window.
From the web site, find an example of job production, batch production and flow production.
Advantages and disadvantages of production methods
If you would prefer to view this interaction in a new web window, then please follow the link below:
Continuous production
A variation of flow production is continuous production. Here materials flow continuously through a process, and the product is produced continuously. Good examples are oil refining, the manufacture of detergents and the manufacture and printing of newsprint.
All these production techniques can be summarised as follows:
| Job production | Batch production | Flow production | |
|---|---|---|---|
| Output potential | Low | Intermediate | High |
| Capital requirement | Low | Intermediate | High |
| Product quality | High | Intermediate | Lower |
| Flexibility of product | High | Intermediate | Low |
| Unit cost | High | Intermediate | Low |
| Labour skill requirement | High | Intermediate | Low |
| Labour productivity | Low | Intermediate | High |
Observe the trade-off between productivity and flexibility.
Much work has been done on flow production to increase its flexibility and quality. Computer organisation and control, for example, has revolutionised car assembly
Job production can generally be considered as being labour intensive.
Flow production can generally be considered as being capital intensive.
Cost structure of firms
Some production techniques will be labour intensive and some will be capital intensive. So what do these terms mean?

Labour-intensive
A labour-intensive industry is one where the cost structure is largely made up of variable cost, with labour being the main resource required for production. Job production is a highly labour intensive production method with the cost of labour being significantly higher than the cost of the capital structure, such as machinery. The service sector includes many examples of labour-intensive activities, including schools, banks and legal firms.
Capital-intensive
A capital-intensive industry is one with a high quantity of capital per worker and, therefore, a relatively high proportion of capital costs compared to the cost of labour. Capital-intensive firms require large amounts of fixed assets and/or cash to operate and need a high volume of production and a high margin to provide adequate returns on investment. Capital-intensity is typical of mass and flow production. Steel, automobile manufacturing and mining are examples of capital-intensive industries.
The difference between an activity which is labour-intensive and one that is capital-intensive has significant implications for a firm and there is often a link to the size of the business. Small firms tend to be more labour-intensive than larger ones. Large capital-intensive firms tend to be more profitable than small ones, when conditions are good. However, when times are hard, small labour-intensive firms may find survival easier than large ones as they will find cost reduction easier.
Capital-intensive firms tend to produce standardised products, with low profit margins whereas labour-intensive firms are normally more customer focused, resulting in the opportunity to charge higher prices and obtain larger profit margins.
The bigger the market for a product, the more likely it is that it will be produced by capital-intensive methods. This has significant implications for the international market. Firms based in large markets, such as the USA, have a significant advantage over those that have developed in smaller national markets, such as Belgium or Luxembourg.
Cell production and teamwork

 Changes in quality control methods and technological advances in recent years have led to a revolution in production methods. This revolution has been given the name of lean production. This term covers a range of new methods and procedures, which will be examined and summarised in this section.
The purpose of lean production is to:
- Improve quality and lower rejection rates
- Increase productivity
- Reduce the costs of production by cutting aspects such as waste
At the beginning of this topic we examined various production methods, such as job, batch and flow production. Problems occur with many of these. For instance, flow production may lead to issues of poor morale, motivation and efficiency, as specialisation eventually deskills jobs and reduces work to monotonous, repetitive and simple actions. Little judgement and responsibility is afforded the employee. To remain competitive, firms desire the production of quality product at as low a cost as possible. To ensure consistent and reliable quality, at a fair cost, traditional mass production has been replaced by alternative methods of managing and operating assembly lines. These include:
- Cell production
- Just-in-time (JIT) production
Cell production

Cell production
Cell production is an important ingredient of lean manufacturing and refers to a manufacturing system where the workforce is divided into self-contained teams designed to complete a particular manufacturing process or product. The team is responsible for quality control and 'sells' the part-finished product to the next cell which is regarded as an 'internal customer'. Each member of the team is multi-skilled, allowing for greater flexibility in production through job rotation.
With cell production, assembly lines are broken down into groups of related activities, not individual ones. The cell is normally arranged in a 'U' or horseshoe shape. Each self-contained team (cell) is responsible for the completion of a product or specific process. Every member of the team is skilled at a number of roles, so providing an opportunity for job rotation. It is necessary to locate all the different equipment needed to manufacture the product together in the same production area.
The team is responsible for allocating specific roles, covering for absences and holidays, appointing their own supervisors, organising training and arranging their own breaks. They are responsible for the quality of the 'product' they pass to the next team, who are regarded as internal 'customers', which is a key element in the Kaizen approach to quality control. In effect, they operate their own little assembly factory. Each cell is responsible for a complete unit of work, which Herzberg identified as a method of job enrichment.
This method gives employees some say in their work; hence improving motivation and morale; they are less likely, therefore, to become bored by repetitive work. Those that want to can take responsibility. This form of team working has become increasingly popular as it combines the advantages of mass production with a human system, which is more motivating than the traditional assembly line.
Firms may go one stage further and train teams responsible for manufacturing the entire product - the teams then move around the plant or factory with the product and complete each stage of production. This should improve motivation as employees are empowered, resulting in quality benefits.
The objective of cell production is to enable greater flexibility to produce a high variety of low demand products, while maintaining the higher productivity of larger scale production.
Advantages of cell production:
- stability of the team improves communication between the cell members
- processes, defects, scheduling and maintenance can be managed more efficiently and cost-effectively
- workers become multi-skilled and are consequently more adaptable and flexible to the changes in the business
- seeing the product from start to finish may create greater 'pride' and job satisfaction
- staff feel more involved in decision-making and the variety of work and greater responsibility generally results in better motivation
- quality improves because each cell has 'ownership' over production and cells often aim for 'zero defects' and the elimination of waste ('Muda')
- low stock requirements and minimal work-in-progress allows for the operation of a just-in-time (JIT) system
- improved customer response time
Disadvantages of cell production:
- may not allow firms to use their machinery as intensively as in flow production and output will be lower than mass production as a result
- greater investment is required in new management and control processes, such as stock ordering
- there may be rivalry between different cells and conflict may arise if one cell is left to wait for output from another

The following article from the engineering review magazine outlines not only a cell production system, but how this is being adapted to allow robots to take over the roles of human workers on the assembly line in the IHI group of companies in Japan. Follow the link below to view the article; then undertake the exercise.

Prepare a short report explaining how it is becoming possible to apply industrial robots to
tasks that cannot easily be automated and which presently rely heavily on human workers.

Cell production - examples and illustrations

Modern car assembly - the modern assembly line
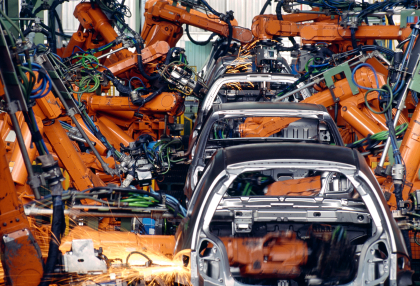 At first glance, a modern car assembly line looks similar to the old 'Henry Ford' production process. However, deeper examination will reveal significant differences. Although individual tasks are small and relatively simple, the production line is now made up of a series of consecutive work 'cells', which have:
- A team of workers
- A supervisory responsibility
- A quality responsibility
- A process/product quality improvement responsibility
The team, or cell, decides who does what within the team. It decides how jobs will be rotated to relieve boredom, or to ensure the relevant specialist is available for certain tasks. The cell works as a team, not a number of individuals.
Each cell will pass a 'product' onto the next cell in the line and is responsible for seeking improvements in processes and quality. Cells normally operate as quality circles, which we examine later in this topic. It is almost certain that just-in-time (JIT) manufacturing will be in place.
The purpose of using cells and JIT production is to combine the advantages of a tailor-made, individual car of high quality - produced by job production - with the benefit of mass production savings. When consumers go to a dealer and place an order, a personal code/reference number and production slot is allocated at the same time. In other words the vehicle is made-to-order, but not using job production. These changes mean that car prices, in real terms, have fallen and fallen, but quality has steadily improved.

Nihon Kohden
Read about the assembly process at Nihon Kohden, Japan's leading maker of EEG, patient monitors, AED, and medical electronic equipment, describing its use of cell production and quality assurance.
You can view the article, Our commitment to safety and quality, in the window below or follow the previous link to read the article in a separate window.
Changing the production system
If you would prefer to view this interaction in a new web window, then please follow the link below:

Read the article Daimler and Aston Martin to Collaborate on High-End Maybachs and Lagondas (you can do this in the window below or follow the previous link to read the article in a separate window) and then answer the questions below.


Analyse the implications for marketing, human resource management and finance that might arise for Daimler as it moves from to mass to batch production for its Maybach brand.
Selecting the most appropriate method of production
There is no one best method of production. The choice of production method rests on a number of variables which will change over time. The following are some factors which will influence business in its selection of production method:
- The level of demand - if there is a mass market for a product, this may justify the investment in capital to allow for flow production.
- The nature of the target market - customers may demand a high level of customisation and quality which only job production can provide. However, price sensitive markets segments may only be satisfied if the firm produces high volume, standardised products.
- The nature of the product - certain products may only be produced by one production method. Unique constructions, such as sky scrapers and sports stadiums will require job production.
- The comparative costs of labour and capital - labour is often the largest cost for firms in developed countries. Consequently, large firms will look to minimise cost by investing in automation and mass production technologies. However, businesses operating in countries where labour is relatively cheap are more likely to use labour-intensive production methods.
- The nature of the firm itself - small firms are unlikely to have the funds to invest in the capital required for mass production.
- New technologies - as technologies develop, they often become cheaper. This may allow smaller firms to acquire the capital required for batch or flow production systems.
- The goals of the business - firms seeking to maximise market growth and/or profitability, may invest in flow production, whereas firms aiming for a high quality niche may build on unique selling points, such as 'hand-made' or 'customised' requiring job production methods.
- Government policies - government often attempt to stimulate economic growth by offering grants, subsidies and tax breaks for capital investment. Some firms will be persuaded to make production more capital-intensive as a result.
Combining methods of production
The factors that affect the choice of production method are also likely to encourage firms to use a variety of production methods to satisfy the needs of customers in different market segments.
 The burger, or fast food market, tends to work along the principles of batch production with a number of identical burgers being produced at a time. However, where demand is lower for certain products, e.g. vegetarian burgers, these may be made to order, i.e. job production.

Subway, for instance, produces batches of rolls or 'subs', but consumers are able to customise the fillings to a certain extent within the options available.
Mass production can be customised through the use of greater automation and robots in the production line. Until recently, assembly lines were built on the principle of the standardisation of products. Under this production method, any change in the nature of the finished product would require the line to be stopped, new tools or materials added and/or existing equipment to be recalibrated. However, robotic technology may be programmed to produce varying sizes and finishes. Paints, for example, can be changed rapidly by the rotation of nozzles.
The technology market in particular combines methods of production. Dell traditionally sells online and customers can order a number of standardised products, which are produced using assembly line operations. However, during the order process, additional options can be selected. This additional flexibility may threaten the existence of smaller firms which do not enjoy the lower costs associated with mass production, but whose greater choice and flexibility to meet customer needs previously justified the higher price they inevitably charged.

5.1 Production methods - questions
In this section are a series of questions on the topic - Production methods. The questions may include various types of questions. For example:
- Self-test questions - on-screen questions that give immediate marking and feedback
- Short-answer questions - a series of short-answer questions to help you check your understanding of the topic
- Case study - a case study with associated questions
- In the news - questions based around a topical business news article
Click on the right arrow at the top or bottom of the page to work through the questions.
Methods of production - short answer questions

Question 1
Distinguish between job, batch and flow production.
Question 2
Explain why consistent quality is easier with flow production than with job production.
Question 3
Using appropriate examples distinguish between labour-intensive and capital intensive production.
Question 4
Explain why it is difficult to categorise the production method used by Dell computers.
Question 5
A local manufacturer of yachts starts out making a few boats using job production. As its popularity grows it switches to batch production. Finally, it becomes an international firm and produces a large number of yachts using flow production.
Examine the likely effects of these changes in operation on quality, price and choice.
Cell production and teamwork - short answer questions

Question 1
Define the term 'cell production'.
Question 2
Identify the advantages and disadvantages of introducing cell production.
Question 3
Explain why cell production leads to improvement in overall quality.
Toyota redefines auto assembly line
Read the article Toyota redefines auto assembly line (you can do this in the window below or follow the previous link to read the article in a separate window) and then consider answers to the questions below.

To help answer the following questions, you may also wish to read:

Question 1
Define the terms:
- assembly line
- innovation.
Question 2
Explain the implications for Toyota of 'increasing demand for low-price vehicles in emerging economies, while sales in industrialized nations remain sluggish'.
Question 3
Analyse the implications for marketing, human resource management and finance that arise from changing to Toyota's new assembly line system.
Question 4
Evaluate the impact on Toyota of the world recession and the Yen's steep appreciation.
5.2 Costs and revenues - notes
In the previous section we looked at production methods. We will now examine costs and revenues.

By the end of this section you should be able to:
- Define, explain and give examples of each different type of cost
- Explain the meaning of revenue and comment on possible sources of revenue for different firms
- Explain and calculate the contribution to fixed costs

- Explain the nature of cost and profit centres
- Analyse the value of cost and profit centres to a firm
- Analyse the role of contribution analysis in determining the viability of each product for a multi-product firm
Costs and revenues
The terms 'revenues' and 'costs' are probably two of the most important concepts in Business and Management. No business can make profit without sales revenues and cost control is vital to a business if it is to maintain and improve profitability.
In simple terms, a business wishing to make a profit must make sufficient revenues to cover its costs because:
![]()
Revenue

Revenue
For a firm, revenue is the total amount of money received for goods sold or services provided during a certain time period. Revenue is shown usually as the top item in a profit and loss statement from which all charges, costs, and expenses are subtracted to arrive at net profit.
Revenue is also known as sales, sales revenue or turnover. It should be distinguished from other forms of income that a firm generates from other non-operational activities, such as the sale of assets.
Total revenue can be expressed by the following formula:
![]()
![]()
A firm's performance will be judged by how much profit it is able to make from a given sales revenue. The higher the proportion of profit, the more efficiently the firm is being run, as by implication the costs of the business must have been minimised to increase profit levels.
Fortune magazine produces annual rankings of the largest 500 global corporations, listing sales and profits.

Read the article Fortune's Global 500 ranking (you can do this in the window below or follow the previous link to read the article in a separate window)

Of the top ten businesses in the table, which is the most efficient in terms of turning revenues into profit? In other words, which has the highest profit margin?
In the following sections we will examine the nature of revenues and costs in greater detail.
Types of costs
To be able to control costs, it is necessary to understand more about them and from where they arise. In this section we examine the nature and classification of costs.
Costs are usually classified according to their relationship with the level of output of the firm. The following costs are therefore defined in relation to how they change in value as the level of output varies.
Fixed costs

Fixed costs
Fixed costs are costs that do not vary with the level of output in the short term.
Examples of fixed costs
- Rent
- Office salaries
- Advertising
- Insurance
- Depreciation
Fixed costs can be represented on a graph and this would appear as follows:
Figure 1 Fixed costs
A common mistake made by candidates in examinations is to state that fixed costs will always remain constant. This is not the case, as these costs are fixed with respect to short-term changes in the level of output only. In the long-term, a firm may rent a second factory or take out more insurance cover, so fixed costs are likely to change.
Variable costs

Variable costs
A variable cost varies in direct proportion with the level of output. Varying directly means that the total variable cost will be totally dependent on the level of output. If output doubles, then the variable cost would double. If halved, the variable costs would halve. If output were zero, then no variable costs would be incurred.
Common examples of variable costs are as follows:
Example of variable costs
- Direct labour
- Raw materials and components
- Packaging costs
- Royalties
Variable costs can be represented on a graph and this would appear as follows:
Figure 2 Variable costs
Semi-variable costs

Semi-variable costs
A semi-variable cost is an expense, which includes a mixture of fixed and variable components. These costs vary (change) with output, but not in direct proportion The fixed cost element is the part of the cost that must be paid irrespective of the level of activity. On the other hand the variable component of the cost is payable proportionate to the level of activity. These costs are sometimes called mixed costs. In some cases, costs may be fixed for a set level of production, becoming variable after that level is exceeded.
In reality, nearly all costs cannot easily be classified into either fixed or variable. Most costs will fall somewhere between the two classifications. In this case, we classify these as semi-variable costs.
For example, although the wages of the production staff may appear to be variable costs, in reality, they will vary with the level of output, but not in a direct manner. The direct relationship is unlikely to hold over a long period of time. Similarly, many costs will have a fixed element, but also a variable element (for example, most bills for gas and electricity will consist of a standing charge, which is fixed and a variable element, which will depend on the usage). Telephone bills often contain a fixed line rental, but call charges vary with the number made, the distance of the call and the time elapsed. A telephone bill will aggregate these different charges.
What would the graph of a semi-variable cost look like?
As there is a link between the cost and the level of output, we would expect the semi-variable cost curve to be upward sloping. However, there is no accurate 'textbook' appearance for this curve. It will normally slope upwards in a non-linear manner, although this may be stepped or curved.

Examiners find the concept of semi-variable costs particularly difficult to integrate into examination questions - particularly break-even analysis - so semi-variable costs are often ignored, even though they are normally the most common cost.
Total costs

Total costs
Total costs are the sum of fixed costs, semi-variable costs and variable costs for any particular level of output. If the output level is zero, then total costs would consist only of fixed costs.
In nearly all cases, total costs will be the addition of total fixed costs and total variable costs (where total variable cost is the variable cost per unit multiplied by the level of output).
Total variable costs = variable cost per unit x output level
Total costs = fixed costs + variable costs
Total costs can be represented on a graph and this would appear as follows:
Figure 3 Total, fixed and variable costs
Direct costs

Direct costs
A direct cost is similar to a variable cost in that it compares the cost with the level of output. However, a direct cost is any cost, which is directly related to the output level of a particular product or department. Direct cost is more appropriate for a firm that makes more than one type of product.
For example, assume a firm is producing both chairs and tables. The chairs produced use a certain type of wood, but the tables use another type of wood. Then both types of wood would be direct costs, because they are directly related to the level of output of a particular product, not to the level of output in general.
Indirect costs

Indirect costs
An indirect cost is any cost, which cannot be linked with the output of any particular product or department. These costs are also known as indirect overheads or administrative costs. They are related to the level of output of the firm, but not in a direct manner and not for any one product.
For example, the cost of powering machinery will be related to the level of output, but not to a particular product.
Generally, the terms indirect and direct costs are more likely to be used when the firm produces a range of products. In break-even analysis, the firm will only be producing a certain product type. This means that the terms fixed and variable costs are more likely to be used.

Costs - task
Now, a task for you that will check if you understand the new terms you have just met.
Imagine that you have decided to start a business, Student Enterprises Ltd, offering a home delivery service for DVD's. You are next door to a large rental firm who are prepared to supply you, so you will not have to buy stock yet. What would you have to spend money on to set the business up and then operate it?
Make a list of all the costs that you can identify. Examine the list you have made, and then classify the costs between fixed and variable costs. When you have done this, click Costs for Student Enterprises Ltd.
A final question; what type of cost is labour?
The answer here starts with a phrase that is very common within business and management. The answer starts with - 'It all depends'. It all depends on how the labour is paid. Make a list of as many payment schemes (different ways people are paid) as you can think of, then click on Remuneration. Look up the term in the glossary as well.
This means that for much of the time labour is a fixed cost, fixed for the period of the employment contract. Relatively few people are paid solely on the basis of what they produce. Most employees have elements of both fixed and variable payments in their remuneration.
You will often be asked to give examples of fixed and variable costs. When answering this type of question, it may be best NOT to use labour as an example.
Costs and revenue - shape of cost curves
Figure 1 below shows how average costs change as output increases. As you can see from the diagram, average cost falls as the firm increases its output and moves towards its capacity.
What determines the actual shape of this cost curve?
Figure 1 Average cost curve
The answer is the distribution between fixed and variable costs. Let's examine two situations - where fixed costs are a very high proportion of total costs, and where they are a low proportion.
Fixed costs are a high proportion of total costs
This type of firm would be described as being capital-intensive. A good example is a scheduled airline where most costs are fixed, at least in the short to medium term. It would have a cost curve as follows:
Figure 2 Total costs - capital-intensive firm
Total costs would vary little with changes in capacity, but average costs, however, would be very sensitive to output. Look at the diagram below:
Figure 3 Average cost - capital-intensive firm
Average costs would change significantly as the numbers of passengers increase or decrease. Profits or losses would be very sensitive to capacity; in other words the number of seats sold.
Fixed costs are a low proportion of total costs
This is the reverse of the above. Any such firm would be considered to be labour-intensive. An example would be a market stall selling fruit and vegetables. Its cost curves are as follows:
Figure 4 Total cost - labour-intensive firm
Costs vary considerably with output, or capacity. The average cost curve now is very different to that of a capital-intensive firm. Look below:
Figure 5 Average cost curve - labour intensive firm
Average costs are less sensitive to changes in output.
Costs - fixed and variable - examples

Full service or low cost airlines
All airlines, as with any other business, try to maximise income and minimise costs.
As was seen earlier, airlines have very high fixed costs. Let's look at this in more detail. We will compare full service national operators such as Lufthansa with the low cost firms, such as Ryanair. What are the costs that are incurred for a flight?
| Full cost | Low cost | |
|---|---|---|
| Cost of the AEROPLANE | FC | FC |
| Crew costs | FC | FC |
| FUEL COSTS - empty of passengers | FC | FC |
| FUEL COSTS - as load increases | VC | VC |
| Catering costs | FC | VC |
| Landing charges | FC | FC |
| Handling charges | FC | FC |
| Ticketing costs | FC | FC |
| Commission to travel agents | VC | None |
Revenue
Revenue is a business term for the amount of money that a firm receives from its ordinary activities in a given period, mostly from sales of products and/or services to customers. In other words this is operational revenue as it is the result of a firm's normal selling activities. Revenue is recognised either when the cash is received OR at the point of sale (if the goods are sold on credit). Revenue is also known as:
- Sales
- Sales revenue
- Sales turnover
Revenue is basically "price x quantity" (the price for one item multiplied by the number of items sold), summed over all goods; if the price per unit varies with the quantity, then for each price per unit this multiplication is done, and the results are summed.
Revenue arises from sales made in cash and sales made on credit and must not to be confused with the term 'profits', which require costs to be deducted from revenues. Profit is calculated using total sales revenue, but it is important to understand the significance of credit sales. Sales turnover recorded in the profit and loss account includes credit sales and therefore profit is based on this figure. However, credit sales do not involve any cash transfer, so a firm's profits may appear to be healthy even if their liquidity (cash) position may not be so healthy, since the customer is yet to pay.
There are a number of different sources of income a firm may receive. Operational income (revenue) includes:
- cash sales using money, cheques or debit card
- credit sales (i.e. where the business has sold goods to customers, but has not yet received the cash)
A business may receive non-operational (non-sales) income from other activities and sources. Technically these incomes are not revenue, although it is quite common for these to be referred to as such. These incomes may include:
- interest received from cash deposits in financial institutions, such as banks
- royalties received for allowing other businesses to use their ideas
- dividends that the business receives on shares held in other companies
- fees for hiring-out the resources of the business to a third party
- grants from government for conducting certain qualifying activities, such as setting up a new business
- sponsorship from another organisation for promoting or displaying its brand name
- donations made to non-profit organisations of charities (NGOs) by personal or institutional donors
Mattel 1Q Profit Falls On Higher Expenses

Mattel
Read the article Bratz lawsuit takes toll on Mattel profit, (you can do this in the window below or follow the previous link to read the article in a separate window) and then consider answers to the questions below.

You may also wish to read the following articles before you attempt the questions below:

 Question 1
Define the terms:
- revenue
- expenses.
Question 2
Explain the reasons why Mattel's sales revenues rose 8%, but its profits fell 33%.
Question 3
Analyse the implications for Mattel of its dispute with MGA manufacturer of the rival Bratz dolls.
Question 4
Evaluate Mattel's strategy of maintaining a diverse portfolio of products and countries.
Costs and decisions
Most firms make more than one product and so may have trouble allocating fixed costs to the products (see the next section on multiproduct firms). One alternative to dealing with this issue is not to allocate a proportion of fixed costs to each product line product at all, but to employ the concept of contribution.
Contribution to fixed costs
To make a profit, the price charged for a product or service must cover both fixed and variable costs. Contribution really is shorthand for the term 'contribution to fixed costs and overheads'. If average variable cost is deducted from the unit price the amount left is a contribution to fixed costs.
Contribution is the difference between price and the direct, or variable costs, of a product or service.
![]()
For a multi-product firm, total contribution can be calculated by the formula:
![]()
A product is worth making and selling if it makes a contribution to fixed costs. Since fixed costs have been paid already, any contribution is better than nothing. In this form of costing, fixed costs or overheads are treated as a cost centre. This makes them visible rather than hiding them in a notional product cost.
Let's look at Low Fidelity Ltd. It produces DVD players and DVD units for computers. The firm knows the following financial details:
| Fixed costs | $100,000 per week | |
|---|---|---|
| Variable costs | DVD | $50 per unit |
| Computer units | $65 per unit | |
| Selling price | DVD | $220 each |
| Computer units | $180 each |
DVD's make a contribution of $170 each and the computer units $115 each. The profits cannot be divided between the products. The total profit made by the firm is known, however, as is the contribution each product line makes.

Contribution example
| Contribution analysis - Student Computers plc - sales Units $'000's |
|---|
| Product | A | B | C | D | Total |
|---|---|---|---|---|---|
| Revenue | 2,000 | 3,000 | 2,000 | 2,000 | |
| Variable costs | 500 | 2,000 | 1,500 | 500 | |
| Contribution | 1,500 | 1,000 | 500 | 1,500 | 4,500 |
| Overheads | 4,000 | ||||
| Profit/(Loss) | 500 |
Any or all of the following will increase profits:
- Increasing sales of products
- Decreasing unit variable costs
- Reducing overheads.
Contribution can also be calculated on a per unit basis and used in the same way, for example:
| Contribution analysis - McDonalds Soups plc |
|---|
| Variety | A | B | C | D | E | F | G |
|---|---|---|---|---|---|---|---|
| Price per unit | 10.50 | 8.75 | 12.54 | 22.75 | 13.45 | 10.00 | 26.45 |
| VC per unit | 5.25 | 1.36 | 4.27 | 11.75 | 6.75 | 5.00 | 12.00 |
| Contribution per unit | 5.25 | 7.39 | 8.27 | 11.00 | 6.70 | 5.00 | 14.45 |
All are worth making since they all have a positive contribution. Soup variety F, however, is the most vulnerable if McDonalds Soups is looking to rationalise its product range.
Overhead costs are thus put under the microscope.
Contribution analysis for multi-product firms
 Calculating the profitability of a product relies on the firm being able to establish the costs that it incurs in production. However, firms that manufacture more than one product may do so in shared facilities. For example, a firm may have one factory containing three product lines. For each product, it may be possible to identify exactly the amount of raw materials being used, the cost of the employees working on that line and additional costs such as transport and packaging. These direct costs can be deducted from the revenues that product earns. However, what does the firm then do with the bills for utilities, such as electricity, water and gas? Even more problematic are back-office expenses, such as the salaries of support staff in IT, Marketing or Human Relations departments - how are their salaries allocated?
Contribution analysis works on the principle that any division of these costs is likely to be arbitrary and inaccurate. For example, any employee working in marketing would have to record every minute spent working on the marketing of a particular product so that the correct proportion of his/her salary could be charged to that product. However, how would the charge be made if the employee was working on a promotion for the firm itself, rather than a particular product?
Contribution analysis adopts the principle that only the costs directly attributable to a product will be allocated and deducted from revenue and that the remaining figure is that product's contribution to the unpaid fixed and indirect costs (overheads). To calculate whether a multiproduct firm makes a profit overall, the contributions for every product are totalled and then compared to the unpaid fixed and indirect costs.
The following formula is then used to calculate the firm's profit:
Profit = Total contribution - (Total fixed costs + total indirect costs)
Using this method of unapportioned fixed costs and indirect costs means that a product may be retained as long as it makes a positive contribution.
This method of costing can be used for the following:
- Setting of product priorities - the products with the highest contribution are considered the most viable and given the highest investment/marketing priority. Look again at McDonalds Soups. Soup variety G makes the greatest contribution per unit, so should be supported. However, add quantities and the picture might change.
| Contribution analysis - McDonalds Soups plc ($) |
|---|
| Variety | A | B | C | D | E | F | G |
|---|---|---|---|---|---|---|---|
| Price per unit | 10.50 | 8.75 | 12.54 | 22.75 | 13.45 | 10.00 | 26.45 |
| VC per unit | 5.25 | 1.36 | 4.27 | 11.75 | 6.75 | 5.00 | 12.00 |
| Contribution per unit | 5.25 | 7.39 | 8.27 | 11.00 | 6.70 | 5.00 | 14.45 |
| Sales (units) | 1,000 | 500 | 900 | 200 | 1,200 | 3,500 | 250 |
| Contribution | 5250 | 3695 | 7443 | 2200 | 8040 | 17500 | 3612.5 |
The situation appears very different once demand is factored into the analysis. Soup variety F now appears to be the best proposition.
- Product portfolio management - any new product will have to earn more contribution than the one it replaces. However, the contribution used (unit or total) will affect the result as illustrated above.
- Make or buy decisions - these are decisions about whether the firm should produce goods themselves or buy them in.
- Acceptance of special orders - this method helps firms, which do not usually use contribution costing, come to a decision on whether to supply at a price different to the one it normally charges (see next page for further details).
Special orders
Let's look at an example of the last option from the previous page - acceptance of special orders:
Computers for Germany - special order
Student Computers plc. has received an order for 500 computers from a University in Germany, which is not one of their regular markets and is not included in their sales plan. The computers normally sell for $500, but the German University is only prepared to pay $350. The cost structure of the product is shown as:
| Price | $500 |
|---|---|
| Variable cost | $200 |
| Allocated overheads | $200 |
| Profit | $100 |
 The view of some managers is that they should refuse the order since they will make a loss of $50 per computer if price is only $350 instead of the normal $500. However, because it is a special order all the overheads are already allocated. This means that the computers will make a contribution of $150 each to fixed costs. On this basis, the order should be taken on financial grounds, as this contribution is actually profit as fixed costs have been paid.
There may still be grounds for refusal, though. Will the order and its lower price:
- encourage existing customers to expect a similar reduction in price?
- set a precedent for future sales?
- affect brand image?
If the answer to any of these questions is 'yes', it may be wise to refuse the order, or at least try to negotiate a higher price.
Cost centres and profit centres

Previously, we met the concept of budgets and variance analysis. These are part of the management accounting function within a company. Financial plans are used to predict what will happen, and become the basis for action where necessary. They are rather like the data used when navigating a ship or aircraft. They measure and report where a company is, and enable the management to plot a course, so that it arrives at its financial destination.
If a firm is to maximise profit it needs effective financial management. Forecasting and controlling revenues and expenditure is the basis for this financial planning. The difference between the total revenues and total cost is the profit. If the firm is large the management of revenues and costs is likely to be complex, so the firm is often divided up into a series of departments, or cost and profit centres to simplify the process and to support more micro-analysis. Cost and profit centres can be isolated financially with individual managers held responsible for costs incurred, and revenues generated.
The concepts of profit and cost centres underpin effective financial management.

Profit centre
A profit centre is a division, or part of an organisation, where costs and revenues can be clearly identified, isolated and recorded allowing the profit it generates to be determined. The profit centre should be under the control, or responsibility, of one manager.
Cost centre
A cost centre is a division or part of an organisation that generates costs which can be clearly identified, isolated and recorded, but is not directly producing revenues so profit cannot be determined. The cost centre should be under the control, or responsibility, of one manager.
 Examples of profit/cost centres:
- departments
- products
- factories
- groups of machines
- locations e.g. regional offices
- functions
- sections
- individuals
For example a school may be both a profit and a cost centre. If a school is privately run and part of a consortium or group of schools, and students (or their parents) are charged fees, the school generates revenues and costs. The profit can be calculated for each school in the consortium and performance measured. However, identifying profit centres within schools is more problematic. Can a department be a profit centre? This would be difficult unless a notional fee is established for a particular course or subject to calculate total revenues. It is more likely that departments within schools, both in the profit and non-profit sectors, will be considered cost centres. Costs can be identified in terms of teacher wages and the costs of equipment and materials used in that department. Most departments are allocated a budget which provides responsibility and accountability.
One advantage of cost centres is that the firm is not concerned if costs are fixed or variable. If it is a cost, then it belongs in a cost centre.
The purpose of creating cost and profit centres is to develop a financial system where there is direct responsibility and accountability. For this to be an effective system, there must also be authority. In other words, the person managing a cost or profit centre must also have the authority to change things and make decisions, as well as carrying the responsibility when things go wrong.
NO ACCOUNTABILITY WITHOUT AUTHORITY
All divisions of an organisation are potentially cost centres. Examples are production, personnel, accounts, and transport. A few, however, are profit centres as well. Examples are the sales department or, if the firm is organised that way, individual brands.
Why have cost and profit centres?
Cost and profit centres have three main purposes:
- Financial accounting. They enable a firm to see how it is performing in comparison with budgeted figures.
- Motivational. By giving staff targets, and also delegating authority, they are motivated to do well. Departments and smaller teams tend to be more effective than larger business groupings. They may be rewarded for good performance, and helped to avoid poor results. Responsibility must be linked to the necessary authority.
- Organisational. By breaking the firm down into manageable chunks, senior management can monitor performance and identify strong and weak areas in the organisation. As a result it can focus production on particular units. Management time can then be concentrated on the areas where it is required and not wasted where it is not.
If a firm is broken down into cost and profit centres with agreed budgets, and carefully monitored using tools such as variance analysis, the firm possesses a powerful controlling mechanism. Used constructively, senior management have the means to identify high performing parts of the business and those which needs attention. It also provides a means of measuring and assessing staff and rewarding them accordingly.
Effective use of cost centres means that no part of an organisation will be hidden or unaccountable. All overhead departments, or STAFF FUNCTIONS, are clearly recorded and accounted for. Once this is revealed it is often possible to make considerable savings, and thus increase profits.
How the system is used will depend on the style of management adopted by the firm. This is another link to the human resource function and motivation. Business really is an integrated subject!
However, there are potential problems and issues associated with operating cost and profit centres:
- The allocation of costs, particularly overhead costs, is problematic. The method chosen for allocation will affect the level of costs apportioned and so influence apparent efficiency and profit levels.
- The performance of cost and profit centres can be influenced by external factors outside of the control of the managers running them, such as rising raw material and energy prices.
- They may encourage competition and conflict, especially where remuneration is affected by performance and profit levels.
- The pressure on cost and profit centres to cut costs may exclude consideration of ethical issues and result in organisations that perform well in terms of financial measures, but which fail to meet CSR targets.
Apportioning costs to profit and cost centres
 When considering contribution costing, we identified the arbitrary nature of trying to allocate fixed and indirect costs to products in a multi-product firm and examined the salary of an employee in marketing department. Contribution analysis is based on the principle that unless a cost is directly attributable to a product, it should not be apportioned.
However, many firms do attempt to allocate fixed and overhead costs. This may be as a way of making managers of departments and products aware of their responsibility for covering more than the direct costs of what they do. After all, the firm must pay for company-wide costs, such as administration costs, IT and rent, to establish whether it is profitable overall. The choice of method to allocate overhead costs will have a significant impact on the performance of each of a firm's cost and profit centres. The choice of method is at best quasi-scientific, and at worst subjective, because using one method may show a product is profit making, and using another method may indicate it is making a loss. Strategically, this could impact on whether a firm continues to sell a product or maintain a regional office.
Assume a factory produces 3 products A, B and C
| A | B | C | |
|---|---|---|---|
| WORKERS | 100 | 50 | 50 |
| AREA (%) | 40 | 20 | 40 |
| SALES (% of total) | 30 | 30 | 40 |
| COMPUTERS | 20 | 40 | 40 |
The following costs apply to the business:
| $ | |
|---|---|
|
Direct costs (Variable costs) |
|
| Raw materials | 100 000 |
| Wages | 200 000 |
| Total VC/DC | 300 000 |
|
Indirect costs (Fixed costs/overheads) |
|
| Rent of factory | 40 000 |
| IT costs | 20 000 |
| Catering costs | 6 000 |
| Administration | 4 000 |
| HRM | 10 000 |
| Marketing | 20 000 |
| Total FC/IO | 100 000 |
DIRECT COSTS: these are the costs that can be directly related to a department or product e.g. wages and raw materials. It is easy to identify the cost of the raw materials used to produce A and those cost of the materials used to produce B and C. These costs can be allocated to each product. The same applies to wages. Assuming each worker earns the same, the cost to A is 100 workers multiplied by the individual wage. For B this is 50 workers and will be half of the cost for A.
INDIRECT COSTS: these are costs that are not directly related to the cost of producing an individual product. For instance, how is the factory rent of $40 000 divided between the three products? The firm could decide to divide this cost up in proportion to floor area - product A assumes 40% of the rent as it has 40% of the area, but B only 20%. However, the firm could also decide to divide it up according the ratio of sales, or by some other method.
Similarly how does the firm divide up the cost of the HRM department? This could be in the ratio of the number of workers of A B and C - 100:50:50 (2:1:1) or could be on area or sales.
Some choices for allocation may appear more sensible, but still may lead to inaccuracies.
Why? - Any allocation of costs to A, B and C is likely to be inaccurate. For example, the HRM department may spend most of its time dealing with the staff making product B and not product A, despite the fact that there are fewer staff in number.
However, it is necessary for someone to pay indirect costs as it is impossible to work out PROFIT until indirect costs are paid.
The most common methods of allocating costs are:
- Full costing
- Absorption costing
- Marginal costing
We consider each of these methods on the next few pages.
Full Costing
Full costing takes the overheads of the business and allocates them according to a single criterion. The firm may choose to allocate overheads using one of the following:
- Employees
- Area
- Sales revenue
- Output volumes

| A | B | C | |
|---|---|---|---|
| $ | $ | $ | |
| Revenue | 200 000 | 160 000 | 170 000 |
| Direct costs | |||
| Raw materials | 30 000 | 40 000 | 40 000 |
| Wages | 80 000 | 60 000 | 60 000 |
| EMPLOYEES | 100 | 50 | 50 |
| AREA (%) | 40 | 20 | 40 |
| SALES (% of total) | 30 | 30 | 40 |
| COMPUTERS | 20 | 40 | 40 |
| Indirect costs (FC/IO) | $ |
|---|---|
| Rent of factory | 40 000 |
| IT costs | 20 000 |
| Catering costs | 6 000 |
| Administration | 4 000 |
| HRM | 10 000 |
| Marketing | 20 000 |
| Total FC/IO | 100 000 |
Allocation of fixed costs/indirect overheads in proportion with:
1. Employees (ratio 2:1:1)
| A | B | C | |
|---|---|---|---|
| $ | $ | $ | |
| Revenue | 200 000 | 160 000 | 170 000 |
| Direct costs | |||
| Raw materials | 30 000 | 40 000 | 40 000 |
| Wages | 80 000 | 60 000 | 60 000 |
| Indirect costs | |||
| Employees (2:1:1) | 50 000 | 25 000 | 25 000 |
| Total costs | 160 000 | 125 000 | 125 000 |
| Profit | 40 000 | 35 000 | 45 000 |
2. Area ( ratio 2:1:2)
| A | B | C | |
|---|---|---|---|
| $ | $ | $ | |
| Revenue | 200 000 | 160 000 | 170 000 |
| Direct costs | |||
| Raw materials | 30 000 | 40 000 | 40 000 |
| Wages | 80 000 | 60 000 | 60 000 |
| Indirect costs | |||
| Area (2:1:2) | 40 000 | 20 000 | 40 000 |
| Total costs | 150 000 | 120 000 | 140 000 |
| Profit | 50 000 | 40 000 | 30 000 |
What these results show is that the choice of allocation using the number of employees or using the relative area dramatically affects the relative profitability. Product C goes from being the most profitable product using the workforce to allocate fixed costs/indirect overheads to being the least profitable using the production area.
Evaluation of full costing
All the overhead costs are totalled and then divided according to the selected criterion. This method is simple to use and, therefore, cheap to administer. It ensures that all the costs are allocated and paid for. However, it may result in some clear anomalies. For example, if the value of sales is used to allocate overheads, a small department of only 10 staff, but with high sales revenues, may be allocated the same charge for catering costs as much larger departments of several hundred.
Absorption costing
We have already said that fixed costs and overheads, such as heating and lighting, are not easily apportioned to specific profit/cost centres. These costs arise throughout the firm. However, they must still be paid for and absorption costing, like full costing, seeks to apportion these costs between the profit/cost centres.
Where full costing selects just one criterion as a means of allocation, absorption costing attempts to be more 'scientific' in the allocation, apportioning individual overheads using the most logical criterion.
Common methods of apportionment for a profit/cost centre include:
- Floor space
- Number of staff employed
- Value of machinery
- Sales revenue
- Direct labour hours worked
The method chosen should be appropriate to the type of overhead to be apportioned. For example, rent would probably be apportioned to the different cost centres based on the floor space of each cost centre. Whereas, HRM costs may be apportioned according to the number of people employed by each cost centre, since employees are the focus of the HRM department.

Example 1
The following data is available for Gray Ltd relating to their three cost centres.
| Machining | Assembly | Administration | Total | |
|---|---|---|---|---|
| Floor space | 50 sq m | 30 sq m | 20 sq m | 100 sq m |
| No of staff employed | 15 | 25 | 10 | 50 |
The overheads incurred are as follows:
| $ | |
|---|---|
| Heating costs | 10,000 |
| Canteen expenses | 25,000 |
It would seem appropriate to use the following bases for the apportionment of these overheads:
| Apportioned by: | |
|---|---|
| Heating costs | Floor space |
| Canteen expenses | No. of staff employed |
Have a go at apportioning the overheads for Gray Ltd and then follow the link below to see how you got on.
Example 1 - apportionment of overheads
Evaluation of absorption costing
Absorption costing is more complex than using full costing, but it is fairer in that the allocation of costs mirrors reality more closely, in that the usage of each product is taken into account. As such, the cost per unit of output is likely to be more accurate, and will inform pricing policy if a cost-plus policy is used.
However, the allocation of costs is still arbitrary to some extent and inaccurate. It is likely to be more time-consuming and costly than full costing or contribution costing methods.

5.2 Costs and revenues - questions
In this section are a series of questions on the topic - Costs and revenues. The questions may include various types of questions. For example:
- Self-test questions - on-screen questions that give immediate marking and feedback
- Short-answer questions - a series of short-answer questions to help you check your understanding of the topic
- Case study - a case study with associated questions
- In the news - questions based around a topical business news article
Click on the right arrow at the top or bottom of the page to work through the questions.
Cost centres and profit centres - short answer questions


Question 1
Explain the difference between a cost centre and a profit centre.
Question 2
Describe the difference between authority and responsibility.
Question 3
Explain two reasons for having cost/profit centres.
Question 4
Explain why a profit centre is also a cost centre, but not all cost centres are profit centres.
Question 5
Explain how a school can be a profit centre, but why department within it are normally cost centres.

Methods of costing - short answer questions

Question 1
Define the term 'contribution'.
Question 2
'A firm that makes more than one product does not know what they cost to make, but knows exactly how much profit the firm has made.' Discuss.
Question 3
Explain why contribution is as important to most firms as profit.
Question 4
Analyse the reasons why a firm may sell a product for less than its total cost of production.
Question 5
If you ran a supermarket, discuss how you could use the concept of contribution to maximise your profits.
Contribution costing - numerical questions


Question 1
Medallion Meats Ltd
Medallion Meats makes sausages in a single factory. It has a policy of having a range of 6 sausages on sale at any one time. Its Research and Development team has just developed two new varieties.
The Board has to consider the position at the next Board Meeting and decide which sausages it will sell for the next year and which sausages it will stop making.
You are the Brand Manager for sausages, and you are expected to recommend the new range to the Directors at that meeting. Considering the following data, prepare a Board Paper giving and supporting your recommendations.
E1 to E6 are the existing sausages and N1 and N2 are the new varieties.
| E1 | E2 | E3 | E4 | E5 | E6 | N1 | N2 | |
|---|---|---|---|---|---|---|---|---|
| Price | 10.50 | 12.70 | 13.80 | 9.27 | 15.80 | 26.10 | 13.20 | 32.50 |
| Variable cost | 3.50 | 6.80 | 5.20 | 3.37 | 9.26 | 18.10 | 5.00 | 16.50 |
| Sales | 100 | 200 | 80 | 250 | 300 | 100 | 500 | 100 |
What non-financial factors that should be taken into consideration in the decision-making process?
Question 2
Floodlight plc
Floodlight plc makes lamps and pylons for roads, car parks and sports stadiums. It makes a standard unit at its main factory and specialised lighting at a smaller industrial unit.
It has capacity to produce 20,000 units per year of its standard product. The factory has fixed costs of $10 million per year and variable costs of $500 per unit. It is three quarters through the current trading year and has sold only 10,000 units to date. The current selling price of the standard unit is $1,300.
The firm has received an order from a new customer for 5,000 units at a special price of $1,000 each.
There is considerable doubt at Board level over this order. Some of the Directors think they will be selling at a loss and believe the standard unit should sell as the fixed, standard price or not at all. The remaining Directors, however, think this order has merit.
Consider the evidence, and then advise the Board what it should do.
Question 3
Worf Ltd manufactures umbrellas. The cost of producing an umbrella is as follows:
| $ | |
|---|---|
| Materials ($2 per metre) | 2 |
| Labour ($4 per hour) | 4 |
| Other variable costs | 1 |
The fixed costs for the year are expected to be $150,000.
Each umbrella sells for $11 and the firm expects to sell 50,000 umbrellas each year.
The production manager intends to purchase new machinery, which will allow the umbrellas to be produced in 50% of the time taken previously. Staff will need training to operate new machinery and this trading will imply a one-off increase to fixed costs of $50,000.
(a) Calculate the contribution per unit, both before and after the introduction of the proposed change.
(b) Calculate the expected total contribution if the firm's sales expectations are met - both before and after the proposed change.
(c) Calculate the expected profit if the firm's sales expectations are met - both before and after the proposed change.
Question 4
Hawkins Ltd manufactures computer desks.
At its existing output, its variable costs are as follows:
| $ | |
|---|---|
| Materials | 20 |
| Labour ($5 per hour) | 15 |
| Other variable cost | 9 |
The fixed costs for the year are expected to be $190,000.
Each desk sells for $60. The company expects to sell 15,000 desks each year.
The manager intends to purchase new equipment which will reduce the time taken to produce each desk by one third. The equipment will cost $65,000.
(a) Calculate the contribution per desk sold:
(i) Before the purchase of the equipment
(ii) After the purchase of equipment
(b) Calculate the expected profits earned for the year:
(i) Before the purchase of the equipment
(ii) After the purchase of equipment
Question 5
Consider the following data for a firm producing kitchen equipment:
| Microwave ovens | Food Processors | Toasters | |
|---|---|---|---|
| Per unit | $ | $ | $ |
| Selling price | 7.00 | 10.00 | 13.00 |
| Labour cost | 2.00 | 4.00 | 6.50 |
| Materials cost | 3.00 | 2.50 | 4.50 |
| Other direct costs | 1.00 | 1.50 | 2.00 |
The following data relates to the expected production for the next financial period.
| Units | |
|---|---|
| Microwaves | 2000 |
| Food processors | 3000 |
| Toasters | 2500 |
(a) Produce a table which shows the total contribution per product.
(b) Produce a report which evaluates the argument that production of toasters should be halted.
Make or buy decision
Question 6
Simeon Ltd manufactures a range of educational products. An increasingly important product in its range is an interactive whiteboard for schools and colleges. Data relating to the costs for October is as follows:
| $ | ||
|---|---|---|
| Direct materials | 30,000 | |
| Direct labour | 15,000 | |
| Manufacturing overheads: | Fixed | 5,000 |
| Variable | 7,000 | |
| Selling and distribution costs | Fixed | 15,000 |
| Variable | 12,000 |
The fixed costs are factory specific and are not specially related to the output of whiteboards.
Planned output for October is 500 whiteboards.
Each whiteboard is sold for $300.
A foreign supplier has offered to supply Simeon Ltd with the whiteboards for $150.
(a) Produce financial data which assesses the case for discontinuing production and buying in the whiteboards from the foreign supplier.
(b) Outline three factors which would suggest that Simeon Ltd should continue to produce whiteboards regardless of any cost savings that could be made in the short-term.
Special order decisions
Question 7
Woolnough Ltd, as part of their product range, produces the 'SILVTO'. This product normally sells for $160. The following costs are associated with its production.
| Cost per unit | |
|---|---|
| $ | |
| Direct materials | 34 |
| Direct labour | 75 |
| Variable overheads | 12 |
| Apportioned fixed costs | 25 |
The directors have recently received a request from a Latvian company offering to purchase 2,000 SILVTOs at a price of $140 each. Advise them as to whether they should accept or reject the Latvian offer.
Question 8
Hadley Ltd manufactures steel tubes that are used in the construction of refrigerators. Each steel tube requires raw materials costing $12 and requires 3 hours of skilled labour at $8 per hour. Other variable costs per tube include administration $5 and power costs $6.
Monthly fixed overheads are: selling and distribution $8,000 and administration $3,000.
The list price charged by Hadley Ltd is $60.
Hadley Ltd has been approached by Kemp plc, specialists in fitted kitchens, with the following proposals.
- That Hadley Ltd produces an additional 2,000 tubes per month for Kemp plc but under the condition that the selling price is at a 20% discount on the list price.
- That the special order be increased to 3,000 tubes per month provided that the trade discount is increased to 30%.
Required
Produce a report to the directors of Hadley Ltd explaining why they should either accept or reject either of the proposals by Kemp plc.

5.3 Break-even analysis - notes
In previous sections, we looked at production methods and costs and revenues. In this section we will examine the nature of break-even analysis.

By the end of this section you should be able to:
- Use graphical and quantitative methods to calculate the break-even quantity, profit and margin of safety

- Use graphical and quantitative methods to analyse the effects of changes in price or cost on the break-even quantity, profit and margin of safety
- Analyse the assumptions and limitations of break-even analysis
- Calculate required output level for a given target profit or level of revenue
Break-even analysis
A firm records its costs and revenue, because these figures allow it to calculate the level of profit or loss on its operations. However, almost as important as knowing the level of profit, is knowledge of the level of output required to make that profit. This knowledge will allow a firm to plan its production levels, and as a consequence will have knock on implications for marketing, HRM and finance departments.
When total costs are greater than total revenue the firm makes a loss.
When total costs are less than total revenue the firm will make a profit.
 The point at which a business generates enough revenue to cover all of its costs without any surplus is known as the break-even point or break-even quantity. The firm knows that any units produced, and sold, beyond that point will represent a profit for the business. New firms and new products are unlikely to be profitable immediately as set-up costs tend to be high and revenues relatively low as the product is not well-known in the market place. In the early days after set-up, a new firm is likely to be making a loss. However, the business plan should identify a time at which it expects its revenues to match its revenues and it will break even.
Amazon.com

Amazon.com was founded by Jeff Bezos in 1994, making it one of the first companies to sell goods over the internet. The business name was chosen because the Amazon River is one of the largest rivers in the world and so the name suggests large size and power. It also started with the letter 'A', and as a consequence, Amazon.com would appear near the beginning of alphabetical lists. Amazon.com started as an online bookstore, but quickly diversified into selling additional product ranges such as DVDs, CDs, and music downloads, computer software, video games, electronics, clothing, furniture, food, and toys. A common anecdote is that the Bezos wrote the Amazon business plan while he and his wife were in a car en route to Bellevue, Washington (next to Seattle) from Texas. This business plan was rather unusual in that the company was not expected to break-even for the first four to five years. However, it did not actually make any profit at all until 2003, when it recorded a substantial profit of $ 3.9 billion. Fortunately for Amazon.com, its investors were prepared to wait that little bit longer for their money, although there was some nervousness in 2001, with many dot-com set-ups going to the wall and with Amazon reporting a fiscal loss of $1.4 billion.
Since 2003, Amazon has gone from strength to strength and announced a profit in 2010 of $24.5 billion.
Amazon.com considers itself a completely customer centric company, which is reflected in their company values statement:
- Customer Obsession: We start with the customer and work backwards.
- Innovation: If you don't listen to your customers you will fail. But if you only listen to your customers you will also fail.
- Bias for Action: We live in a time of unheralded revolution and insurmountable opportunity- provided we make every minute count.
- Ownership: Ownership matters when you're building a great company. Owners think long-term, plead passionately for their projects and ideas, and are empowered to respectfully challenge decisions.
- High Hiring Bar: When making a hiring decision we ask ourselves: "Will I admire this person? Will I learn from this person? Is this person a superstar?"
- Frugality: We spend money on things that really matter and believe that frugality breeds resourcefulness, self-sufficiency, and invention!
Using its customer base and technology infrastructure Amazon as moved rapidly into cloud based services. Amazon Web Services (AWS), which lets customers rent servers to house data and run computer networks, may one day be larger than the retail business, the company has said. In 2010, Amazon opened a new data centre in Singapore to give customers in Asia, India, and Australia speedier access to its AWS business. That business lets companies buy from Amazon, on an hourly basis, computing power that's delivered over the Internet.
There was some doubt in the early years that Amazon.com would ever make a profit and in 2001 there were some fears that Amzon.com might go the way of other dot.coms and crash. Read the article Will Amazon ever make a profit?, which refers to this period (you can do this in the window below or follow the previous link to read the article in a separate window), and then consider the questions below.

You may also like to read the businessweek article Amazon.com's Profit Forecast Falls Short of Estimates, which provides a recent commentary on Amazon.com's business model and profitability.

Question 1
Distinguish between a positive cash-flow and profit.
Question 2
Explain why fans of the firm believed that Amazon.com's 'first mover' advantage was one of the biggest strengths in the online marketplace.
Question 3
Analyse the importance of the information in Amazon.com's business plan to different stakeholders.
Question 4
Using information from the articles and support material, evaluate the need for Amazon.com to change its objectives in response to changes in the internal and external environment.
Break-even analysis - calculation
Break-even analysis is a method for finding out the minimum level of sales necessary for a firm to cover its costs. At the break-even point the revenue obtained from the sale of a number of items, equals all the costs paid out in making and selling them.
Break-even analysis is a very popular examination topic, so must be practised and fully understood. The IB Business and Management guide expects candidates to be able to calculate break-even using both graphical and formula/quantitative methods.
In reality, the preparation work for drawing the break-even chart will provide the details to make some judgments on the break-even point, so using this or the formula methods means you can check the accuracy of your graph as you draw it!
You must be able to draw or modify a break-even chart and then to analyse its consequences for a firm. To be able to do this you must understand in detail costs and revenues. In an earlier section we examined classifications of business costs and constructed cost curves that represented these costs. If we add a revenue curve to these cost curves, we get the basis for break-even analysis and a break-even chart. In the interaction below we have drawn all these together on a single graph. Click on the various markers to find out more about each curve.
If you would prefer to view this interaction in a new web window, then please follow the link below:
Building a break-even chart

Break-even chart
A diagram showing how total costs and revenue change with increasing production / sales.
If you would prefer to view this interaction in a new web window, then please follow the link below:
To be able to handle break-even questions, you have to be able to identify and draw the total cost and the total revenue lines. Let's do some quick revision of these, and then some very useful mathematics:
![]()
![]()
![]()
Remember from section 5.2; costs are either fixed (FC) or variable (VC). Total costs (TC) are the sum of fixed and variable costs. Also remember, that fixed costs are those costs which do not vary with the number made or sold and that variable costs are those that change in proportion to production and sales.
![]()
![]()
![]()
If the maths has just blown you away, don't worry at this stage - we will come back to some numerical examples.
Drafting a break-even diagram
You must be able to draw the following diagram: figure 1, from given information.
Figure 1 Break-even diagram
You may be asked either to draw a break-even chart from scratch, to complete one on a given piece of graph paper, or to modify a given chart to reflect changes given in the case. Any of these versions tests your knowledge and understanding of break-even analysis. As with any question, the first stage is to read it carefully before you rush in and put pen to paper. Make sure that you know exactly what is expected of you.
On the following pages, we look at these two possibilities - drawing from scratch and modifying a given chart.
Drawing a break-even diagram
Do not rush into drawing. Think first, and you will see it is wise to work out the BEQ before putting pencil to paper.
Having read the question you may now start to follow a procedure. You will be given fixed costs, price and variable costs for a product and a period of time. Remember the alternative words for fixed and variable costs.
Step 1 Extract the data
Extract the data required from the question or text. (The use of case study questions and the provision of written stimulus material provides the scope for the 'hiding' of data.)
You should now have identified: FC per period of time, price per unit and VC per unit. Assume you have extracted the following information from your case study:
- FC: $480 000 per month.
- VC: $60 per unit
- Price: $120 per unit
The decision whether a cost is fixed and variable sometimes causes problems. Do not be confused by the title, or name, but look at the units given. If costs are 'per unit' or 'per number made or sold' then the cost concerned is variable. If the costs are 'per unit time', e.g. per year, then the costs are fixed costs.
Step 2 Calculate the BEQ
The break-even formula is relatively simple:
![]()
We have already discussed contribution in some detail and said its full title is contribution to fixed costs and overheads. In a break-even question there are two terms you will probably never see:
- Overheads
- Semi-variable costs
Both these terms add unnecessary complications to the analysis and are not used.
So, for simplicity, we will define contribution here as contribution to fixed costs.
This break-even formula is very logical really. If each unit sold covers its variable (direct costs) and then contributes another $20 to fixed costs, it is very easy to say when fixed costs will be paid, e.g.
| Fixed costs $ | Contribution $ | Break-even quantity |
|---|---|---|
| 40 | 20 | 2 |
| 80 | 20 | 4 |
| 400 | 20 | 20 |
| 800 | 20 | 40 |
In all of these examples, fixed costs are paid when enough units are produced and sold to generate enough contribution.
![]()
Insert the correct numbers (watch the zero's)
![]()
So we now know that the BEQ is 8,000 units per month. We know where the TC line will cross the TR line. This is a useful check when you construct your graph.

N.B. If the question asks you to construct a break-even graph, just using the BEQ formula will result in you losing marks.
Now we can start drawing, step by step.

It is advisable to construct a table before drawing the break-even chart:
Your table should look like this:
| Quantity/output | Costs ($000) | Revenues ($000) | Profit/loss ($000) | ||
|---|---|---|---|---|---|
| Fixed costs | Variable costs $60 per unit | Total cost | Total revenue (P x Q) $120 per unit | ||
| 0 | 480 | 0 | 480 | 0 | (480) |
| 2 000 | 480 | 120 | 600 | 240 | (360) |
| 4 000 | 480 | 240 | 720 | 480 | (240) |
| 6 000 | 480 | 360 | 840 | 720 | (120) |
| 8 000 | 480 | 480 | 960 | 960 | 0 |
| 10 000 | 480 | 600 | 1 080 | 1 200 | 120 |
| 12 000 | 480 | 720 | 1 200 | 1 440 | 240 |
| 14 000 | 480 | 840 | 1 320 | 1 680 | 360 |
| 16 000 | 480 | 960 | 1 440 | 1 920 | 480 |
Immediately from the table, it can be seen that the break-even point is 8000 units where TR = TC and profit is zero.
Also notice the patterns in the table which make the calculations easier. For example, for every 2000 units of output:
- VC/TC increases 120 000
- Total revenues increase 240 000
- Profit increases 120 000
Step 3 Fix the X axis (capacity)
You will be able to start drawing very soon!
If you are given a maximum capacity, use that figure. If not, double the break-even quantity is a good guide figure, or 16,000 units in this case.
Now sketch that information.
Figure 4 Building a break-even diagram from scratch (1)
Step 4 Fix the Y axis (revenue and costs)
Revenue is usually the greatest figure. In this case the maximum revenue is 16,000 x $120 = $1.92 million (price per unit x maximum possible sales).
Figure 5 Building a break-even diagram from scratch (2)
Step 5 Plot the TR axis
This passes through the origin, since there is no revenue if there are sales. You also know that TR = $1.92 million when sales = 16,000
Figure 6 Building a break-even diagram from scratch (3)
Step 6 Add the FC line
Fixed costs are the same, irrespective of output. So mark on the Y axis the value of the FC. In this case it is $480,000. Then draw the fixed cost curve.
Remember, fixed costs are the costs of producing at 'output zero'.
Figure 7 Building a break-even diagram from scratch (4)
Step 7 Add the TC Line
You know that this crosses the TR line at the BEQ, and that it starts at the FC at output zero, so draw it.
Figure 8 Building a break-even diagram from scratch (5)
You also know that the TC at maximum output of 16,000 units is:
$480,000 + 16,000 ($60) = $1.44 million.
Remember to add labels to the two axes and to give the chart a title! It is no exaggeration; there may be a mark or two available for this. Always take the 'gift marks'.
You now have an exact break-even diagram.
Break-even route map
Note and remember the 'Route Map' for drawing a break-even chart.
The other tasks you may be given are based on this basic technique.
Completing a break-even chart
In some exercises you may be given a break-even chart with some data on it. You have to read the case material, extract the important data, and then complete the chart.

Look at the two examples below.
The text for the two examples gives the following:
| Example A | Example B |
|---|---|
| At present the company sells 40 units for $150 000 each. | The company has fixed costs of $3 million and variable costs of $50,000 per unit |
| What is the BEQ? | What is the BEQ? |
| You know the TC, so have to find the TR. | You know TR so have to find TC |
| When sales = 40, Revenue = $6 million | FC = $3 million on Y Axis = TC for output 0 |
| Plot this. Where TC = TR = break-even point |
TC at output 40 = $3 million + 40($50,000) = $5 million |
| Plot this and find BEP and BEQ |
The completed break-even diagrams are as follows:
This is supposed to be a little easier to do than draw one from scratch.
Remember, when drawing a break-even chart, or completing one, always label the X and Y axes and give the diagram a title. You may even get a mark for doing this!
Margin of safety
The aim of most firms is to make a profit. Consequently the objective is to operate at a position as far to the right of the break-even quantity as possible - i.e. to produce and sell as many products as the firm can produce using its existing resources.
Having established the break-even quantity, therefore, the next step is normally to compare the BEQ to where the firm is actually producing. If it is above the break-even point, it will be making a profit and the firm is in a safe position as a result. How safe it is will depend on how far above the break-even point it is - the more the better as it improves its margin of safety.

Margin of safety
The margin of safety is the difference between the planned or actual level of production/sales and the break-even quantity. Firms will seek to maximise their margin of safety as this will maximise their potential profit.
Of course if a firm is producing below the break-even point it will be making a loss and there is no safety margin.
The margin of safety can be shown on a break.-even chart - see figure 1 below.
Figure 1 Margin of safety

Follow the links below to see some examples of the margin of safety:
Example 1 - Magnum Motors
Example 2 - River Craft
Example 3 - River Craft (2)
Remember:
- The margin of safety can be negative. This means there is a loss situation.
- Results based on forecast data will often be higher than achieved in reality. Forecasts of sales, made by marketing staff, tend to be too high while estimates of cost, made by development or production personnel, will often be too low.
- Margin of safety is usually expressed as a number, but this can hide useful information. Which is best, or safest, Example 2 or 3? It looks like 2, with the highest number. Express the figure as a % of BEQ, and a different picture is revealed.
- Margin of safety for 'Example 2' is 14%, but for 'Example 3' is 230%. '2' is much riskier, therefore.
Margin of safety has little value in relation to actual production and sales, the firm already knows that it is making a loss or not. It has value, however, as a planning tool as it shows risk, and should be included as part of the decision making process.
Margin of safety - example
This is usually expressed as a quantity, and you should always do this. However, it is better, as well, to put the margin of safety in context by expressing it as a percentage of the break-even quantity. Numbers alone can be misleading.

Example - margin of safety
Two competing companies in the MP3 market have the following break-even information about their production facilities and levels
| Company | 3tec | Zensa |
|---|---|---|
| Capacity | 2,000 | 700 |
| Break-even quantity | 750 | 200 |
| Production | 1,000 | 400 |
| Margin of safety (units) | 250 | 200 |
The larger margin of safety in absolute terms represents a smaller relative quantity. 3tec will go into a loss position faster than Zensa.
Break-Even: Worked example

Gadgets Direct
Gadgets Direct has the following cost and price information:
Direct labour: $25 per unit
Raw and packing materials: $15 per unit
Management costs - direct: $5 per unit
Indirect management costs: $25,000 per week
Variable overheads: $7 per unit
Fixed costs: $35,000 per week.
Price: $82 each
You are asked to draw a break-even chart for the firm.
In this case:
- variable costs are $52 per unit - the sum of all the 'per unit' costs.
- fixed costs are $60,000 per week - the sum of all the 'per week' costs.
![]()
![]()
![]()
Then follow the step-by-step procedure to draw the chart.
Steps 1 and 2 are done already.
Before you move on to step 3, draw up a table to support the graph.
Then draw the chart as you complete each step.
Step 3: 2 x 2,000 = 4,000 units per week maximum on X axis
Step 4: 4,000 x $82 = $328,000. Set Y axis to a maximum of $400,000.
Step 5: TR line goes from zero to $328,000, 4,000 units per week.
Step 6: FC are $60,000, so mark them on the Y axis
Step 7: Mark the break-even point on the TR line, and complete the TC line.
Add labels and title, and the diagram is finished. Now, follow the link to the answer and see if you have got it right.
Gadgets Direct break-even chart
Conclusion
Break-even analysis is a good way of presenting data in a visual form, and is easy to understand. However it has major limitations, which only HL students need to consider in any depth. Firms use break-even analysis where appropriate, but only as part of a comprehensive decision-making process. Break-even analysis is only one of a number of business tools a firm has in its toolbox and is best used with other tools to ensure that the firm has a solid foundation on which to base its decisions.

Changes in break even

In examinations, you may be required to modify break-even charts as the basis of a decision making process. Here you will be given a complete chart for the initial situation and then be asked to analyse the effects of changes in price or costs by analysing the impact on break-even quantity for the firm. The question may ask you to do this graphically or by using a quantitative method.
Changing any of the variables in a break-even chart will lead to a different break-even quantity. This will be important to the management as it may impact on strategic decision-making in the firm. It is likely to have real life consequences for those working for the business, as the firm may adjust its resourcing levels in response to any changes.

We will use a case study to illustrate potential changes and strategic impact.
Armornet computer cases
 Armornet produces one model of computer cases in a range of different colours. The cases offer exceptionally protection for netbook computers from impact, water and liquid damage and temperature change. They are designed for frequent travellers and for those professional who take their netbooks into high risk environments, such as construction sites. At present they are produced in relatively small numbers using a batch process.
The firm has gained a high reputation for quality and customer service and recently won an award from a major travel magazine. At present given the firm's resources, the maximum production in any month is 100 cases. They are presently working at capacity.
The following are details of pricing and costs.
Pricing: $1200 per case
Fixed costs: $640 000 per annum
Variable costs: $400 per case
The firm employs 4 full-time staff (two of whom are directors of the business) and 2 part-time administrative assistants. The cases are assembled in a small industrial unit using standardised parts from 3 different suppliers; two of which are overseas. There are no direct competitors offering the same specifications, but two other manufacturers produce cases at a lower price with lesser protection. However, the directors believe that one of these competitors, Airsquare is working on a higher specification product which will be sold for approximately $1000 and could be considered a substitute.
Using the break-even formula, the break-even point and margin of safety should easy to calculate? Can you calculate these in your head? Click here to see the answer to check.
Changing the price
Assuming that Airsquare introduces a cheaper case priced at $1000, Armornet will have to consider whether to match this price. If they decide to lower their price from $1200 to $1000, this will lower the total revenue curve from TR to TR2, with the effect that the break-even quantity increases from 800 units to 1067 units. The margin of safety will fall from 400 units to only 133. Profit will also fall significantly from $320 000 to only $80 000.
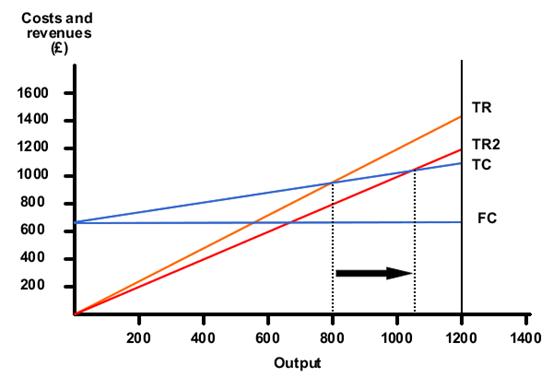
Armornet can use this information to underpin its strategic decisions. It may be that they will consider some of the following:
- Is $80 000 profit sufficient to ensure the security of the business and allow adequate funds for future development?
- Will reducing the price affect the reputation of its product?
- Can the business increase its production capacity?
- Can the business differentiate its product and retain its premium price?
- Is the business able to reduce its costs to retain its present profit margin?
- How price sensitive is the product, since the firm is working at capacity?
If the business chooses to examine its cost base, it will look at ways of reducing its fixed and/or variable costs.
Changing the fixed costs
As you will already know, fixed costs are costs that do not vary with output. Fixed costs include payments such as:
- Rent
- Office salaries
- Advertising
- Insurance
- Depreciation
It is possible that Amornet may find saving in fixed costs. It might move premises to a unit with lower rent; directors may accept lower salaries or the firm may reduce its advertising spend. All of these options are likely to have negative consequences. Moving may have associated costs and may be to a less advantageous location, lower salaries may affect motivation and reduced advertising may negatively affect sales.
Assuming fixed costs are reduced to £500 000, the effect will be to reduce the fixed cost line from FC to FC1 which will lower total costs as well, so reducing the break-even point from 800 to 625.
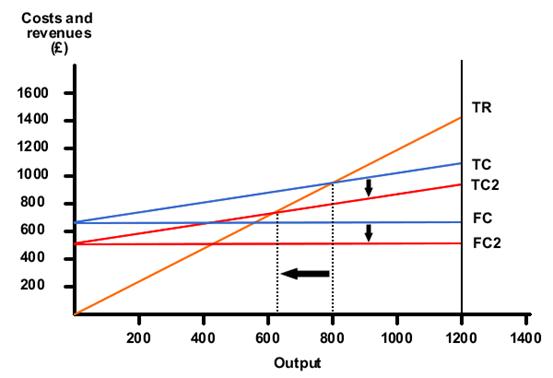
Changing the variable costs.
Variable costs are costs that change in direct proportion with output. The most common examples are raw materials and commission on sales. Armornet may seek to find cheaper suppliers. Of course, if this was simple it would probably have been done before. Cheaper suppliers may be less reliable and quality may not be as good, potentially compromising the brand's image. If a cheaper supplier is found, who is prepared to supply at £300 per case, the TC line will lower to TC2 (as TC + VC + FC), so lowering the break-even point from 800 to 711 units.
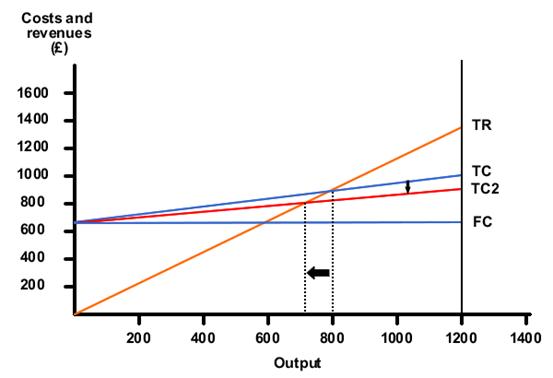
Target Profit and Revenue
The Business and Management syllabus requires that you calculate a required output level for a given target profit or level of revenue; in other words how many units of a product a firm needs to sell to make a certain level of profit. This can be worked out manually using a break-even chart, but this is not required and indeed, using a formula is significantly quicker.
Let's assume that Armornet wishes to make a profit of $320 000, then what quantity must they sell of their cases?
The formula used to calculate target profit is an adaption of the break-even formula:
![]()
The logic of this formula is quite simple. We know the formula for BEQ:
![]()
So if the break-even quantity is 800 units, all the fixed costs are paid off at that point. Therefore, any contribution becomes equivalent to profit, since all variable costs have also been paid to calculate the contribution (profit - variable cost). In essence the equation is calculating the number of units above break-even that is required to meet the target profit.
If we want to know how many units Armornet need to sell to make a profit of $320 000, we use the figures provided for Armornet, to calculate the answer:
![]()
![]()
![]()
The margin of safety is, therefore, 400 units.
Let us consider this solution another way; we know that the BEQ was 800 units. Every unit above that contributes another $800. However, since fixed costs have now been paid in full, that $800 per unit is pure profit. Consequently, another 400 units sold will provide the $320,000 target profit.
Examples - break-even analysis (1)
Now you can get down to some practice and make sure that you know, understand and can do break-even questions. There is a strong chance that you will be faced with one in your Business and Management examination.


You are now given cost and revenue information corresponding to a particular level of sales and production. Again, the key is to decide which costs are fixed and which are variable.
Garden Furniture plc
The Finance Manager for Garden Furniture plc has presented the Directors with the following data relating to the manufacturer of garden tables:
At the present sales and production level of 10,000 tables per quarter,
The firm has the following financial data for the previous quarter:
- Sales revenue of $1,000,000
- materials costs of $200,000
- labour costs of $100,000
- variable overheads of $100,000 and
- fixed costs of $300,000.
Task 1: Draw the break-even chart for the present operation. Fully label your diagram.
Task 2: Determine how much profit the firm would make if sales fell by 10%
When you have calculated the answer and drawn the break-even chart, follow the links below to see the calculations and the correct break-even chart. If you run into difficulties, have a look at the calculations and then try to draw the chart from them.
Answer task 1 - the calculations
Answer task 1 - the break-even chart
Answer task 2

Examples - break-even analysis (2)

Student Computers plc. is considering expanding its production of Zip File Readers/Writers, from the 1,600 Zip File units per week it currently sells. The chart below shows its present situation.
Figure 1 Break-even chart for Student Computers Plc
The planned expansion of the business will double the production capacity of the factory. Variable costs will decrease by $2 per unit, but fixed costs will increase by $10,000. To sell the additional output, price will be decreased by 10%. If Student Computers go ahead with this project, what will happen to their profitability?
Look at figure 1 above. Capacity was 2,000 units per month, so the new output will be 4,000 units per month.
At 2,000 units sold, TR was $60,000, so:
The price was ![]()
The new price will be $27 ($30 less 10%)
Fixed costs were $15,000 and are to rise by $10,000, so they will become $25,000.
Variable costs at an output of 1000 units were $15,000 (TC of $30,000 less $15,000 FC).
Variable cost per unit = $15. New variable cost per unit = $13.

Try drawing the new chart with this information. Fully label your diagram. Jot down some comments on how the changes will affect the firm. Once you have had a go, follow the link below to see the new break-even chart and compare your answer with ours. If it is at all different, then check back through the figures and see where you have gone wrong.
Revised break-even chart and data for Student Computers Plc
Having drawn the new chart, which will be rewarded in its own right, the next task will probably be an analysis of the effects and come to supported conclusions/judgements.
This information available is as follows:
| Was: | Will become: | |
|---|---|---|
| Break-even quantity | 1,000 | 1,950 |
| Break-even revenue | $30,000 | $50,000 |
Further analysis shows the following:
At maximum capacity now, 2,000 units per month, the firm would make $20,000 profit. With the enlarged capacity they will have to sell 3,200 units per month to achieve this level of profit.
They are now operating at 1,600 units per month, or 80% of capacity. Present profit is $12,000 per month. The new factory will have to operate at 2,700 units per month (68% of capacity) to match this profit level.
Conclusions/evaluation - this could be a profitable expansion, but just how many do they expect to sell, and when? It all depends on this information, which is not given.

Limitations of break-even analysis
Break-even analysis looks to be a very valuable and useful aid to decision making. Certainly, break-even charts are relatively easy to construct and provide managers with information on break-even forecasts, margins of safety and profit and loss at different output levels. Manipulation of break-even charts can be used to answer; 'what if?' questions and can be part of a strategic analysis, including the setting of prices and establishing the resource levels required to hit target profits.
However, there are a number of limitations of break-even analysis.
Evaluation of break-even analysis
Examiners like break-even questions as they are relatively easy to set, and require students to show numeracy skills. However, there are many assumptions in the break-even process that may limit its usefulness:
- All output is sold: break-even works on the basis that all output is turned into sales revenue. In reality, firms will have stocks of unsold items at any one time, unless they can work on a purely just-in-time basis.
- One product and price: most businesses sell more their products at different prices in different markets and to different customers. Customers who buy in bulk, for instance will be entitled to a discount. Break-even ignores all economies of scale.
- Straight line costs and revenue curves: if a firm is forced to adopt lower prices at higher output because the market is becoming saturated, then the revenue curve will not be a straight line. Similarly a firm's average variable costs are likely to be lower at higher outputs as it can negotiate a discount from its suppliers. The straight line assumption also means that semi-variable costs are assumed to be directly proportional to output and in essence are just lumped together with other variable costs - in fact the term semi-variable is not used at all.
-
 A static model where variables change independently of each other: in reality, the business world is dynamic and any increase in output and any change in costs is likely to impact on price levels. Break-even, like a balance sheet is only a snapshot of a situation at a particular point. Increasing shortages of energy, for example, will result in some significant increases in both variable and fixed costs.
 - Not all costs can be easiliy classified as fixed or variable.
- The result is no more accurate than the accuracy of the original data it is based on.
- It ignores all factors other than costs and revenues: production is also affected by the availability of finance, people and management influences, competitive action etc. For example, maximising production may place excessive pressure on staff and may require existing employees to work overtime, so changing the cost base.
- Reactions of competitors: break-even analysis ignore the fact that competitors may change their products/and or prices.
These assumptions mean that break-even analysis is only valid over a small range of outputs or sales and with single product firms.

Multi-product firms
What happens when a firm makes more than one product? Let's look at an example:
Maze Green Yachts Ltd
This firm has been set up to produce a new plastic fun boat. The cost profile is given below.
Fixed costs per month: $100 000
Variable costs per boat: $100
Selling price of boat: $300
![]()
![]()
![]()
![]()
Now draw the break-even chart, and then click CHART to see if you have got it correct.
Now the business expands and introduces a new model. The cost profile is now:
Fixed costs per month $150,000
Variable costs Boat A: $120 per boat, Boat B: $160
Price Boat A: $350, Boat B: $460
If you try and draw the charts, you will hit a problem instantly: how to decide on which fixed costs go with which boat. You cannot work this out accurately, so you cannot draw break-even charts. This is a major drawback of break-even charts and analysis, as it really only applies to single product firms.
Some firms may choose to apportion these costs using full-costing or absorption costing and conduct as separate break-even for each boat. The result may be quite inaccurate and is only as good as the method used to apportion the costs.

5.3 Break-even analysis - questions
In this section are a series of questions on the topic - Break-even analysis. The questions may include various types of questions. For example:
- Self-test questions - on-screen questions that give immediate marking and feedback
- Short-answer questions - a series of short-answer questions to help you check your understanding of the topic
- Case study - a case study with associated questions
- In the news - questions based around a topical business news article
Click on the right arrow at the top or bottom of the page to work through the questions.
Break-even analysis - numerical questions

Question 1
A company makes a product with a selling price of $20 per unit and variable costs of $12 per unit. The fixed costs for the period are $40,000. What is the required output level to make a target profit of $10,000?
Question 2
A company has fixed costs of $300,000 and produces one product with a selling price of $72.00 and a variable cost of $42.00 per unit. The maximum factory capacity is 20,000 units and it anticipates selling 15,000 units. Construct a break-even chart showing the break-even point and the margin of safety at present. Fully label your diagram.
How much profit will they make:
- at the present level of operation?
- if sales increase to the maximum that the factory can supply?
Question 3
The following information relates to a company, which produces a single product.
| Direct labour per unit | $ 22 |
|---|---|
| Direct materials per unit | $ 12 |
| Variable overheads per unit | $ 6 |
| Fixed costs | $ 400,000 |
| Selling price per unit | $ 60 |
- Define the term 'break-even'.
- Explain why break-even analysis is of reduced value to a multi-product firm?
- Use the figures above to construct a break-even chart showing the minimum number of units that must be sold for the company to break even. Fully label your diagram.
- Analyse the factors that any business should take into consideration before using break-even analysis as a basis for decision making.
Question 4
The Sherston Brick Company manufactures a standard stone block for the building industry. The production capacity for the year is 100,000 standard blocks. The selling price per block is $1.60, variable costs are $0.60 per brick and fixed costs are $60,000 per annum.
Determine:
- The break-even point in terms of sales revenue and output.
- The margin of safety if sales amount to 90,000 bricks in the year.
The market for blocks becomes much more competitive, and SBC reduces its price to $1.50 per brick. Sales still decline to 80,000 bricks, whilst costs rise relentlessly. Variable costs rise to $0.66 per brick and rises in business taxes and other contributions increase fixed costs to $80,000 per annum.
- Is the firm still profitable?
Question 5
Windy Sails Limited has prepared the following cost analysis for 6 months of trading.
| Sales (sets) | 1,800 |
|---|---|
| Price | $850 per set |
| Materials costs | $150 per set |
| Labour costs | $150 per set |
| Other variable costs | $150 per set |
| Overheads | $600,000 for 6 months operation |
- Draw the break-even chart for the company for the 6-month period.
- Determine the break-even quantity, and confirm this by calculation.
- Identify the firm's margin of safety for the period.
- Calculate the profit made during the period?
- Evaluate the use of break-even analysis to a company within its decision-making procedures.
Fully label your diagram.
Question 6
Provision plc makes luxury hampers for sale in a chain of high-class department stores. The following financial information is available:
| Wholesale price | $80 per hamper |
|---|---|
| Labour and material costs | $15 per hamper |
| Bought-in components | $25 per hamper |
| Overheads | $800,000 per year |
Current output and sales are set at 30,000 hampers per year, though the firm has the capacity to produce 50,000 hampers per year.
- Calculate the break-even quantity for the firm.
- Draw and fully label the break-even chart for the business.
- Identify the margin of safety.
- Calculate the level of profit the firm is making.
Sales go well, but the buyer puts pressure on Provision to reduce its prices. In the following financial year Provision expects sales to reach 40,000, but at a price of $75 per hamper. Labour and materials costs, and bought-in items are expected to rise in price by 15%, but Provision is planning to cut its fixed costs by 10%.
- Calculate how these changes will affect Provision's break-even quantity, margin of safety and profitability.
Question 7
Woodturn Ltd. makes a television table that sells for $50 per unit. It has variable costs of $30 per unit and incurs fixed costs of $100,000 per period. Construct the break-even chart for this operation and determine the sales value that the firm will have to reach if it is to make $20,000 profit per period.
Fully label your diagram.
Question 8
Bremend Ltd manufactures a computer stand. It has fixed costs of $500,000 and each stand sells for $120, with a variable cost of $70 per unit. The factory has a maximum capacity of 20,000 units and it anticipates selling 15,000 units each period. Construct the break-even chart for the business, showing the break-even point, and the margin of safety.
Fully label your diagram.
Question 9
Sibon plc manufactures soft toys for the European market. The costs incurred by the firm are as follows:
| $ | |
|---|---|
| Materials (per toy) | 5 |
| Wages (per toy) | 4 |
| Packaging (per toy) | 3 |
| Rent of premises | 5,000 |
| Machinery hire | 3,000 |
| Marketing and administration | 1,000 |
The soft toys sell for an average price of $16. Current capacity of Sibon plc is 3000 toys per year.
Required
- Calculate the following:
- Contribution per toy sold
- Break-even in units of output
- Break-even level of sales revenue
- Construct a break-even chart showing the break-even level of output and margin of safety.
Fully label the chart.
Question 10
John Pitman runs a small business specialising in delivering organic fruit and vegetables to the local area. He buys from local farms and packages these together in boxes and delivers them locally. Each box is sold for $12. He has the following costs
Direct wages are $9 per hour (30 minutes per box on average)
Fruit and vegetables are $4 per box
Other fixed costs incurred each year are as follows:
| $ | |
|---|---|
| Rent of delivery van | 4,500 |
| Rent of premises | 10,500 |
| Advertising | 2,000 |
- Calculate the marginal cost of producing one box of vegetables.
- State the formula for break-even in boxes (units)
- Calculate the break-even point in boxes (unit)
- Examine the factors that influence the setting of the price of a box of fruit and vegetables.
Break-even analysis - changes in variables - case study

In this case study the key facts have been extracted from text, so that the information concentrates on the break-even aspects. In an examination case study this data may be spread over different paragraphs and appendices. You have to learn to read material and extract the key data for the appropriate question.
KL Steam Engines plc.
KL Steam Engines makes a single narrow gauge steam engine in a factory in South East Asia These engines are sold to leisure centres and theme parks across Asia. It could make 80 units per year, and its cost structure is as follows;
- Fixed costs: $2.4 million
- Variable costs: $90 000 per engine
The product sells for $150 000 each, and they produce and sell 6 units per month at the moment.

Question 1
Draw a break-even chart for the company. Fully label the chart. From the chart calculate the break-even quantity, revenue and margin of safety.
Question 2
The financial manager of KL produces a financial forecast for the coming trading year and identifies increases in energy costs and rent as threats to the business. The effect of these will be:
- Fixed costs increase to $2.8 million
- Variable costs increase to $100 000 per engine
Show these changes on the break-even chart and calculate the effect of these costs increases on the KL's break-even quantity, revenue, margin of safety and profit. Fully label your diagram.
Question 3
The finance manager proposes an increase in price to $170 000 to cover the predicted increase in costs.
Calculate the output required for KL Steam Engines to make its target profit of $2.8 million at the new price and cost levels. Comment on your results.
5.3 Break-even analysis - simulations and activities
In this section are a series of simulations and activities on the topic - Break-even analysis.
DragIT - Break-even analysis - changes
In this section are a series of draggable break-even diagrams and an interactive break-even diagram. To use the draggable graphs, click and hold on the curve that has a dot on the end and drag it. As you drag you will be able to see the impact of the change on the break-even diagram. You may then like to have a go at the questions underneath each diagram.
Click on the right arrow at the top or bottom of the page to start looking at the spreadsheet and diagrams.
Interactive break-even diagram
Try changing:
- Fixed costs
- Variable cost per unit
- Price
and see the impact of these changes directly on a break-even graph.
Follow the link below if you would prefer to view this diagram full-size in a new web window.
DragIT - Break-even price changes
Click and hold on the total revenue curve and drag it to see the impact of changes in price. Then have a go at the questions below.

1 |
Break-even price changesAs price increases the level of break-even output will rise. |
2 |
Break-even price changesAs price falls the total revenue curve will shift downwards. |
3 |
Break-even price increaseIf the firm increases their price, which of the following changes will occur? (Try dragging the total revenue curve in the above diagram upwards to the right to see the impact) |
DragIT - Break-even cost changes
Changes in total cost
Click and hold on the total cost curve and drag it to see the impact of changes in cost. Then have a go at the questions below.
Changes in fixed cost
Click and hold on the fixed cost curve and drag it to see the impact of changes in fixed cost. Then have a go at the questions below.

1 |
Fixed cost increasesWhen fixed cost increases which of the following will occur? |
2 |
Changes in variable costWhen variable cost increases, the break-even level of output will fall. |
3 |
Changes in variable costWhen fixed cost falls, the break-even level of output will fall. |
4 |
DragIT - Margin of safety
Click and hold on the total cost curve and drag it to see the impact of changes in cost on the margin of safety. Then have a go at the questions below.

1 |
Margin of safetyAs total cost increases, the margin of safety will fall. |
2 |
Diagram toolkit
In the diagram toolkit you get given a panel showing possible curves and labels and you then drag these curves onto targets on the diagram to try to build an appropriate diagram.
The diagrams are based around break-even analysis. Follow the links below to access the different pages or use the table of contents on the left.
Click on the right arrow to start trying out the diagram toolkit.
Break-even analysis (1)
On the diagrams below, drag curves and labels from the panel on the right to build the appropriate diagram. Once you think the diagram is right, click 'Check answer'. To see the correct answer, click the 'Feedback' button.
Number 1
Number 2
Number 3
Click on the right arrow try some further examples.
Break-even analysis (2)
On the diagrams below, drag curves and labels from the panel on the right to build the appropriate diagram. Once you think the diagram is right, click 'Check answer'. To see the correct answer, click the 'Feedback' button.
Number 1
Number 2
Click on the right arrow try some further examples.
Break-even analysis (3)
On the diagrams below, drag curves and labels from the panel on the right to build the appropriate diagram. Once you think the diagram is right, click 'Check answer'. To see the correct answer, click the 'Feedback' button.
Number 1
Number 2
AnimateIT - Break-even diagram
It is important to understand exactly how the main break-even diagrams are constructed. In the diagram below you can see it built up step by step. Click on the right arrow top right on the interaction to see each stage.
Follow the link below if you would prefer to view this diagram full-size in a new web window.
AnimateIT - Constructing a break-even diagram
Follow the link below if you would prefer to view this diagram full-size in a new web window.
AnimateIT - Margin of safety
Follow the link below if you would prefer to view this diagram full-size in a new web window.
AnimateIT - Break-even - increase in fixed costs
Follow the link below if you would prefer to view this diagram full-size in a new web window.
AnimateIT - Break-even - decrease in fixed costs
Follow the link below if you would prefer to view this diagram full-size in a new web window.
AnimateIT - Break-even - increase in variable costs
Follow the link below if you would prefer to view this diagram full-size in a new web window.
AnimateIT - Break-even - decrease in variable costs
Follow the link below if you would prefer to view this diagram full-size in a new web window.
AnimateIT - Break-even - increase in price
Follow the link below if you would prefer to view this diagram full-size in a new web window.
AnimateIT - Break-even - decrease in price
Follow the link below if you would prefer to view this diagram full-size in a new web window.
5.4 Quality assurance - notes
In previous sections, we looked at production methods, costs and revenues and break-even analysis. In this section we will examine quality assurance methods.

By the end of this section you should be able to:
- Analyse the move from traditional quality control methods to total quality management (TQM)

- Explain the role of Kaizen in quality improvement
- Evaluate different approaches to quality improvement
- Explain the role of local and national standards in assuring quality for consumers
Quality control and assurance
Quality
Before we begin to examine the issues of quality control and quality assurance, we need to examine the whole concept of quality itself, because quality is 'notoriously elusive of prescription, and no easier even to describe and discuss than deliver in practice' (Gibson, 1986).
Indeed, the American Society for Quality defines quality as:

Quality
...a subjective term for which each person has his, or her, own definition. In technical usage, quality can have two meanings:
- The characteristics of a product or service that bear on its ability to satisfy stated or implied needs;
- A product or service free of deficiencies.
Why Quality?
Firms need to ensure that the products or services that they offer for sale are produced on time, in the quantity needed, AND of the required quality. If they do not, they will get involved in repairing or exchanging products, which is costly and will have a negative effect on both brand and corporate image. Quality management is concerned with ensuring products are fit for their intended purpose.
Firms which produce high quality goods and/or services are likely to gain all, or some, of the following benefits:
- Competitive advantage, higher sales and repeat customers
- Better brand image, industry reputation and goodwill, increasing intangible assets
- Recommendations to others and reduced customer complaints
- The opportunity for premium pricing
- Longer product life cycles
- Cost savings and less waste
- Better motivated staff
- Higher profits
In addition to these internal advantages, the move to better quality across industries and markets has been driven by a number of external forces:
- Increasing competition: consumers faced with a range of similar products and services may select the product based on actual, or perceived, quality differences.
- Government regulations and laws: as the numbers and types of products and services available both nationally and internationally has increased, so governments have developed more legislation and regulatory frameworks to protect the consumer from unscrupulous sellers, covering aspects of commerce such as trades description and false selling. Breaking these laws and regulations can prove very expensive for firms as they can face fines and prohibitions.
- Improved standards of living: Higher disposable incomes have meant that consumers are more willing to pay higher prices for quality items.
- Higher consumer awareness: Information about products and services has increased dramatically with the advent of the internet, extending access to information previously available in the traditional press. In addition, this information may be accessed extremely quickly, and from anywhere in the world, and customers are much quicker, and more willing to complain. Customers are a key element in the process as they are increasingly prepared to record their views on the quality, or otherwise, on the products and services they have purchased and used.


The customer, the customer and the customer
Quality can be defined by specifications set out by the customer, or defined by legal standards; minimum quality standards laid out in the laws of the country.

Quality in a product or service is not what the supplier puts in. It is what the customer gets out and is willing to pay for.
 There are a variety of perspectives that can be taken in defining quality. One view of quality is that it is defined entirely by the customer or end user, and is based upon that person's evaluation of his or her entire customer experience. So quality is a about the 'whole package' not just the product itself, starting with the first encounter with the firm, and extending to the delivery of the product and then to after purchase communications and service.
A more recent definition of quality deriving from Joseph Juran's 'fitness for intended use' says that quality is 'meeting or exceeding customer expectations'.
One measure of quality is the achievement of an ISO standard. The International Standards Organisation (ISO), a non-governmental organisation, is a federation of standards setting bodies with members representing some 163 countries. The ISO 9000 family of standards refers to quality management systems designed to help organisations ensure they meet the needs of customers and other stakeholders. The first principle of its quality management standards identifies a key focus on customers:
Principle 1: Customer focus
Organizations depend on their customers and therefore should understand current and future customer needs, should meet customer requirements and strive to exceed customer expectations.
Key benefits:
- Increased revenue and market share obtained through flexible and fast responses to market opportunities.
- Increased effectiveness in the use of the organization's resources to enhance customer satisfaction.
- Improved customer loyalty leading to repeat business.
W Edward Deming, who we look at in greater detail later in this section, wrote that 'quality is defined by the customer'. Deming states that the customer's definition of quality is the only one that matters. The customer experience is defined as the aggregate of all the interactions that customers has with the organisation. However, this requires the firm to identify its customers. As we will see when we discuss the concept of Total Quality Management (TQM), there are, in fact two groupings of customers:
- External customers usually come to mind first. These are the people outside the organisation who receive goods and services. However, even this requires some clarification. If a firm sells products to a wholesaler, are they the only customer; what about the retailer and the ultimate consumer?
- Internal customers are often forgotten or taken for granted. In an assembly line operation, the next station downstream is an internal customer. Similarly, the production manager who receives a control report from the financial manager is the financial department's internal customer.

Rolls Royce, probably the most iconic luxury car manufacturer in the world, was founded on the basis of the utmost quality in all of its operations.

"Strive for perfection in everything you do. Take the best that exists and make it better. When it does not exist, design it." Sir Henry Royce
 The modern Rolls Royce is no longer a car manufacturer, having sold its licence to the car brand to BMW, but the Rolls Royce web site shows the value of their brand. Central to their business is their continuing emphasis on quality in all aspects of its business.
This mission is reflected in this statement on their website:

'To be Trusted to Deliver Excellence' is our central organising thought. It is what we aspire to become. It is the embodiment of the promise we make to our customers. In today's competitive environment, it is not enough to build great products: our customers are looking to us to deliver the best in service solutions. When we do, we build enduring relationships with our customers, partners and other stakeholders.
There is little doubt that quality is a major ingredient in the purchasing decision, especially in highly competitive markets, where firms are looking to meet and possibly exceed the quality of their rival's products and services.
It is quite common for firms to attempt to differentiate their business by emphasising the importance of quality in its offering, but this is becoming increasingly difficult as more firms recognise its importance to the success of their business. A greater guarantee of success, however, is putting the commitment to quality as expressed in all marketing and corporate literature into practice at the point of delivery to customers; at this point, however, the reality can be somewhat removed from the idealised version expressed by senior management as we will see on the next page.
Case study - quality through your customer's eyes

Read the article, Seeing your mission statement through the eyes of customers, (you can do this in the window below or follow the previous link to read the article in a separate window)

Question 1
Define the terms:
- Mission statement
- Corporate communications
Question 2
Explain the role of local and national standards, such as those produced by the ISO, in assuring quality for consumers.
Question 3
Analyse the role of quality in the promotion process.
Question 4
Using the article and examples from businesses you know, discuss how organisations can differentiate themselves and their products from competitors.

The Times 100 Case Studies have a number of useful company studies which offer excellent stimulus materials, several of which cover the concept of quality in different functional and corporate guises.
Case study - Portakabin

Follow the link below to read the case study on Portakabin and the importance of quality in creating competitive:

You may also like to read the case study on the importance of excellent customer service at Portakabin to support your answers to the following questions:

Question 1
Define the terms:
- Competitive advantage
- Premium prices
Question 2
Explain how Portakabin is able to combine standardisation and customisation.
Question 3
Analyse the role of market research in Portakabin's operational success.
Question 4
Evaluate Portakabin's strategic approach to changing customer's perceptions of its business and the quality of its products.
Operations management and quality
In operations management or manufacturing, quality is more concerned with excellence and the production of goods free from defects, deficiencies, and significant variations, achieved by conformity with design specifications and measured against objective and industry standards to satisfy customer or user requirements.

The International Standards Organisation (ISO) defines quality in the manufacturing context as:
"the totality of features and characteristics of a product or service that bears its ability to satisfy stated or implied needs."

Toyota
 In the mid-1940s many Japanese manufacturers, most notably Toyota, listened to their ideas of US theorists, such as W.E. Deming, and began to re-think and re-develop their basic approach to quality, transferring from the traditional approach focused on controlling the quality of the final product to a much broader quality assurance approach, which examined all the systems in an organisation.
Toyota's ferocious pursuit of quality led to the development of a management philosophy, the 'Toyota Way', which is still central to its current business approach and underpinned its global success. The Toyota Way incorporates the Toyota Production System and evolved from 'Lean Manufacturing' and 'Just-in-time Production' processes, which the company was instrumental in developing. The Toyota Way emphasises problem-solving, teamwork, adding value by training staff and focusing on root causes or underlying problems in order to increase quality and efficiency and reduce costs.
Toyota summarises its values in these five principles:
- Challenge
- Kaizen (continuous improvement)
- Genchi Genbutsu (go and see)
- Respect
- Teamwork
Quality control and quality assurance
Quality Assurance is process oriented and focuses on defect prevention; while quality control is product oriented and focuses on defect identification

Quality Control (QC)
Quality Control (QC) refers to quality related activities associated with the process of creating products and services. Quality control is used to verify that pre-determined quality standards are being met through quality inspections and reviews which detect poor quality, and identify, non-conformance with those standards.

Quality Assurance (QA)
Quality Assurance is the process used to assure the consumer that a firm's products or services will be fit for purpose, by preventing quality issues rather than detecting them. The objective is to meet quality standards at each stage of production to ensure customer satisfaction with the final product or service. Examples of quality assurance include process checklists, project audits and methodology and standards development. Quality assurance is recognised by the international standard ISO 9000.
What are the key differences between Quality Control and Quality Assurance?
- Quality control is about adherence to requirements for a particular product. Quality assurance is generic and does not concern the specific requirements of the product being developed.
- Quality assurance activities are determined before production work begins and these activities are performed while the product is being developed. In contrast, quality control activities are performed after various stages of the production process, to detect substandard quality from the delivery of raw materials to the output of finished goods.
Quality control is the traditional approach to quality management:
- It is reactive because it may involve inspection and sampling after a good is manufactured or semi-manufactured.
- The process is normally 'controlled' by a single department (quality control department), which is part of the manufacturing process and therefore a line function.
- The controller is tasked to find defects or poor quality before the good is delivered to the customer.

What must be remembered is that QC is unlikely to TEST every product or process. It works by selecting samples, which are subjected to a set of predetermined tolerances and quality standards. It is possible that the sample is not representative of the whole batch and substandard products are still sold as a result.
Examples of quality control on finished products may include the testing of a sample of finished cars on 'test beds' where functions of the car, such as the efficiency and longevity of the braking system, can be assessed over a period of time. This process can be expensive as it may involve qualified professionals, such as engineers or chemists carrying out the checks.
A product that has been through a QC process may have a label attached indicating it has been tested, such as the Bureau Veritas c-mark. Displaying such a label can lead to increased consumer confidence and demonstrate a firm's commitment to providing high quality and health and safety protection. In the competitive marketplace, a commitment to standards beyond legislation through a certification program can help brands, retailers, and manufacturers to differentiate themselves form their competition.

Quality standards
Quality standards are part of a framework for achieving a recognised level of quality within an organisation. Achievement of a pre-determined quality standard demonstrates that the organisation has met the requirements laid out by the certifying body, such as ISO.
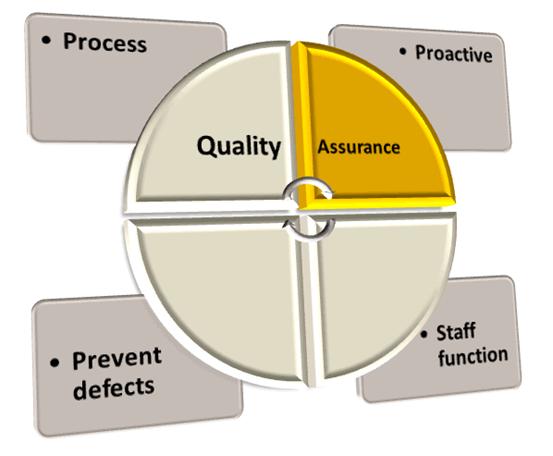
Quality assurance is the process of the firm guaranteeing to its customer, the quality of the good or service to the consumer. To achieve this:
- Firms are proactive in setting up processes and developing standards before product is made or service provided.
- All employees in the firm are responsible for quality, not just those involved directly in production, so it is a staff function, rather than a line function.
- The purpose of quality assurance is to prevent defects by setting up the controls and mechanisms to check the quality at every stage of the process. Targets for quality are set, such as 'zero defects'.
Classic quality control (QC)
We will examine this approach using a mini case study.

The Sausage Factory
Family Foods Ltd. makes sausages in its factory. It buys meat from the local farmers, sausage skins from the local supplier and packing and packaging materials from a national wholesaler. It produces sausages in batches, and then sells them to local shops and catering establishments.
There is considerable involvement of QC staff in the production process. They are responsible for quality and can over-rule production and marketing departments within the company. They can also reject substandard products that have already been manufactured.
Who do you think the QC department is RESPONSIBLE to? Who does the head of the quality control department report to?
Quality controllers are required to check several aspects of the production process.
- Raw materials. All of this has to be sampled and checked and analysed. This may be done in a laboratory by chemists. Materials cannot be used until they are approved. Thus there has to be a Quarantine Store, where items are held before clearance. Invoices cannot be paid by accounts until there is clearance from the QC department.
- Packing materials and packaging. Samples are checked against a specification, which may be time consuming and costly.
- Work-in-progress. Batches of sausage meat are made, which are be checked before use. Records are kept so that the batches of the final product can be traced back to a batch made on a certain day if there are found to be problems.
- Finished product. Samples are checked before being passed for sale. Checks are made on weight, physical quality of the product and the packaging, and the bacteriological quality of the sausages. Only when all these tests are complete can a batch of sausages be passed for sale. During this waiting period they are kept in expensive cold storage.
A significant area of the factory is taken up by storage areas and stock levels may be relatively high at certain periods.
 Thus quality checking is done through sampling and analysis, the checking being done by an 'in house', but independent QC department. The process often uses Statistical Process Control (SPC), associated with Deming, to ensure that finished products fall within acceptable tolerance levels, such as those based on weight and size. There is no attempt by production and QC to improve quality together, though production aims to get as many 'passes' as possible. Classic QC is expensive and inefficient. Checks are made after the event:
- after ordering raw materials and on their delivery
- after the making of a batch
- after the production of the final packs.
The same quality faults tended to occur again and again. There may be no incentive for departments to work together to improve quality and reduce costs, so the potential advantages of team working are ignored.

In effect, a company is paying workers to make defects and then to correct them. Quality comes not from inspection, but from improvement in the process.
Mary Walton, Deming Management Method
Given the drawbacks of traditional quality control, it is not surprising that there has been a movement to the introduction of quality assurance processes and philosophy.
Quality Assurance (QA)
Quality assurance is concerned with assuring quality to the consumer by a management process, which attempts to prevent poor quality happening, rather than detecting when goods or services fail to meet quality standards. No one person or department is in control of the quality process; the whole business and all of its employees focus on delivering quality at all levels to both internal and external customers. It is associated with a series of activities, which will consider in the following sections, such as Total Quality Management (TQM) and Continuous Improvement.
The process of Quality Assurance (QA) requires the engagement of the whole workforce with the issue of quality and therefore, promotes employee participation and democratic, consultative leadership. Employees are expected to 'self-check' by comparing their output against quality standards. The objective is to get activities right the first time and aims for zero defects. Employees are encouraged to request additional training where required and to make suggestions for improvements on an ongoing basis through suggestions schemes of the development of quality circles; the focus is on product design and development. Departments cooperate with other departments to ensure that quality improvements are identified, examining inputs to the process as well as outputs. A logical extension of the process of QA is to create quality partnerships with suppliers of components and raw materials.
Quality Assurance has the following advantages over traditional quality control:
- Everyone is responsible for quality, promoting consultation, teamwork and job enrichment - the higher levels of motivation identified by Maslow and Herzberg. This process promotes the sense of belonging to a group.
- Quality is seen as an organisational issue rather than focusing on individuals and groups, reducing the 'blame culture' associated with traditional quality control.
- The responsibility for quality associated with each individual is potentially self-motivating.
- It reduces waste and cuts the costs associated with expensive inspections and the rejection of finished goods, or the correction of identified faults.
- It makes it easier for the organisation to meet quality standards and so be awarded with various quality awards and 'kitemarks', which can be used in the marketing process.
Total quality culture (TQC)
Modern quality management
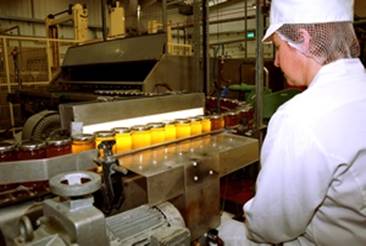 The traditional method of quality control made the holding of stocks essential. Pressures to reduce stock holding and their associated costs led to the development of Quality Assurance and Total Quality Management (TQM) as replacements for Classic QC. The emphasis now is to prevent the purchase or production of defective goods in the first place, not to catch them after the event.
It is now appreciated that quality depends on the people and the processes used, not just the materials. Quality and efficiency has been widened, therefore, to cover the entire firm, not just materials and products. The avoidance of faulty production requires that three aspects are efficient:
- Methods - systems and procedures
- People - both line and staff functions
- Materials
All these have to be efficient for a quality outcome. All aspects of a firm's operations have to be examined and improved across the firm.
Businesses do not operate in isolation, but as part of a group of organisations forming the supply chain, which includes suppliers, wholesalers, agents and final customers. So, quality assurance teams must work with all of these groups and organisations to ensure that quality is maintained at all levels. This has led to the movement from traditional quality methods to broader quality approaches and philosophies including:
- Quality Assurance - procedures as well as products are examined and changed if necessary to ensure/assure customers that products are fit for purpose.
- Total Quality Management (TQM) - this is the system where the responsibility for quality lies with ALL employees. It commits the organisation to continuous improvement (Kaizen) of all activities relating to the quality of the product and the satisfaction of the customer. TQM is really a culture, as to be effective it requires a change in attitudes.
- Self-checking - the individual or group responsible for the product or task checks quality all the time, ensuring that the next person in the chain receives a quality product.
- Team working. Firms work with their suppliers, sometimes even investing money and/or buying shares in them, to ensure that the product purchased is of the desired quality, so needing no checking on delivery; in effect it is pre-checked at the supplier's factory.
Quality has become a team responsibility ensuring a focus on high quality at all times. However, quality is not a static concept. The quality of the competitor products may improve, changing the competitive position so requiring a consistent and on-going process of analysis of the external environment and a commitment to continuous improvement.
Total Quality Management (TQM)
A key part of creating a total quality culture is to develop a commitment to quality at every stage of the production process from research and development to after sales service. TQM capitalises on the involvement of management, workforce, suppliers, and customers, in order to meet or exceed customer expectations.
In his 1982 book Out of the Crisis, W Edwards Deming offered fourteen key principles for management for transforming business effectiveness. Although Deming does not use the term TQM in his book, it is credited with launching the Total Quality Management movement. The book presented a blueprint for many management 'revolutions' of the subsequent 15 years: Excellence, Re-engineering, Process Management and Systems Thinking.

Long-term commitment to new learning and new philosophy is required of any management that seeks transformation. The timid and the fainthearted, and the people that expect quick results, are doomed to disappointment.
W Edwards Deming: Out of the Crisis
TQM is not a management tool; it is a philosophy enshrined in the way a firm does business.

Total Quality management (TQM)
TQM is a philosophy and style of management which gives everyone in an organisation the responsibility to deliver quality to the customer at the lowest possible cost. TQM views every task in the organisation as a process that is a customer/supplier relationship with the next process in the supply chain.
W. Edwards Deming along, with Joseph Juran, developed a tool for identifying production problems called Statistical Process Control (SPC). Deming proposed that quality could be achieved by identifying the causes of production problems throughout the manufacturing process and carefully monitoring production to stop errors before too many products were produced. Every step of the process is an opportunity for increased efficiency, hence the term Total Quality Management (TQM).

It is unlikely that two parts, even produced by the same machine would ever be identical. The issue, therefore, was distinguishing acceptable variations from variations that could indicate problems.
Deming
Joseph Juran was the first to develop strategies for recognising the human aspect of TQM and identifying changes in the nature of HRM to facilitate the change in corporate culture required for the process to be successful. For example:
- Teamwork - TQM stresses that a team approach to quality is the most effective as it gives a greater range of skills, helps solve problems across departments in the firm, leads to more 'ideas' to help improve quality and should result in improved employee morale and involvement in the production process.
- Monitoring - TQM requires close monitoring of the business process to ensure that quality improvements are being met. This monitoring will often have a quantitative element with data being collected about production and various quality indicators using Statistical Process Control methods.
- Company policy - TQM is a culture and requires changes in company policy if it is to be effective. TQM must be adopted at all levels of the firm starting at the top with its adoption by senior management. If there is not full commitment to it, then it is unlikely to succeed.
- Quality chains - TQM needs to be adopted at all stages of the production process if it is to be successful and this may require quality chains from supplier through to customer. These may be internal quality chains with departments being treated as suppliers to other departments. Quality needs to be right at all stages from say one team to another.
Advantages
- TQM significantly improves the quality of the final product or service.
- The volume and cost of waste is reduced.
- Employee productivity improves as they use their time more effectively on issues affecting the 'bottom line' of the organisation.
- As quality improves, market share should show sustainable long-term increases through the creation of competitive advantage.
- Employee morale and motivation improves, resulting in improved staff retention and easier recruitment.
- Customers are satisfied at a lower cost.
Problems
- Lack of commitment from staff will undermine the process. TQM standards are extremely demanding for management and staff.
- TQM requires significant investment; sometimes in new capital equipment, but also investment in training and development of staff. TQM is not a quick fix - it may take years to implement and then is an on-going process.
- TQM may require close monitoring and the collection of large amounts of data to ensure quality at all stages and levels and this will impose additional bureaucracy and therefore cost on the firm. The process may be perceived as 'mechanical', focusing on the means rather than the end.
- Training and development costs will be high as it requires total commitment at all levels of the firm. This may cause some production co-ordination problems and impose an additional cost burden.
TQM planning process
Follow the link below if you would prefer to view this interaction in a new web window:
Case study - Six sigma

Six sigma
 Six Sigma is a modern 'branded' interpretations of TQM and arguably the most popular management methodology in history. Six Sigma began in 1986 as a statistically-based method to reduce variation in electronic manufacturing processes in Motorola Inc. in the USA, but today Six Sigma is used as an all-encompassing business performance methodology, all over the world, in organizations as diverse as local government departments, prisons, hospitals, the armed forces, banks, and multi-nationals corporations.
Six Sigma is a methodology, which requires and encourages team leaders and teams to train in Six Sigma's methods, such as the use of the measurement and improvement tools, and in communications and relationship skills, necessary to involve and serve the needs of the internal and external customers. Similar to Japanese martial arts, employees with different levels of expertise and responsibilities for implementing Six Sigma methods receive 'belts', such as green and black belt (team leaders) to recognise their seniority and qualification.
Six Sigma teams use a vast array of tools at each stage of Six Sigma implementation to define, measure, analyse and control variation in process quality, and to manage people, teams and communications.
Most practitioners and users of Six Sigma refer to Motorola's early DMAIC acronym (extended since to DMAICT) as a way of reinforcing and reminding participants what needs to be done:
Six Sigma DMAIC and DMAICT process elements
- D - Define opportunity
- M - Measure performance
- A - Analyse opportunity
- I - Improve performance
- C - Control performance, and optionally:
- T - Transfer best practice (to spread the learning to other areas of the organization)
Lean Production
Lean Production originates from the production established by Toyota in Japan in the early 1950's that became known as 'The Toyota Production System'.
Lean production is a philosophy that aims to produce more, using fewer resources, eliminating all forms of waste.
The components of lean production are:
- Just-in-time manufacture (JIT)
- Total quality management (TQM)
- Time-based management
Lean production came out of a three-month visit by Toyota managers to the Ford River Rouge plant in the 1950s. Here they studied mass production and concluded:
- Mass production was riddled with waste ('muda')
- The standardisation required was unacceptable to customers
- Quality was poor with a high reject rate at the end of the production line
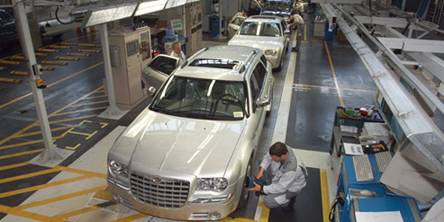 Toyota's solution was to design machines that were flexible, adapted to several processes. Lines could be quickly altered to manufacture different products, e.g. left to right hand drive vehicles. The emphasis was on reducing the use of all resources: raw materials, manpower, capital, floor space and time.
In the 1980s, there was a significant increase in the application of lean production techniques in US and European firms and the term was popularised by MIT researchers, J. P. Womack and D. T. Jones, in their book 'The Machine that Changed the World', based on their five-year, fourteen-country International Motor Vehicle Program's study of the worldwide auto industry.
Lean Production combines the advantages of both craft and mass production, but with the goal is to use less of everything compared with mass production. Lean production aims to:
'get the right things to the right place at the right time, the first time, while minimising waste and being open to change'.
Lean Production focused on reducing system response time so that the production system can adapting quickly to market demands, effectively meaning products become virtually made-to-order.
Follow the link below if you would prefer to view this interaction in a new web window:
Quality improvement
Quality is not static and firms need to ensure that their quality improves with the demands of the customer and the market. Quality is both a company absolute value and an industry/market relative value (one firm compared to another).
Continuous improvement

 Continuous improvement or Kaizen was developed in Japan, although advancing ideas first proposed by Dr W. Edwards Deming in the USA in the years following the Second World War.
It involves forming small groups of staff with the target of identifying changes and improvements to products, procedures and methods. The aim is a steady flow of small changes rather than a few (perhaps traumatic) large changes. Remember, people tend to resist change, especially if the process is perceived as an excuse for cutting jobs.

We have learned to live in a world of mistakes and defective products as if they were necessary to life. ...
Deming
Employees at firms such as Toyota generate thousands of ideas a year - each aimed at improving quality or quality. Over time, these small (incremental) steps forward generate significant improvements in competitiveness, at a relatively low cost.
The Kaizen Institute says that employees should have two jobs: 'doing their job and then looking for ways of improving it'. The production line worker is at the centre of quality improvements as employees are a key resource. Individuals and teams are empowered and given the right to make decisions affecting the quality of their working lives. However, teams and individuals are set performance targets.
Kaizen groups are not the same as quality circles. Kaizen groups are wider than the old quality circles. They are also better empowered; they can put their improvements into action (this carries with it responsibility, however).
Implementation of Kaizen requires training of employees and often a change in culture of both managers and employees
Quality circles
Quality is maintained and improved by the working of quality circles and Kaizen groups.

Quality circles
A quality circle is a multidisciplinary team which meets voluntarily, and on a regular basis, to examine products, processes or procedures with the objective of making recommendations for improvement to management. The group is usually made up from employees from the shop floor, led by a supervisor. Participants are trained in necessary leadership, problem-solving and decision-making skills. Operating quality circles requires trust between employer and employees, effective two-way communication and willingness for management to delegate responsibility.

Kaizen groups
A Kaizen group consists of employees who meet to discuss possible changes to their working practices and suggest improvements to the production process. Kaizen teams aim to make small improvements in quality, but on a continuous basis to make the process more efficient and simple with the objective of increasing customer satisfaction. The focus of the group is not necessarily on the reduction of costs although suggestions to make jobs easier, and designs simpler, may result in such savings. As with quality circles, Kaizen groups will normally be multidisciplinary.
The format for Kaizen can be individual, suggestion system, small group, or large group. At Toyota, it is usually a local improvement within a workstation or local area and involves a small group in improving their own work environment and productivity. This group is often guided through the kaizen process by a line supervisor; sometimes this is the line supervisor's key role. Kaizen on a broad, cross-departmental scale in firms, generates total quality management, and frees human efforts through improving productivity using machines and computing power.
Benchmarking

Benchmarking
Benchmarking is a systematic process of comparing the activities and work processes of an a organisation, functions and its departments with those of outstanding organisations, functions or departments, normally in the same industry, with the objectives of improving performance.
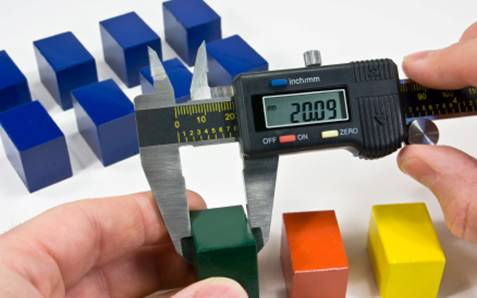 Benchmarking was first developed by the Xerox Corporation in the 1970s when Xerox realised it was losing profit and market share to its Japanese competitors, who were able to sell photocopiers for the same price that it cost Xerox to make them. The development of benchmarking is described by the Xerox executive Robert C Camp, universally regarded as the founding father of the benchmark process, in his 1989 book: The search for industry best practices that lead to superior performance.
There are various types of benchmarking:
- Internal benchmarking - a comparison of one function with another within the same industry.
- Functional benchmarking - a comparison of one function with another, regardless of the industry.
- Competitive benchmarking - gathering information about direct competitors
- Strategic benchmarking - the objective is organisational changes through strategic action.
Benchmarking (sometimes called best practice benchmarking - BPB) is used to measure the gap between the firm's performance and the performance of other organisations in the same, or similar, industry. The firm selects a product of high quality or efficient process, possibly that of a competitor, and uses it as a standard for improvement in their own products and processes.
Benchmarking effectively means finding out what, in the eyes of the customer, makes the difference between an ordinary product and an excellent product and then establishing procedures to implement these standards. The process requires several stages:
- Establishing what should be benchmarked, by talking to customers about significant factors in their purchase decisions, and identifying specific areas where the firm would gain from improvement.
- Deciding who the firm should benchmark against, by identifying those firms that have the best reputations and quality in the industry.
- Obtaining the information using a variety of primary and secondary research methods and sources.
- Analysing the information, particularly using quantitative methods that can be used for comparison with industry standards.
- Establishing how the information should be used to improve the product or business practices. This will involve the firm in the setting of standards for improvement and communicating these to relevant employee groups. Senior managers must be responsible to drive these improvements forward, by providing the necessary resources and training opportunities.
It is possible to benchmark different aspects of the production process against competitors who excel in each of these areas. A car manufacturer, for instance, may benchmark the performance of its engines against one competitor, which is regarded as the market leader, and the quality of its paint finish against another, and so on.
Advantages of benchmarking
- Identifying the major concerns of customers, allows the firm to use its resources most effectively by focusing on specific elements of the business.
- Reduces complaints and improve customer satisfaction and the firm's reputation.
- As part of a continuous improvement process, benchmarking is likely to result in reduced waste and less reworking of substandard products.
- Investigation of best practice will increase awareness of important industry innovation and alternative solutions.
- The involvement of employees in the benchmarking process can improve motivation and productivity.
- Increased sales revenue and profits.
The process of benchmarking will only be effective if the firm is able to obtain the information it requires about its competitors. It is very unlikely that this information will be given voluntarily and the cost of obtaining it in other ways may be significant. Even if the information is forthcoming, the information alone may not be enough for the processes to be replicated; copying what other firms are doing may not provide competitive advantage.
In the automotive industry benchmarking is a key process. Car manufacturers need to compete for sales since the supply capacity exceeds demand. Design, features, technology, producing methods, efficiency in design and manufacture are some of the benchmarked points between brands.
Case study - Strategy: Benchmarking

Read the article Strategy: Benchmarking (you can do this in the window below or follow the previous link to read the article in a separate window) and then consider answers to the questions below.

Question 1
Define the terms:
- Bureaucratic structures
- Defect rate
Question 2
Explain what Gary Hamel meant when he said: "My fundamental belief is that if a company wants to see the future, 80 per cent of what it is going to have to learn will be from outside its own industry."
Question 3
Select five of the critical success factors for effective benchmarking identified by Keki Bhote, and analyse their importance.
Question 4
Evaluate the process of Best Practice Benchmarking (BPB) as an approach to quality improvement.
Case study - Cadillac benchmarks BMW

Cadillac benchmarks BMW
Read the article Cadillac ATS to show how much GM learned from the BMW 3 Series (you can do this in the window below or follow the previous link to read the article in a separate window)
Task - Benchmarking report

Benchmarking success for Hyundai
 Hyundai, South Korea's largest automaker, reported that it boosted sales 28% in the US in 2011. The Sonata sedan and new Elantra small car led gains for the Seoul-based company, surging more than 100% and 54% respectively over 2010 sales.
Focusing on exports requires producing internationally competitive products, which in turn requires the highest quality. Hyundai Motor's rise has tracked its determination to succeed in the US market. Hyundai seriously blundered when it first entered the US market, because its cars were perceived as low-quality. The company rebounded by targeting Toyota as the quality benchmark to beat while also appealing to consumers by offering the best warranties in the US market.

Working in a group with 2/3 others, research the background of Hyundai and its recent export drive into the US and Europe. Produce a report for the board of Hyundai, identifying aspects of its business that need to be benchmarked and suggest which of its competitors should be the focus of a benchmarking exercise and explain why.

5.4 Quality assurance - questions and activities
In this section are a series of questions on the topic - Quality assurance. The questions may include various types of questions. For example:
- Self-test questions - on-screen questions that give immediate marking and feedback
- Short-answer questions - a series of short-answer questions to help you check your understanding of the topic
- Case study - a case study with associated questions
- In the news - questions based around a topical business news article
Click on the right arrow at the top or bottom of the page to work through the questions.
Quality at Nikon Kohden and Toyota

Read the following webpages (you can do this in the windows below or follow the links to read the article in a separate window) and then complete the written activities below:
- Nihon Kohden production process
- Toyota Production System -- Kaizen, kanban and jumbiki keys to continuity

Activities
Summarise:
- the key processes that ensure safety and quality at Nihon Kohden
- the key features of the Toyota Production System (TPS)
Examine how the processes and features you have summarised at Nihon Kohden and Toyota differ from traditional quality control methods.
Quality control - case study
Purest Chemicals plc
Purest Chemicals has built up a successful business supplying specialty chemicals to the printing industry. The firm was founded 30 years ago by Peter Smith, who had completed a degree in Chemical Engineering 5 years before. The firm has built up its product range using batch production methods.
Peter's daughter, Sally, joined the company 10 years ago, and is now Development Director. Her brother is the Production Director and Ranjit Shar is the Finance Director. Peter Smith is the CEO, but has retained a special interest in the Quality Control function.
Stocks have built up steadily during the life of the firm. Working capital levels are now high, and the firm sometimes has cash flow problems. The firm works using the classic saw-tooth control chart and Peter also likes to have 3 months stock of all raw materials, regardless of supply conditions
The firm has built up a good relationship with a major magazine publisher, which regularly places large orders for two specific chemicals. However, Sally knows that the market is increasingly competitive and quality is becoming a significant differentiating factor when publishers place orders. Sally has proposed a n umber of changes to the firm's operations to maximise the profits they receive from existing orders and ensure they remain competitive into the future. Her proposals are to:
- Change from traditional quality control methods to total quality management (TQM)
- Seek ISO 9000 approval
- Investigate the use of mass production for chemical production
- Set up a benchmarking process using their key competitors
A Board Meeting is scheduled for the next week, when key decisions will have to be taken.

Question 1
Define the terms:
- Product range
- Stock control chart
Question 2
Explain what the holding of a ISO 9000 Certificate will tell potential customers.
Question 3
Analyse the advantages and disadvantages to Purest Chemicals of adopting mass production
Question 4
Evaluate the proposed move from traditional quality control methods to a total quality culture.
Quality control - short answer questions

Question 1
Explain the major differences between quality control and quality assurance.
Question 2
Prepare a summary listing the key features of a benchmarking process for a manufacturer of washing machines.
Question 3
Analyse the advantages and disadvantages of introducing best practice benchmarking (BPB)
Question 4
Explain the role of local and national standards in assuring quality for consumers.
Question 5
Explain why quality is important to both producers and consumers
Question 6
Describe the six sigma approach to quality.
Question 7
Evaluate the benefits for a firm of adopting a Kaizen approach to quality assurance.
Retail quality and brand image - questions
Read the articles Can Johnson & Johnson get its act together? and Asda makes £27m investment in food quality (you can do this in the window below or follow the previous link to read the article in a separate window) and then answer the questions below.

If you wish, you may like to read the full article about Johnson and Johnson in the New York Times (you may need to set up a free account to do this):

Question 1
Define the terms:
- Supply chain
- Representative sample
Question 2
Explain how 'removing unnecessary middlemen along the way', has helped Asda enhance the quality of their fresh food and keep prices low for customers.
Question 3
Examine the impact of quality issues in the Johnson and Johnson group on its brand image.
Question 4
To what extent would a TQM approach help Johnsons and Johnson improve quality control at McNeil?
5.5 Location - notes
In previous sections, we looked at production methods, costs and revenues, break-even analysis and quality assurance methods. In this section we will examine the causes and consequences of location.

By the end of this section you should be able to:
- Explain the causes and consequences of location and relocation, both domestically and internationally

- Consider the effects of globalisation on location
- Analyse the impact of location on different areas of business activity (such as marketing, production, finance and human resources)
Location
In this section we look at the issue of location, which may be a national and/or international decision. Increasingly even small firms are outsourcing work to other countries to gain cost advantages and production has become increasingly globalised. Many industries have become essentially 'footloose' - able to locate anywhere that may help them to gain a competitive advantage.
The decision on location of a new firm may be critical to its survival, development and growth. Where to locate a business is a crucial decision because this will have an important impact on profits. Typically businesses will seek locations that maximise revenues and minimise costs.
National location
The choice of location is probably the single largest expense when setting up a new business. It is likely to have a significant impact on the number of customers a firm attracts, its sales revenues and, consequently, its profit levels. Choosing a location is investment in the same way as purchasing equipment and machinery and other fixed assets. Investment appraisal tools such as payback, ARR and discounted cash flow should be applied where appropriate and expenses on purchasing or renting property should be incorporated into break-even analysis.
Other quantitative business tools, such as decision trees and contribution costing may also be part of the location decision-making process. However, these will only be aids to decision making, and the firm will also have to consider a range of non-quantifiable (qualitative) factors, including employee motivation, company objectives, ethics and corporate image.
Location, Location, Location
Why do firms choose to locate where they do? Although, there is rarely a single answer because different firms choose their locations for different reasons, one of the major determinants of a location decision relates to the firm's factors of production. In general, economic theory states that firms locate where they can reduce the costs of their factors of production and where they have access to inputs that meet their quality standards at a relatively low cost. However, because firms are different, the relative importance of different factors of production varies both across industry and even more importantly, across the type of firm. For example, a firm that spends a large proportion of its total costs on labour will be attracted to a location where labour is relatively inexpensive, whereas a firm requiring a significant location space may give more weight to areas where rental values are relatively cheap.
 However, the mantra of real estate agents is that the crucial aspect of any property decision is 'location, location and location'. Buildings can be updated, redeveloped or improved, but the location itself cannot be changed. Naturally, the price of land varies according to its desirability; with supply and demand operating to establish price. A location will be relatively cheap when it is less sought after; retail locations with the highest footfall and business offices in 'high class' areas, attract the highest prices. A small retailer may wish to locate in the central shopping mall, but lacks the funds to pay the high rents, so must compromise and accept a less than perfect location that is, however, affordable.
When reflecting on business location, it is important to remember that there is no one place that is perfect for all firms. Each location has its strengths and weaknesses. Some places have exceptional attractions, while others have may have both positive and negative aspects. Nevertheless, selecting the best spot for a particular firm is invariably something of a balancing act between the benefits of a particular location and its costs.
Types of Location
There are four major types of location:
- Retail
- Retail warehousing
- Industrial
- Office space
Each of these will have different requirements and priorities. Retail and retail warehousing will approach the location decision with contrasting objectives. Retail warehousing will require a large area with access to major distribution networks and safe access for large heavy traffic volumes, whereas retailers will be seeking locations convenient for their target market. Unlike retail warehousing, retailer may well locate in city centres, but both may end up in cheaper out-of-town locations, but it is unlikely that the two will be located together.
Industrial locations are likely to be the cheapest option as they can be located well away from centres of populations in existing 'brownfield' sites (sites already developed). Conversely, office locations may be very expensive as headquarters of large corporations tend to be located in large capital cities such as Paris, London, New York, Beijing and Tokyo.
In determining a business location, the following questions can quickly narrow down potential choices.
- Do your customers come to you?
- Do you have to go to your customers?
- Do you have employees?
- Do you manufacture products for distribution?
A good starting point for a firm deciding on location options is to research where their customers are based and where their competitors locate. Subway, for example, saves many millions of dollars in market research by basing its location decisions on where McDonald's restaurants are placed and are most successful, on the basis that customer profiles and demographics are similar for the two firms.
Factors affecting location
Follow the link below if you would prefer to view this interaction in a new web window:
Some industries have strong reasons to locate in a particular region. (There will be significant external economies of scale) Others, on the other hand, do not. These are known as footloose industries. Modern high technology industries such as computer chip manufacturers are good examples.
In many cases there will be a trade-off between costs and gains. This means that each option has to be evaluated and quantitative decisions made. You may be able to set your business up, or expand it in a distant part of the world very cheaply, but then face a mountain of extra operational and distribution costs.
Relocation: Push and Pull factors.
 The factors underpinning the decision process for a business set-up will be quite different to those factors which encourage an established firm to relocate to another area.
Relocation involves 'push factors' and 'pull factors'. Push factors are things that make a firm want to move from an existing location; these are normally negatives about that site. Pull factors attract a company to a new location and are positive reasons why the new location is preferable to the existing location.
Although the underlying factors on location remain the same, the forces on an industry or firm to move its production from where it is currently located to a new area may need to be stronger than those encouraging a new set-up to locate in an area. This is because of the concept of industrial inertia, which describes a situation where an industry remains in its original location even though the initial advantages of that location are no longer relevant and/or have disappeared. Inertia is the resistance of an object to a change in its motion. That is why you need seat belts (if the car suddenly stops, your body still wants to continue forward and that is inertia). Inertia applies to individual businesses as well as whole industries, when it comes to relocation.
When a firm or industry has been in a particular area for a long period, there are many pressures on that that firm or industry to remain there. Industries will build up local advantages over time as external economies, such as the availability of skilled labour, specialist local infrastructure and support activities may be lost if the firm relocates to another region. Industrial inertia also arises from the relative immobility of fixed capital in the form of plant and machinery. Simple, but potent personal factors, may block a move, including the unwillingness of existing staff to relocate because of friends, schooling etc. and because management wishes to avoid the stresses of the moving process.
Some of the questions facing a firm considering relocating include:
- How many of the key staff will relocate?
- Are suitably qualified staff available in the new location to replace those employees who decide not to move to the new area?
- How many redundancies will there be?
- Is there likely to be a problem with the unions?
- Will the move affect the firm's image and sales?
Managers may employ business tools such as Force Field Analysis and decision trees to consider whether a strategic relocation should would be beneficial to the firm.
'Cluster' strategy helps Holland industries find prosperity

Read the article 'Cluster' strategy helps Holland industries find prosperity(you can do this in the window below or follow the previous link to read the article in a separate window) and then answer the questions below.

Question 1
Define the terms:
- Innovation
- Logistics
Question 2
Explain why the 'cluster' system in the Holland-Zealand area is an example of an external economy of scale.
Question 3
Analyse the impact of location on the marketing and production functions of a business.
Question 4
Evaluate the success of Holland's 'cluster' strategy in revitalising local economies.
Demonstrations against new Tesco store

Read the article Tesco to meet protesters against new Stokes Croft store.You can do this in the window below or follow the previous link to read the article in a separate window) and consider the question below.

You may also like to read the article: Bristol Tesco store protest turns violent


 To what extent should large retailers, such as Tesco, consider the views of the local population when it wants to locate in an area?
IB - new global centre
International Baccalaureate sets up new global centre in The Hague, The Netherlands - the two sides of a relocation
Read the article International Baccalaureate sets up new global centre in The Hague, The Netherlands (you can do this in the window below or follow the previous link to read the article in a separate window) which outlines the IB's move from Cardiff in the UK to the Hague in the Netherlands.

Any relocation of a firm is likely to generate both positive and negative reactions.

Read the following articles and reflect on the questions below.

- What are the likely forces that are encouraging the IB organisation to relocate its UK headquarters from Cardiff to The Hague?
- What are the implications for Cardiff of the planned move?
- What potential threats are facing the IB organisation as a consequence of the relocation?
- What are the advantages to the IB organisation of centralising all of its regional offices in one location?
Extension Activity:
Prepare a Force Field Analysis showing the driving and restraining forces related to the relocation of the IB organisation to The Hague.
Storck to close Bendicks factory in Winchester

Read the article Storck to close Bendicks factory in Winchester(you can do this in the window below or follow the previous link to read the article in a separate window) and then answer the questions below.

You may also like to read the following articles to support your answers:

Question 1
Define the terms:
- Brand name
- Multinational conglomerate
Question 2
Explain the Unite Union's statement that "Yet again, weak labour laws are working against the interests of the UK".
Question 3
Examine the impact of globalisation on Storck's decision to relocate Bendicks factory to East Germany.
Question 4
Using Storck as one example, evaluate the impact on a firm's objectives and strategy of changes in the external environment
Impact of globalisation on location

The growth of multinational corporations (MNCs) means that location decisions increasingly balance cost factors with access to a wide range of markets. The location factors described in the previous sections largely still apply, but there is now an international element. One of the main features of globalisation is the increasing trend for moving the whole of an organisation, or some of its functions overseas; a process called 'offshoring'
Advantages to businesses relocating overseas derive primarily from that country's ability to provide better economic and commercial value than existing national locations. It is not just the cost of the factors of production that matters, but their quality of these resources. For example, lower labour costs may be offset by employees who are less skilled, productive and cost-effective. Factors such as labour, land and infrastructure (e.g. transport and utilities) directly influence production costs. Other factors, such as environmental and cultural amenities have indirect effects that can help maintain a skilled labour pool and other direct inputs.
The main driving forces or push factors for locating overseas include:
- Cost reduction - labour and materials may be considerably cheaper overseas. These savings have to be considered together with any the additional distribution and transportation costs. Employers in Western Europe looking to save on wage costs are increasingly relocating operations to Eastern Europe, Asia and Latin America. The Federation of European Employers publishes statistics on competitive wage costs within Europe and between Europe and other nations.
- Avoiding excessive government regulation and interference - large MNCs often threaten to relocate to minimise what they see as unnecessary regulation and interference in their business activities by local and national governments. Sometimes the threat to move is sufficient to persuade politicians to change unpopular restrictions and regulations and laws. If these are not amended, the firm may carry out its threat to move operations to other countries.
- Avoiding protectionism - import restrictions can be by-passed by manufacturing in the country or community concerned. This is a significant reason for the inward investment into the EU trading bloc. Asian car manufacturers have developed significant production facilities in Europe to avoid trade barriers. Cars assembled or manufactured within the EU may be moved and sold without import taxes or other trade barriers, even if the firm's headquarters and ownership is not within the EU.
- Economies of scale - large international, multinational industries, such as oil and petrochemical industries, have gained high levels of economies of scale from operating globally.
- Access to global markets - a huge growth in newly-industrialised and developing countries are changing the epicentre of economic and commercial power activities. By 2050, the BRIC grouping of countries: Brazil, Russia, India and China are expected to account for over 40% of the world's population, and 60% of global GDP. Firms presently located in the mature economies such as the US, Japan and Europe recognise that location within these rapidly developing markets is preferable to simply exporting to them.
- Competitive strategy - business decisions to move operations overseas may be to obtain 'First Mover Advantage' or as a defensive strategy in response to competitors, which have decided to make the move.
- Impact of exchange rate fluctuations - firms may locate production facilities in a number of different countries a protection against movements in currencies relative to others. For example, as a currency in one country strengthens against the currencies of its trading partners, exports will appear to be more expensive in those countries, China, for example has maintained the value of its currency, the Renminbi at an artificially low level against the US dollar to ensure that Chinese exports to the US remain relatively cheap and therefore competitive, whereas US exports will appear expensive in China compared to local manufacturers. One solution for US companies is to open production facilities in China.
- Overcoming a saturated domestic market - it is common for certain businesses to find it difficult to expand in a domestic market which is already working near capacity. Supermarkets have found this problem in many European countries. Chains like Carrefour and Tesco have sought expansion in new markets overseas. Overseas location may be used as an extension strategy.
However, there are problems and disadvantages associated with locating overseas. These restraining forces can include:
- Language and communication barriers - this may seems obvious, but it still needs to be tackled. Language issues may relate to communication between staff and between the organisation and external groups such as suppliers and customers. This may be the result of different languages, dialects, or simply caused by distance
- Cultural differences - this can be a real problem if it is not considered in advance, and the necessary adjustments made. Dress, food and behaviour are major areas where problems can occur, if one is not careful. Cultural differences are of particular concern to the marketing department which must be aware of consumer preferences, religious taboos and traditions, when deciding on product ranges. The HRM department will also need to be sensitive to the cultural differences in the workplace that will affect relationships and working behaviours.
- Regulations and legal restrictions - health and safety legislation, transport restrictions, ingredients and dietary regulations will differ from country to country. A firm would be advised to seek local agents and/or partners who understand the local environment, to guide them through the location and settlement process. This can, however, be costly.
-
 Ethics, morals and social responsibility - firms will do well to exercise extreme care when relocating all, or some of their operations overseas, to ensure that they and all their suppliers act with the utmost ethical integrity and do not seek to exploit labour in the countries where they are locating operations. US firms such as Nike have faced adverse publicity about alleged use of child labour and the operation of 'sweatshops in countries such as China, Vietnam, Indonesia and Mexico, which negatively affected their corporate image, and consequently sales. Nike has been forced to spend millions of dollars attempting to improve their ethical reputation, but failed to persuade all their critics of their true commitment to the highest ethical standards.
Conclusions
The Board of Directors can employ a range of business and financial tools, to evaluate the possibility of location, or the outsourcing of functions, overseas. Decision trees and force field analysis will help with the collection of data and the balancing of pros and cons, whereas investment appraisal and break-even analysis will assist in financial consideration of associated costs and revenues.

Rolls-Royce's growth in Asia
Will Rolls-Royce's growth in Asia pose a challenge to its global brand consistency?

Read the article Will Rolls-Royce's growth in Asia pose a challenge to its global brand consistency? (you can do this in the window below or follow the previous link to read the article in a separate window) and then answer the questions below.

You may also like to read the following articles to help you with answering the questions:
 It is likely that you will have to set up a free account with the FT (Financial Times online) to read this article. The effort is worth it as the FT has many articles of relevance to your business and management programme.

Question 1
Define the terms:
- Brand management
- Innovation
Question 2
Explain the qualitative factors that should be considered when examining a potential relocation.
Question 3
Analyse the potential impact of relocation on Rolls-Royce's international brand.
Question 4
Evaluate the choice of Singapore as Rolls-Royce's choice for its marine global headquarters and civil aviation manufacturing facility.
Case study - Subway Chain
 Subway sandwich chain has overtaken the Golden Arches of McDonald's as the largest restaurant operation in the world, as determined by the number of locations. Subway reported 33,749 restaurants in 95 countries, at end of 2010. McDonald's recorded 32,737 locations in 117 countries in an audit in February 2011, with more than 75% of its restaurants being franchised. Subway is entirely franchisee-owned, which has underpinned its success.
Subway has been gaining on McDonald's for years and had fewer than 30,000 locations as recently as 2008. Its smaller format cost less to open and operate than other chain restaurants and lets it squeeze into heavily trafficked locations McDonald's must bypass.
The race for global dominance is an important one for an industry that's mostly saturated in the U.S. High unemployment and economic uncertainty have battered the restaurant industry in the U.S., and chains are increasingly looking overseas for growth, particularly in Asia. Subway, which opened its first international restaurant in 1984, in Bahrain, expects its number of international restaurants to exceed its domestic ones by 2020. However, the growing number of Subway restaurant overseas does not earn enough revenue to outpace McDonalds, which still holds the top position as the world's largest restaurant chain in terms of sales.

Subway runs Past McDonald's Chain
Read the article Subway Runs Past McDonald's Chain (you can do this in the window below or follow the previous link to read the article in a separate window) and then answer the questions below.

You may wish to read this additional article to help you to answer the questions:

Question 1
Define the terms:
- Overhead costs
- Franchise
Question 2
Explain the role of market research in the choice of locations for Subway.
Question 3
Analyse the impact of location overseas on Subway's promotion strategy.
Question 4
Evaluate the use of franchising as an international growth strategy for Subway.
Virtual business and location
The so-called "virtual business" is a business organisation relying electronic means for its operation, such telecommuting and videoconferencing. As Web 2.0 services, have risen in popularity, many businesses have begun to use these communicative and collaborative technologies to reach their customers. The rapid increase in virtual business has reflected the desire and enthusiasm of many employees to work from home, as freelancers or consultants. The virtual business/business process is the act of decentralising to achieve competitive advantages for the business.
The exponential increase in Web 2.0 tools to promote social collaboration and business communication has inspired the following aggregation of real time counters produced by Gary Hayes on his blog, Personalize Media:
 A virtual business employs electronic means to transact business as opposed to a traditional business that relies on face-to-face transactions with physical documents and physical currency. Amazon.com was a virtual business pioneer, delivering and brokering bookstore services and connecting buyers and sellers without a physical retail store location. It took the notion of virtual business to its core market by developing its e-reader, the Kindle, which allows online downloading of books straight to the device.
A virtual business owner does not need to base its marketing plans on the local market qualifications. Instead, it can define its ideal customer in as much detail as possible, and search the globe for markets that meet this profile. Internet and web 2.0 technologies mean that e-commerce firms are not restricted to located in certain locations, and as such have become true footloose industries is a general term for an industry or business activity that can be placed at any location without effect from factors such as resources or transport.
Many physical businesses have recognised the convenience and cost-effectiveness of employ a 'blended solution' where they mix both physical and business operations; others, such as Second Life operate solely in a virtual world, selling virtual property, goods and services to virtual customers in a virtual world.
A virtual business relies on little or no staff. Instead, functions are outsourced, based on need, to other small business owners and services. There are many environmental and economic advantages of using virtual business services, such as those highlighted in the following sales video from Seltra, which uses Second Life to host business conferences and events in a virtual rather than a physical location.

Discuss the advantages and disadvantages on using an online conference and events service such as those offered by Seltra, over a physically located conference.

 Triple A Learning
Triple A Learning Ltd. is a provider of unique high quality online IB-approved workshops and IB resources. It is a virtual business in that all of its employees work remotely from different locations in the UK and uses a range of internet services and web 2.0 tools to conduct business activities. IB resources are downloaded via the internet for use on Virtual Learning Environments (VLEs) within schools and colleges rather than being published as a physical resource, such as a printed book or article. As you are reading this case study, you are of course involved in this experience in the most direct of ways!
 Being a global organisation teacher training workshops are conducted virtually too, rather than using traditional face-to-face training methods. The mentors who guide the training sessions are from every continent and time zone differences mean that much of the training is done asynchronously (at different times by different participants) using collaborative Web 2.0 tools such as discussion forums, wikis, RSS feeds and blogs. Some of the training is done synchronously (together) using virtual live classrooms, where participants can speak directly to mentors, who can upload documents, videos and sound files and draw on 'virtual' whiteboards.
A large number of MYP and DP subject blogs have been developed since 2010 written by senior IB examiners and experienced IB teachers. These provide a free resource to the IB community.


Select a virtual business and analyse the advantages and disadvantages of operating a business in this way.
Innovation - notes (HL only)
In previous sections, we looked at production methods, costs and revenues, break-even analysis quality assurance methods. In this section we will consider the role and importance of innovation.

- Explain the importance of R&D for a business
- Explain the role and importance of intellectual property rights for a business
- Analyse the factors affecting innovation
Innovation


Innovation
Innovation is the creation, development, implementation and commercialisation of new products, managerial and manufacturing processes and services with the objectives of improving efficiency, effectiveness, profitability and competitive advantage.
Follow the link below if you would prefer to view this interaction in a new web window:

Screen technology in 2014

'If I had asked people what they wanted, they would have said faster horses.'
Henry Ford said when talking about the development of the Model T motor car

An explanation of nanotechnology

A different take on miniaturisation!
The topic of innovation is covered in more depth in module 4.3 on new product design and development.
Innovation is not just about creativity and good ideas; it is about the putting these into practice and generating a commercial return. A key element of this is the process of Research and Development (R&D).
Case study - Xerox

Xerox
Read the article Is Xerox Wasting Their Money? (you can do this in the window below or follow the previous link to read the article in a separate window).

Use the article to answer the following question:
Why do some companies, such as Apple and IBM, have such great success reinvigorating growth through market repositioning while others like Xerox, Polaroid, and Kodak struggle?
Research and development (R&D)
Research and development involves two separate, but integrated processes. Research is the focus on finding new ideas and processes, whereas development is the application or commercialisation of these ideas and processes to create new products and services, with the intention of providing a unique selling proposition.

Research and development
R&D is a systematic activity combining both basic and applied research with the objective of discovering new products, processes or procedures to meet customer needs. It involves investment in new technologies, which the objective of increasing the capacity and potential profitability of a firm. The process may result in ownership of intellectual property, such as patents and copyrights.
There is absolutely no guarantee that R&D will be successful. It is possible to spend millions of dollars researching new energy sources or medical cures without success. However, without successful R&D, firms in some industries will not survive. Pharmaceutical industries are a case in point; new drug treatments are the lifeblood of such firms and determine their commercial success or failure. Any new drug must be approved by the relevant government agency in all the countries where it is to be commercialised.
May 31, 2011 (Business Wire) - Affymax, Inc. (NASDAQ:AFFY) and Takeda Pharmaceutical Company Limited (TSE: 4502, "Takeda") today announced the submission of a New Drug Application (NDA) to the U.S. Food and Drug Administration (FDA) for the investigational agent peginesatide (formerly known as HematideTM) for the treatment of anemia associated with chronic renal failure (CRF) in adult patients on dialysis.
You can read further details of the application in full through by clicking on this link.
Some firms do not undertake expensive R&D, but may choose to develop existing ideas or sell 'me-too' products, which are products that copy a competitor's product or innovation and are generally sold at a cheaper price.

The Pharmaceutical Industry
Declining Return on Investment (ROI) in the pharmaceutical industry is currently raising concerns among the key stakeholders. There is a widening gap between the R&D expenditure and the number of new drug approvals. R&D expenditure is steadily increasing, but this is not reflected in the number of new drug approvals, especially in the US where the FDA (Food and Drug Administration) is demanding stricter clinical trials of new drugs before approval and commercialisation.
The rate of new drug discovery over the past 10 years has been so poor that the head of one big pharmaceutical company has dubbed it the "lost decade". The increasing cost of R&D and new technologies and shorter life cycles has resulted in pharmaceutical firms looking for partnerships in the R&D process, where expenses, resources and knowledge can be shared. However, the wave of consolidation in the pharmaceutical industry over the past two decades has created larger companies with bigger product portfolios, but in many cases has saddled R&D units with diseconomies of scale and too much bureaucracy to be effective.
Pharmaceutical companies - a new contract
Pharmaceutical companies 'defining a new contract with society'
Read the article Pharmaceutical companies 'defining a new contract with society' you can do this in the window below or follow the previous link to read the article in a separate window) and then answer the questions below.

You may also like to read the following articles to help answer the questions:

Question 1
Define the terms:
- Merger
- Productivity
Question 2
Explain the importance of research and development to pharmaceutical companies.
Question 3
Examine the reasons why firms find it difficult to fund research and development.
Question 4
Evaluate joint ventures, mergers and other network models as methods of achieving the growth objectives of pharmaceutical companies such as Nestlé and AstraZeneca.
Innovation and R&D
 Innovation may be the result of Research & Development, but it may simply involve better technology or better methods of working without investment of time or money. R&D is likely to be a formal programme to find new products and services or to improve product quality and function, whereas innovation may simply involve incremental change at a micro level.
The R&D department should work closely with both marketing and production. The demands on R&D can be linked to the product life cycle (the shorter the life cycle of a product, the faster that new products must be developed), new product development and the firm's product portfolio. Look back at the Boston Matrix and the role of the cash cow in a firm's product portfolio. All firms need at least one cash cow to generate the cash flow to pay for R&D.
A typical cycle may go like this:
- Marketing identify a need for a new product. They 'design' it in terms of concept, performance and consumer needs.
- R&D produces one or more products to meet the marketing brief.
- Products may go to market research and test marketing.
- Suitable products, after investment appraisal, go into production and onto the market.
The process starts all over again. Frequently work will start on a new project before the last project is finished. So R&D ends up working on a portfolio of projects. Some will be long-term; others short-term. Some will have a clear commercial future, others may be more difficult to exploit.
R&D is usually found within large commercial organisations. Here R&D may be found both as a function on its own, and as part of the operating companies. Unilever is an example.
Europe moving in R&D slow lane
Read the article Europe falling behind US and Asia in R&D, EC says (you can do this in the window below or follow the previous link to read the article in a separate window) and then answer the questions below.
You may also wish to read the following articles to help with answering the questions:
China closes in on Europe's R&D spending

Question 1
Explain the difference between research and development.
Question 2
Summarise the differences in R&D spending between Europe and China that are identified in the articles.
Question 3
Assess the importance of R&D to firms.
Question 4
Discuss possible policy options available to European governments to encourage more spending by firms on R&D.
Canadian apparel companies dress for success
Read the article Canadian apparel companies dressed for success (you can do this in the window below or follow the previous link to read the article in a separate window) and then answer the questions below.

Question 1
Define the terms:
- vertical integration
- labour intensive.
Question 2
Explain the reasons behind the loss of 40,000 manufacturing jobs in Canada over the last ten years.
Question 3
Analyse the impact of an aging population on the Canadian apparel companies and their HR operations
Question 4
Evaluate the decision made by Canadian apparel companies to 'move up the value chain to focus on innovation, creativity, branding and distribution'.
R&D - costs and benefits
 There are some distinct costs and limitations associated with R&D.
R&D is expensive and there is no guaranteed success. A firm needs to employ expensive scientists and/or researchers (they tend to be rare, and so in demand) and provide expensive facilities in which they can work. Failure rates are very high; few ideas make it to commercialisation.
It is clearly an economy of scale, so larger firms can afford greater investment in R&D, which contributes to their continued growth, possibly at the expense of smaller firms. However, since returns are likely to be in the future, the R&D budget is susceptible to cuts in poor economic periods, as expenditure on R&D has significant opportunity costs in the short run.
R&D may be controversial with new products pushing the boundaries on what is social acceptability and challenging exiting ethical values. For example,
- Medical researchers believe that stem cell therapy has the potential to dramatically change the treatment of human disease, but it can involve the use of human embryos, which is seen as unacceptable by several religious and pro-life pressure groups.
- The use of genetically modified (GM) products has been consistently opposed by a number of pressure groups, such as Greenpeace.
However, there are many benefits arising out of the R&D process:
- Higher sales and profits as a result of brand switching and increased customer satisfaction levels
- First mover advantage
- Allows entry into new markets or market segments
- Possible increase in market share as the firm gains a competitive edge
- Improvements in quality
- Greater employment opportunities and potentially higher morale as employees feel greater pride and confidence in the firm's product range
- Social benefit arising and an improved quality of life, especially as a result of medical improvements
R&D is likely to result in the taking out of new patents, copyrights and trademarks.
Patents, copyrights and trademarks
Follow the link below if you would prefer to view this interaction in a new web window:
Intellectual property (IP) rights have commercial value because they can:
- distinguish a business from its competitors
- be sold or licensed, providing an important revenue stream
- offer customers something new and different
- form an essential part of the marketing or branding process
- be used as security for loans or other investments
There are a number of organisations which protect such rights in different countries and trading blocs:
- United States Patent and Trademark Office
- European Patent Office (EPO)
- Eurasian Patent Office (EAPO)
- African Regional Industrial Property Organization (ARIPO)
- UK Intellectual Property Office
- World Intellectual Property Office (WIPO)
What is WIPO?
The World Intellectual Property Organization (WIPO) is an agency of the United Nations. dedicated to developing a balanced and accessible international intellectual property (IP) system, which rewards creativity, stimulates innovation and contributes to economic development while safeguarding the public interest. Its headquarters are in Geneva, Switzerland.
Intellectual Property Rights (IPR)
Follow the link below if you would prefer to view this interaction in a new web window:
Additional IP protections
Firms and/or individuals may also protect their IP in other ways, such as drawing up a confidentiality or non-disclosure agreements (NDA). A firm may need to discuss its invention with other people including lawyers, consultants, potential investors or consultants before applying for patent, so it is important that the details of the invention are not disclosed to others by those individuals or firms.
It is also possible for a firm to use technological measures to prevent illegal uses of its copyright material, such as encryption or copy protection. If a firm uses such additional protections, it has the right to take legal action against a person or firm, which gets round the measures or makes, sells or deals in devices specifically designed to get round the technical measures.
Digital Rights
The digital revolution has brought into focus the difficulty in protecting intellectual property, especially across national borders when the broadcast or transfer of protected materials and ideas is technically so easy. The use of peer-to-peer (P2P) technologies, where bits of files are passed between many users and then aggregated back into the complete product (using tools like BitTorrent) has made it even more difficult for organisations to protect illegal downloading and broadcasting of copyright materials such as music and sports events, and is used by BitTorrent communities to encourage free sharing of software.

Read the article European Commission announces legal blueprint for digital piracy in intellectual property rights overhaul (you can do this in the window below or follow the previous link to read the article in a separate window).

Reflect
Consider the problems the EU commission is facing ensuring the right level of protection of intellectual property rights in the EU single market. How should it balance the need to protection IP owners from digital piracy with their role of stimulating economic growth in the digital industry? Should governments protect IPR if this seriously restricts entrepreneurship?
Even if laws are developed to protect digital IPR, the nature of the virtual environment and the increase in social media sites can make it more difficult for the creators of artistic works to protect their ownership. The article Your photos? Not so according to many popular photo-sharing apps identifies some of the issues of sharing photographs on social media sites such as Flickr and Twitpic.
China: The Intellectual-Property Battleground

Read the article China: The Intellectual-Property Battleground (you can do this in the window below or follow the previous link to read the article in a separate window) and then consider answers to the questions below.

Write an 800 - 1200 word report on Protecting Intellectual Property
Your report should include:
- Definitions and explanations of the main forms of IPR protection, such as patents and copyrights
- An explanation of the importance of IPR to technology companies such as Dyson
- An examination of why protecting Intellectual property is so important to the national economy
- An analysis of the problems with global protection of IP
- Using the article the 'Intellectual Property battleground', a discussion of the challenge to the US from China in terms of innovation and IPR

You may also wish to access/read the following to help prepare the report:
Factors affecting Innovation
Follow the link below if you would prefer to view this interaction in a new web window:

External factors could be presented in the form of a PEST analysis.
Case study - 3M corporation

3M Corporation
One firm renowned for its attitude to innovation and investment in R&D projects is 3M Corporation. 3M has a 15% rule: for decades, engineers and scientists at the company have spent up to 15% of work hours on their own projects, playing with ideas that have nothing to do with their job's mission. In addition, the company expects all new product teams to be led by a 'Product Champion'. The champion typically has an entrepreneurial vision of a new product, and recruits scientists to use their 15% time to help develop the vision. New product teams can make great progress on company time with no official approval, and once they have developed their idea far enough, they appeal to the company for funding to bring their venture to market.
3M bets heavily that informal, bottom-up scientific innovation will lead to profitable products, an approach reflected in its demand that 30% of each division's sales come from products less than four years old. A new product development team at 3M is cross-functional, collaborative, autonomous and self-organizing. It accepts change, takes initiative and assumes risks. If the team is making progress toward a new product, it will be left alone. This unwritten rule of 15% dream time is so ingrained at 3M that "you can feel it right down to your toes," as one 3M scientist put it.
Over 6,500 scientists and engineers in the R&D community proudly represent 100 years of breaking technical boundaries. Our work spans abrasives and optics to nanotechnology and micro-replication. It's complicated. To simplify, we collaborate across technical, functional and global boundaries. This is how we build robust skills and discover revolutionary solutions.
We encourage employees to explore ideas outside their day-to-day job, (historically called the 15% rule). That's part of the story behind the invention of Post-it(r) Notes. Select grants often fund these 15% projects.

5.6 Innovation - questions

In this section are a series of questions on topical news items in relation to the topic - Innovation.

It seems so obvious

Read the post It seems so obvious... (you can do this in the window below or follow the previous link to read the article in a separate window) and then consider answers to the questions at the end of the post and reproduced below

Question 1
Define the terms:
- USP
- Entrepreneur
Question 2
Explain why Dyson wanted to set up his business.
Question 3
Analyse the problems that start-up businesses, such as Dyson face.
Question 4
Discuss the importance of protecting intellectual property rights for high technology companies like Dyson.

5.7 Production planning - notes
In previous sections, we looked at production methods, costs and revenues, break-even analysis, quality assurance methods and innovation. In this section we will examine production planning.

By the end of this section you should be able to:
- Explain the difference between just-in-case and just-in-time

- Recognise the need for optimum stock levels; prepare and analyse appropriate graphs
- Explain different stock control methods and analyse the appropriateness of each method in a given situation
- Explain outsourcing and subcontracting
- Discuss the arguments for and against outsourcing and subcontracting, compared with provision by the firm itself
- Make appropriate calculations to support a decision whether to make or buy
Production planning
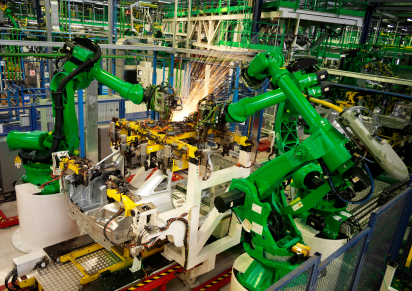 We have stressed throughout this course that business and management is an integrated subject and this module is no exception! Throughout the module you should always be looking for links between the different areas of business activity.
Although the focus of the module is on production and managing the operations of the business related to production, the production department cannot work in isolation. They need to collaborate and communicate with other areas of the business. This collaboration should focus on the objectives of the business and what it is trying to achieve. If the firm wishes to boost market share, for example, then production will need to be higher. However, if the aim is to develop a competitive advantage and consolidate their market share, then the production department may need to focus on productivity, quality and cost minimisation. In this case they may need to look at developing a more substantial research and development programme.
So the production department will need to work closely with the other areas of the firm and look at issues like:
- Is there enough capacity to cope with an increase in demand?
- Are there sufficient production staff to cope with an increase in demand?
- Is the workforce flexible enough to change if there is a fall in demand? Does the firm need to develop a workforce plan related to the production plan?
- What is the marketing department aiming to achieve? Are there any current marketing drives that are likely to have production implications?
- What is the financial situation of the firm? Is there pressure to reduce stocks and perhaps change production methods to just-in-time or another appropriate method?
- What is the growth strategy of the firm? Is the aim for rapid growth in which case, is there a need to develop new production techniques or find new machinery? Is there likely to be a merger or takeover, that will require the production department to integrate their systems with another plant/factory?
All these and any other relevant factors can be incorporated into a production plan. This, for reasons we have seen, will also need to be part of a wider plan that incorporates marketing, finance and other business areas. Planning is not a lonely activity!
The nature of stock
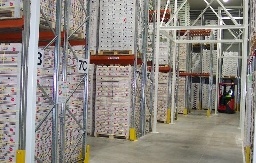 Firms have to manage their people and their processes. They also have to control their usage of materials, and the quality of the products they produce. This leads to the twin topics of:
- Stock control
- Quality control
Both of these operations have changed significantly over the last few years, largely as a result of developments in Japan. We will start this unit by considering the control of stocks.
If you examine a typical factory you will see many stores or warehouses partly full of a vast range of materials. Most of these have a purpose (although some may be obsolete), and can be classified under a number of headings.
List as many as you can, then click on STOCKS to see if your list corresponds with ours.

For the Business and Management course, we normally consider three main categories of stock:
- Raw materials
- Work-in-progress
- Finished goods
Together these three are normally regarded as the inventory of a firm; the materials and goods required in order to produce for, and supply to, the customer
It is important that you recognise that the term stock can cover each, and all of these categories. For a firm suffering from liquidity problems, it would clearly be preferable if its stocks were composed of finished goods ready for sale (and for which there is a demand), rather than piles of unused raw materials. The accounts of a firm need to be studied carefully to identify the nature of the stockholdings, to allow for a better evaluation of its financial position.
The purpose of Stock Control
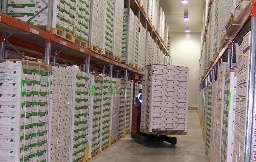 A key purpose of stock control is to minimise stocks and the costs of holding stocks, while ensuring that firms have sufficient stocks to meet customer needs. This proposition may sound simple, but it is complicated by fluctuations in demand; only some of which may be predictable.
The main reason for holding stocks of work-in-progress is to allow greater flexibility in the utilisation of machinery, while holding finished goods in stock allows for variations in consumer demand patterns. The demand for certain products, for example, is influenced by the weather. A sudden cold or hot spell can affect demand patterns significantly and producers may suddenly find themselves running out of stocks completely or alternatively, having excess stocks and facing the problems associated with storage and storage costs.
Costs of holding stocks
While it is possible to measure the components of holding cost, it is common to estimate them as at least one-third the value of the stored goods per year. So, if the stock value is $600,000, then the cost of holding that stock is likely to be around $200,000. This percentage can be higher for perishable items or items requiring specialised facilities or a higher level of protection.
Holding stock is one thing, doing it efficiently is another. Firms must:
- Ensure that stock rotation takes place. Many materials have a shelf life. Firms must be careful that this date is not exceeded. Stocks need to be stacked and recorded so that the oldest material is used first. This is sometimes known as FIFO or 'First In, First Out'.
- Ensure that wastage is minimised. Stock needs to be looked after. It must not be stacked too high and it also must be handled carefully. Wastage will also include theft, so security must be sufficient, especially for valuable materials.
So, the direct costs of holding costs include:
- Warehousing fees including security charges, rent and insurance
- Losses from theft or damage
- Obsolescence - 'dead stock' created by fashion change
- Taxes
- Administration e.g. labour costs of processing orders and the inspection and return of poor quality products
- Interest on the loans taken out to create the inventory in the first place
One of the main major causes of business failure is poor cash flow. Stock is a liquidity issue, because stock represents tied-up capital, which cannot be released until raw materials are turned into finished goods and then sold. Having money tied up in stock is not just the cost of tying up liquidity, but also the opportunity cost of money that could be deployed elsewhere, such as investing in more capacity.
Cost of inadequate stock levels
While there can be significant costs involved in holding high stock levels, there are also significant risks and associated costs, of holding low levels of stock, which may result in a stock-out situation. This situation could have some of the following consequences:
- Inability to satisfy unexpected large orders and lost sales - when faced with a large order the firm may choose to meet this and let existing smaller customers down, or alternatively refuse the new large order, which may have future costs as well, if that business places orders with competitors who can meet their demand.
- Loss of goodwill - as a result of failing to meet customer orders, the word may get out that the business is unreliable.
- Uneconomic purchasing orders - small production runs may mean that the firm buys raw materials in relatively small quantities; possibly losing out on bulk discounts.
-
 Longer delivery lead times - in a world of instant gratification and customer experience with online suppliers such as Amazon.com, expectations of quick delivery times are increasing. Firms which can promise delivery, say within 24 hours, may win an order over those businesses that have longer delivery times.
 - Risk of production shut-down - if a firm holds low volumes of raw materials, any delivery failure by suppliers my result in a loss of production.
The question therefore arises: how much stock should a firm hold?
There are two extreme answers to this question:
Stockpiling
- this ensures that the firm never runs out of raw materials of finished items as the firm always has stocks, 'just-in-case' (JIC) of large and/or unexpected orders
- is an easy way of managing stock
- is expensive in stock costs, but cheap in purchasing and management costs
none/very little
- this relies on a non-traditional approach to stock management such as 'Just-in-time' (JIT)
- is a difficult way of managing stock in terms of purchasing systems and management
- the firm may not obtain full discounts on smaller orders
- risks loss of customer and goodwill
Ultimately, the decision may come down to the existing stock control system the firm is presently operating and its willingness to change to an alternative.
Stock control systems

Stock control
Stock control is the sum total of policies, practices and procedures that a firm follows to ensure that its stocks are kept at levels consistent both with meeting predetermined standards of service and with releasing funds for working capital.
Just-in-case (JIC) and just-in-time (JIT)
Just-in-case (JIC)
Traditional approaches to stock control rest on the basis of batch production techniques used in manufacturing. Raw materials are bought, processed and stored in batches. Not much emphasis is placed on establishing a flow of production, often as a consequence of relatively low, or inconsistent, demand patterns. Even in the world of modern, technology-based production, it is estimated that more than 90% of all manufacturing businesses in the world still subscribe to batch production techniques. This clearly has significant implications on the methods of stock control that they apply and their approach to lean production and quality assurance.

Just-in-case (JIC)
Just-in-case is a production and distribution system, with buffer stocks held at every stage in the production process 'just in case' there is a production problem or demand rises unexpectedly. Stocks of raw materials, components, work-in-progress and finished goods are held by the producer to ensure continuous production.
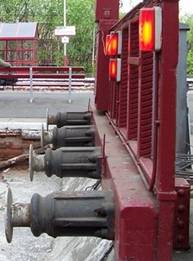 The traditional approach to stock control is called a 'just-in-case' approach. This means that the firm holds buffer stocks of raw materials ready for production just in case they are demand or supply fluctuations. Holding minimum stock levels means that:
- greater flexibility to meet customers' needs, even when there are unexpected changes in demand
- stock is ordered less frequently, reducing clerical and purchasing costs
- the firm can buy in bulk, and reduce unit purchase price by negotiating higher discounts (purchasing economies of scale)
- the firm can avoid stock-outs and the resulting production downtime
The just-in-case system is favoured by traditional manufacturers, but this approach does not sit well with quality assurance methods as there is no real incentive to achieve zero defects, since spare stock is held at all stages of the production process. Waste is the consequence of JIC and runs counter to the principles of Total Quality Management (TQM) and Lean production as developed by W Edwards Deming.
Just-in-time (JIT)

Just-in-time (JIT)
A management and manufacturing philosophy aimed at the total elimination of waste. JIT is designed to minimise the costs of holding stocks of raw materials, components, work-in-progress and finished goods by supplying to each part of the production process exactly what is needed, when it is needed and in the quantity it is needed. Critical components of the system include total quality management, lean production and employee involvement.
The JIT philosophy was developed following the second world war in Japan by Kiichiro Toyoda and embedded at the Toyota Motor Company by Taiichi Ohno. Moving to JIT from a more traditional production system such as just-in-case, requires a change in corporate culture, a different organisational structure and a more democratic management style.
With JIT production, an absolute minimum level of stocks is held with materials delivered, just as they are required and in the quantities needed. JIT is an element of lean production, running with minimal buffer stocks and relying on daily or even hourly deliveries from trusted suppliers. Since there is no bolt-on quality control in JIT, defects in components could bring the whole factory to a stop. Consequently, stocks and components supplies must have zero defects. Firms that operate JIT work with their suppliers to ensure that the whole supply chain employs consistent quality assurance methods and procedures.
The principle of JIT is that products should be 'pulled through' the factory, rather than 'pushed through'. In practice, this means that production should be to meet specific customer orders, not produced just-in-case. Finished goods are not kept in the warehouse, but delivered immediately to the customer. Overall, the need for working capital is reduced significantly.
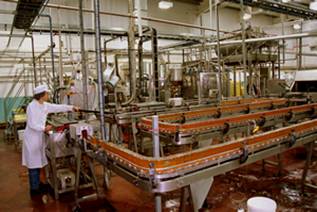 JIT working has led to the development and use of preferred suppliers, rather than manufacturers relying on competitive tenders. A good relationship between supplier and buyer is necessary so that suppliers are willing to make the necessary investment in quality systems and procedures. Some buyers even made direct investments in their suppliers. Teamwork is central to the JIT approach.
JIT is widely used in car assembly. The specific order from the customer is given an assembly slot, a number and a bar code. All the components are ordered to be available that day. They are given bar codes and organised to arrive at the appropriate assembly spot at the correct time. The specific car rolls off the assembly line on time. In fact, because each car can now be customised, buyers of Saab and BMW cars have recently been given the opportunity to see their own vehicle being manufactured. Using seven cameras in BMW's South Carolina plant, BMW deliver X3 customers with video that tracks their vehicle through the various stages of final assembly.
The system works because of the use of computers and bar codes, as well as the use of skilled and trained workers. Flexibility is key to the success of a JIT system. All the production team must be multi-skilled and are likely to be working as teams within production cells. This requires well-motivated employees who give the system and procedure their full support and co-operation.
Machinery too, must be adaptable and there is heavy use of Robotics in JIT production lines. Equipment will be laid out according to the work sequence. Quality is assured by keeping small inventories and through one-piece flow production, meaning one product moves from process to process, allowing production workers to make a complete inspection of every piece manufactured. Quality is considered to be everyone' responsibility and each employee has the power to stop the production line if a problem is identified. Trust is a vital requirement and managers must be prepared to delegate responsibility.
JIT is example of the interaction between methods, systems, procedures and people to ensure success.
Summary
Advantages of JIT
- reductions in the cost of holding stock
- space that was used for storing stock can be released for other activities
- minimal inventory releases cash flow for use elsewhere in the business
- reduces the chance of holding obsolescent stock with less chance of damaged stock
- allows a firm to lower its break-even point
- improved motivation and teamwork with more flexible and multi-skilled employees
- promotes customer focus and increased flexibility and responsiveness to individual customer needs
- allows for greater customisation in the production process
- greater focus on quality and zero defects and lowering of waste levels
- strengthens collaboration along the supply chain
Disadvantages of JIT
However, like many things in business, just-in-time is not a panacea for all ills. JIT may not be suitable for all firms as JIT has limitations and drawbacks:
- there is a heavy reliance on suppliers - any failures in delivery can lead to expensive production delays and stock-outs
- JIT does not cope well with sudden surges in demand
- lower stock order quantities does not allow for the same level of purchasing economies of scale as found in traditional stock control systems
- frequent small deliveries are likely to be expensive as there will be fewer bulk discounts
- administration costs are likely to be higher maintaining stock levels and ensuring no stock-outs
- JIT requires a change in management style - not all managers and workers are prepared to 'buy-in to the philosophy'
- training costs can be higher than traditional production systems
- JIT needs expensive computer technologies and robotics for its smooth operation
- Increasing global inflation, especially in components, makes the holding of stocks through forward buying beneficial
Traditional approaches to stock control

Large stocks increase the possibility of the firm experiencing cash flow problems; stock-control charts are used to monitor a firm's stock position with the objective of avoiding this. These stock charts include details on stock levels, usage rates, order quantities and delivery times. A typical stock shows the following:
- Minimum stock holding. This is the minimum level of stocks that a firm aims to hold under normal conditions. This is sometimes known as the buffer stock level. It is there to absorb 'shocks' and act as a contingency stock should things go wrong with delivery or there is unexpected demand. Again firms will wish to minimise the level of the buffer stock as this is tied-up capital, but must balance the cost of this against the cost of a having to shut production down.
- Economic order quantity (EOQ). Firms can order a large amount infrequently or small quantities very frequently. Purchasing managers may wish to order large quantities to gain the highest possible discounts, but these discounts will be offset by the high costs of stock-holding. There is an optimum level, however and stock managers need to work this out. It will depend on the cost of deliveries and the nature of the stocks themselves. The EOQ will differ from product to product e.g. bulky goods tend to be delivered in larger quantities to keep the cost of delivery down. The optimum stock level will be at the lowest point of the total stock cost graph, which is the combination of the cost of holding stock and the cost of not holding stock and is shown in Figure 1 below.
Figure 1 Minimum stock level

Economic order quantity (EOQ)
The stock re-order method, which attempts to calculate the optimum order quantity of a specific product by balancing the conflicting costs of holding stock and delivery of replenishment stocks.
- Planned usage rate. Firms must record how much stock is used over a given time period. Although this may not be consistent over a year, there are often predictable variations in demand patterns caused by seasonal patterns and spikes in demand during holidays and festivals. These need to be built into any forecasting process.
- Lead time/delivery time. The time it takes to place and receive an order. It includes all the time it takes the firm to get the order to the supplier, as well as the supplier's delivery time.
- Re-order level. This is the level of stock at which the firm will have to reorder to ensure they have sufficient stock to stay above their minimum stockholding. This level takes the lead time into account.

Preparing the Stock control Diagram

If you would prefer to view this interaction in a new web window, then please follow the link below:

Impact of errors

If you would prefer to view this interaction in a new web window, then please follow the link below:

The Toyota Production System


Read the article The origin of the Toyota Production System (you can do this in the window below or follow the previous link to read the article in a separate window)

You may also like to read the additional articles:
- Illustration of the Toyota Production System
- Toyota Production System (TPS): Several Small Views from a Great Height
to support your answers to the following questions:

Question 1
Define the terms:
- Lean manufacturing
- Kanban
Question 2
Explain the difference between just-in-case and just-in-time methods of stock control.
Question 3
Examine the advantages and disadvantages of introducing a just-in-time (JIT) stock control system.
Question 4
To what extent will the introduction of a Kaizen system of continuous improvement within a firm ensure quality improvements?

Capacity Utilisation

Capacity (the amount a firm can make) depends upon the resources, such as buildings, machinery and labour it has available. Capacity utilisation is the extent to which that capacity is being used. When the firm is making full use of all its resources, it is said to be working at full capacity or 100% capacity utilisation. This is a vital piece of information in the process of reducing waste in the production process.
Capacity utilisation (%) is calculated using the following formula:
![]()
For example, if a firm could produce 2000 units per month, but is actually producing 1200 in that period, its capacity utilisation is:
![]()
A firm's level of capacity utilisation is of considerable financial importance, because of the impact of fixed overheads per unit on profit margins. As a firm's capacity utilisation increases, the fixed overheads will decrease per unit as the overheads are spread over many more units of production.

A firm has fixed overheads of $24,000 per month and a capacity of 2000 units. The fixed overhead per unit would be $20 per unit at 60% capacity utilisation, but only $12 per unit at 100% capacity utilisation. Any price would have to at least cover the unit overhead cost.
There are many implications of lower unit costs for a business, both on price and profit. It is to be assumed, therefore, that firms would always seek to run at 100% capacity utilisation if this is possible. Most firms, however, will aim to operate close to full capacity, but probably not at 100% as this throws up a number of potential problems:
- All machinery and equipment requires some downtime for routine maintenance, without which breakdowns may happen. Would you like to fly in a plane that had not be maintained at all for several months, but simply cleaned and refuelled and put back in the air? Breakdowns are likely to be more expensive than accepting lower capacity.
- Working at full capacity may create stressed workers and managers, resulting in increased mistakes, accidents, lower motivation and productivity, absenteeism and higher labour turnover.
- A small amount of spare capacity is accepted as necessary to provide level of flexibility in case of need. Sudden surges of demand can be catered for in the short run by increasing output, not upsetting potential customers whose needs could not otherwise be met.
- Overtime payments may be necessary to reach full capacity, increasing labour costs
- For service companies, especially those offering personal services such as hairdressing or restaurants, high capacity utilisation may increase queuing times and may lead to poorer customer service. Overcrowding at holiday resorts and leisure parks will always reduce customer satisfaction levels. Think of those queues in theme parks!
- An overcrowded factory space may be less efficient as the firm suffers from diminishing returns as people get in each other's way and have to wait for equipment etc. As saying goes, 'too many cooks spoil the broth'.
You may well have seen this viral video for overcrowding in a wave pool in Tokyo - a definite case of maximising capacity!
High capacity utilisation will be more important for some firms than others. For example firms with low profit margins and high fixed costs. The recent global recession has led to greater competition in the market place for customers and many are looking to cut costs, and therefore to offer competitive prices by increasing their capital utilisation. The airlines and in particular, budget airlines see this as the only way they can retain market share.
Firms operating near capacity may have to consider investing in new premises or subcontracting or outsourcing orders to other companies which have spare capacity. Investment in new premises is likely to have upfront costs and should only be considered if the higher demand pattern is likely to continue into the long-run. Many businesses, particularly those in the service sector, cope with fluctuating demand by employing temporary or part-time workers. If demand then falls these temporary staff can be laid off without redundancy payments and part-time workers can have their hours reduced.
Alternatively, firms working at low capacity may have to rationalise their assets as they are likely to be losing money e.g. if a firm has three factories operating at 65% capacity, it may close one factory and distribute the production between the remaining two factories. Obviously a possible consequence of this is redundancy.

Outsourcing and sub-contracting

 As markets become ever more competitive and global, firms are looking for ways to gain that 'extra edge'. Naturally, selling more products must be the main focus for any business, but increasingly it is the cost base of a firm that is receiving the greatest attention. If costs are lowered, the firm will have several choices. They can reduce prices and gain market share; they can retain price levels and make a larger profit margin, or of course, they may combine the two benefits.
One focus for cost reduction is the activities that a firm undertakes. Some of these activities are core to the firm's operations. In most cases the actual marketing of the product or service fits into this category. Some other activities, particular routine, and /or repetitive features are necessary, but the skills required might not be specific to the firm, nor skills, which they possess in great depth. Increasingly firms are asking the question whether they can outsource some of their operations, so they can focus on a limited number of key operations. An increasing range of activities, including IT services, training, payroll and public relations are now being outsourced. One area that has particularly been the object of outsourcing has been call-centre services, which over many years have increasingly been located in lower wage areas such as India and Latin America. These jobs are handled by separate companies that specialise in each service, and are often located overseas.
The specialised company that handles the outsourced work is often streamlined with world-class capabilities and access to new technology that the outsourcing business could not afford to buy on their own.

Case study - The Call Centre Industry


The Call Centre Industry
 China and Japan are widely acknowledged by India's software leaders to be the hardest outsourcing markets to crack. Japan has a perceived resistance to change among its country's businesses and a lack of urgency to innovate, while China's difficulty is ascribed to cultural differences. India's flexible private sector often finds it difficult to come to terms with China's more state-driven enterprises. Both markets pose linguistic challenges for an Indian sector that has prospered using English as its medium.
What call centres represent is a microcosm of economic and industrial conditions and trends. India, Costa Rica and the Philippines were chosen to host call centres because of their low wage rates, but relatively developed infrastructure. The savings on the staff wage bill by firms in MEDCs can be substantial. However, the economic tides are shifting and there are moves to reverse the process.
High unemployment levels have driven down wages for some low-skilled outsourcing services in some parts of the US, particularly among the Hispanic population. At the same time, wages in India's outsourcing sector rose by 10% between 2010 and 2011 and senior outsourcing managers based in the country command salaries above global averages. Indeed, Pramod Bhasin, the chief executive of Genpact, said his company expected to treble its workforce in the US by 2014.
In a another move which goes against the trend of sending call centre services to other parts of the world, Canon New Zealand and Australia have joined forces with Kiwi-owned company, Datacom, to bring the Canon contact centres back into Canon New Zealand's headquarters. This return of an operation or activity previously outsourced to the home country is referred to as backshoring, reshoring, or 'onshoring'.

Read the article:

Explain the case for 'backshoring'.

Outsourcing


Outsourcing
Outsourcing is the transfer of the provision of services previously carried out by in-house personnel to an external organisation, usually under a contract with agreed standards, costs and conditions.
 Outsourcing at its simplest is when a firm or individual delegates some of its specific tasks to another individual who is not their direct employee, or to another business. The individual or the firm receive a fee in exchange for the services rendered. Outsourcing, however, is not always about getting manufacturing work done overseas. There are situations where both the client and the service provider are located in the same country. It is understood that outsourcing often brings cost benefits; however outsourcing work overseas is not always necessary for this purpose. Although cost saving is one major reason why companies outsource, there are also other factors like greater flexibility and access to a larger number of skilled people without actually employing them. Outsourcing is seen as a method of reducing costs as the outside firm promises to do the job for less than the outsourcing firm would spend to do the work inside. It is seen as a way of achieving greater commercial 'focus'.
Even domestic outsourcing can also reduce costs. Employees hired on a contract/outsourcing basis do not have to be paid for medical expenses, pensions and other benefits and so overall costs can be considerably lower.
Outsourcing does not necessarily mean only situations where large corporations are involved. It can also apply to small firms and entrepreneurs who get some of their work done by people who are not their employees.
If a firm is looking to expand, outsourcing is a cost-effective way to start building foundations in other countries.
Firms may choose to move their entire production to locations overseas where manufacturing costs, particularly wage costs, are lower, or they may choose simply to outsource components. In the service sector the initial contact with customer is now commonly the responsibility of specialist call centres. These act as a filter, separating routine requests for information from enquiries requiring more technical or specific knowledge. The call centre deals with the former issues and passes the latter on to specialists in the outsourcing firm.
In practice, when activities are outsourced, it is common for the firm winning the contract, to rehire some of the staff made redundant by the outsourcing business since they have working knowledge of the operations. Indeed, there may be a term in the contract that guarantees this. However, these staff may work harder and for longer hours, often for lower wages. The question has to be asked whether they will be motivated to do their jobs better.
There is considerable debate about the benefits and drawbacks of outsourcing. These are summarised as follows.
Advantages of outsourcing:
- Specialists are hired to do top quality work at guaranteed prices.
- Internal staff numbers can be reduced, saving salaries, benefits and bonus payments.
- Firms become more flexible. Supply can be matched more closely with demand. If demand is low there is no need to reduce staff numbers. As demand increases, production is contracted out to external suppliers.
- It is a method of quick growth without incurring significant capital costs.
- Outsourcing to Less Economically Developed Countries may stimulate economic growth in those countries and provide employment opportunities.
- Import tariffs may be avoided by producing in countries where the products are to be sold.
- New technologies are coming on stream to make the process easier and probably more successful.
Disadvantages of outsourcing:
While outsourcing may prove highly beneficial for many companies, it also has many drawbacks:
- Outsourcing often eliminates direct communication between a company and its clients. This prevents a company from building solid relationships with their customers, and often leads to dissatisfaction on one or both sides.
- There is the danger of not being able to control some aspects of the company, as outsourcing may lead to delayed communications and project implementation.
- Any sensitive information is more vulnerable, and a company may become very dependent upon its outsource providers, which could lead to problems should the outsource provider back out on their contract suddenly.
- Firms locked into outsourcing contracts may suffer losses if the prices of the finished goods or services fall.
- Motivation within the firm may drop as redundancies are made.
- Administration and monitoring costs of running the contract may be high.
- There are ethical problems. Outsourcing may involve the exploitation of labour, which may be paid poorly, in working environments with little or no health and safety regulations. Many large multinationals have also been accused of hiring child labour.
- Quality control is more difficult. Outsourcing may destroy the image or goodwill of a firm built up over many years, if the quality of the goods and services fall.

Make or buy decisions

When it comes to deciding whether or not to outsource production, it is best to keep the following in mind - "Do what you do best and outsource the rest". This may sound simple, but in today's competitive landscape, it is a decision that is not and should not be taken lightly.
Businesses are born because the founders believe they have a better way to meet customer needs; however, not all functions within a firm are critical to those needs. The ones that are critical are defined as 'core activities' and should be retained in the business under its direct control, as these provide strategic advantage. Understanding the 'core competencies' that make a firm unique is a critical step in any make-or-buy decision, because these are the activities on which a firm should focus its internal operations. All non-essential services should then be outsourced.
The decision-making process related to outsourcing starts with an evaluation of what a firm 'will make', against what it 'will buy'. Managers should analyse the production process to decide which functions their staff will perform and which functions can be better, and more cost-effectively accomplished, by one or several suppliers. It is critical that the make-or-buy decision is based upon a calculation of total costs for any function, even if these costs are difficult to quantify.
To assess the costs and benefits of outsourcing a particular function, all of the related costs that accrue from the production or delivery of the goods or service in-house must be taken into account. As an outsourcing decision relates to future expenditures, the firm should compare the expected future costs associated with supplying the goods or service from within the organisation, with those of purchasing the goods or service externally. As part of this process, the liquidity and cash flow position of the firm should also be considered.
In addition, other financial questions should be asked about outsourcing a function:
- What is the level of the initial investment?
- What are the operational costs?
- How will outsourcing affect fixed and variable costs?
- Are there hidden additional costs, such as customs duties?
Outsourcing is not purely a quantitative or financial decision; there are also significant qualitative factors to be considered, which may prove more important:
- Is there a relationship of trust and loyalty between the firm and its outsourcing partners, which will allow information to be shared with confidence?
- Is the outsourcing partner reliable and has it a successful track record in terms of delivery, efficiency and management?
- How do the skills and practices of the two firms compare?
- Is the technology used in the product or the manufacturing process used throughout the industry, or is it proprietary?
Successful outsourcing can create significant long-term benefits and yield cost savings in both operations and distribution. However, there are dangers if the planning and research process is not conducted effectively. Having outsourced a function or activity, it may be difficult to re-establish that function within the organisation without incurring high additional costs.

Case study - Half Moon Bay police


Half Moon Bay police and recreation services
Read the articles Half Moon Bay to outsource its police services and City Council to Vote Saturday on Outsourcing Police, Recreation Services you can do this in the windows below or follow the previous links to read the articles in a separate window) and then answer the question below.

Evaluate the proposed outsourcing of the Half Moon Bay's police and recreation services.

5.7 Production planning - questions
In this section are a series of questions on the topic - Production planning. The questions may include various types of questions. For example:
- Self-test questions - on-screen questions that give immediate marking and feedback
- Short-answer questions - a series of short-answer questions to help you check your understanding of the topic
- Case study - a case study with associated questions
- In the news - questions based around a topical business news article
Click on the right arrow at the top or bottom of the page to work through the questions.
Production planning - short answer questions

Question 1
Identify the three categories of stock.
Question 2
Examine the stock control chart below, then answer the questions which follow.
Various points and levels are marked with the letters a to f.
Identify each of the points and explain their meaning.
Question 3
Explain how a firm determines its minimum stock level.
Question 4
Examine the reasons why firms hold stocks of finished goods.
Question 5
Distinguish between 'reorder level' and the 'reorder quantity'.
Question 6
Explain why the Economics Order Quantity (EOQ) differs from product to product.
Question 7
Using examples, explain why capacity utilisation is significant in the process of creating competitive advantage.
Question 8
Define the terms:
- Outsourcing
- Backshoring.
Question 9
Distinguish between just-in-time and just-in-case as stock management systems.
Question 10
Explain why multi-skilled employees are vital for the success of a just-in-time management system.

Stock control - numerical questions

You are advised to sketch the saw-toothed chart for this series of questions, and then follow each change and action on it.
Question 1
A firm holds stocks of car tyres for supply to the retail trade in its area. It is the main local agent for Synthetic Tyres of Japan. It aims to hold a minimum stock of 1,500 sets of tyres and a maximum holding of 10,500 sets. It expects to sell 3,000 sets each week. If it reorders tyres when its stocks fall to 7,500 what is the delivery time and quantity for tyres from the sole importer of Synthetic Tyres of Japan?
Question 2
After 4 weeks, when all activities were as planned, sales increase to 4,000 sets per week. What effect will this change have on the company at the end of the 6th week?
Question 3
Sales stay at 4,000 sets per week. What changes will the firm have to make at the stage of the next reorder to get its maximum stock level back on plan?
Question 4
What further changes does the firm need to make to get back to a minimum stock level of 1,500 sets of tyres?
Question 5
The firm has operated in this way for the last two cycles. First (a) list three possible effects on stocks and stock levels of the firm being able to reduce the delivery time of an order from 2 to 1 week then (b) fully explain one of them.

Outsourcing goes full circle

Is this a taste of the future? Outsourcing goes full circle as Indian firms look to the U.S. for cheap labour
Read the article Is this a taste of the future? Outsourcing goes full circle as Indian firms look to the U.S. for cheap labour (you can do this in the window below or follow the previous link to read the article in a separate window) and then answer the questions below.

Question 1
Define the terms:
- Emerging economy
- Turnover
Question 2
Explain the reasons why Indian firms, such as Tata and Wypro are outsourcing jobs to the US.
Question 3
Analyse whether low wage rates in call centres will always result in poorly motivated employees.
Question 4
Discuss the arguments for and against outsourcing and contracting compared with provision by the firm themselves.

5.8 Project management - notes (HL only)
In previous sections, we looked at production methods, costs and revenues, break-even analysis, quality assurance methods and then examined innovation and production planning.

By the end of this section you should be able to:
- Construct and interpret a network, identify the critical path, and calculate the free and total float
- Evaluate the value of a network in the management of projects
Project management - introduction

Project management is the process of organising complex activities and there are a number of tools that businesses use to help with this. In fact, project management is considered a skill in its own right and most reasonable sized businesses will have dedicated project managers. In this section we look in detail at one of these tools; critical path analysis (also known as a network diagram).

Critical path analysis

 We often hear in the media about large projects running late. If you think about it, this must mean there was a plan or target. You can only be late if you have a plan or a target.
Businesses need to schedule projects to ensure the optimum use of scarce resources. This is especially important if the project involves the use of external contractors and equipment.
CPA or critical path analysis helps plan complex projects to ensure the best use of machinery, people and materials. One very good method is CPA. CPA is also known as PERT (Project Evaluation and Review Technique), network planning or networking.
Critical path analysis is a method of modelling a project so that:
- Its logical route to completion can be established.
- The key or CRITICAL jobs (ACTIVITIES) can be identified.
- The time to complete the project can be estimated.
- The progress of the project to completion can be effectively managed, and remedial work can be planned as necessary.
This is done by preparing a fully timed NETWORK DIAGRAM.
The use of networks can be expanded to the evaluation and control of all project resources, such as materials, plant, skilled and unskilled labour, as well as capital expenditure and cash flow.

Critical Path Analysis (CPA)
CPA is a network planning technique used particularly in project management to identify the activities within a project that are critical for its success. A critical path is identified from a project diagram or flow chart, showing the sequence in which activities must be completed to minimise the duration and cost of the project.
There is some confusion, not to say competition, over its invention or birth. CPA was probably invented in the 1940s or 1950s by major US and British companies at approximately the same time. It was definitely used by the US Government to control the development of the Polaris submarine system and by Boeing for the introduction of the 747 'Jumbo jet'.
We will now jump in at the deep end. CPA is one of those techniques, like riding a bicycle, where it is best to try and do it, rather than talk about it! Firstly, we need to examine some basics about the planning process.

Critical path analysis - The rules and methodology

Learning CPA is like learning a new board game. It has rules, which once learned allow the planning of any project. CPA is normally prepared by a project team controlled by a Project Manager or Director who will be an expert in CPA techniques. As you will appreciate later, CPA is really a management philosophy and so needs skilled dedicated staff.
What are the functions of the team? On the following pages we work through the various stages of developing a critical path analysis diagram.
CPA Stage 1 The data collection
The team will:
- identify all the activities needed for the project's completion. You will not be required to do this in this course, or in the examination, as the nature of the activities and their duration will be provided or you will be given a complete network and asked to manipulate it. This is probably the most important part of CPA, the collection of the data.
- identify the dependencies, if any, between activities - in other words which activities must be completed, before other activities can start. Again, you will be given this information.
Imagine you are making a cup of tea. Some activities need to be done CONSECUTIVELY, i.e. one after the other. Clearly it wouldn't be sensible to pour hot water onto the tea bag until it is in a cup! An activity that follows another is said to be consecutive; it depends on the previous activity being complete before it can start. For example a roof cannot be put on a building until the walls are finished.
However, some activities do not rely on others; they can be done whilst others activities are in progress, e.g. you can get the cup out of the cupboard, whilst the kettle is boiling. These activities can run CONCURRENTLY (together).
It is important to know whether activities are consecutive or concurrent, as this affects the duration of the project and planning of the resource use.

A judge sentences a criminal to a three-year sentence for burglary, and a four-year
term for violence. These are to run consecutively. He is also sentenced to two years
prison for another burglary, which is to run concurrently. How many years in total
will the criminal serve?
CPA Stage 2 The draft network diagram
Activities
A network is made up of combination of activities, represented by arrows.
| ACTIVITY | = | an Arrow |
| START of the ACTIVITY | = | Tail of the arrow |
| FINISH of the ACTIVITY | = | Head of the arrow activity |

The length of the arrow is not related to the time of the activity.
Activities are usually represented in the diagram by a letter, e.g. activity A.
Events or nodes
Beginnings and ends of activities are represented as numbered circles called NODES.These are not related to time or resources. As we will see later these nodes contain information crucial for the project:
- The number of the activity
- The earliest time when the following activity can start
- The latest time that the previous activity can finish.
We will return to these later in this section.

Let's provide an illustration of a project where a firm is planning to test market of a particular new product. It has identified the activities and dependencies as follows:
Example 1: Hatfield Cosmetics - the test market
| Activity | Description | Preceding activity | Duration (days) |
|---|---|---|---|
| A | Decide test market area | None | 1 |
| B | Agree marketing strategy | None | 2 |
| C | Agree product specification | None | 3 |
| D | Decide brand name | B | 1 |
| E | Prepare advertising plan | A | 2 |
| F | Agree advertising package | E | 3 |
| G | Design packaging | D | 2 |
| H | Production of test batch | C | 5 |
| I | Pack and distribute | G, H | 10 |
| J | Monitor media support | F, D | 3 |
The first task is to produce a sketch, or 1st draft of the logic diagram. The important thing is to get all the dependencies shown above correctly reproduced in the diagram.
Figure 1 Draft CPA diagram
Note: The lines represent the activities. The description, or title of the activity, is usually written above the line, and its duration beneath, although this is not crucial. Often it depends on space.
The following introduces and illustrates a number of rules and problems.
Rule 1 - a network must start and end with a single node. This is not the case in the sketch above, so it will have to be adjusted. Just join up the loose ends! The new version is shown in figure 2 below.
Figure 2 Draft CPA diagram - version 2
We will have to tidy up the nodes and activities later and remove any that are unnecessary.
Before moving to the next stage, let's examine all the possible dependencies in a diagram and explain what they mean. Follow the link below or click on the screenshot for an explanation of logic diagrams. The presentation will open in a new window.
Logic diagrams
N.B. You will need a set of speakers or headset to hear the explanation.
Rule 2 - dummy activity. These are marked as dotted lines and have no time duration, but show a dependency. They are used in a number of specific situations:
(a) When two activities start and finish at the same nodes. In this case the dummy enables both activities to be represented separately without losing the logic of necessary dependencies. No two activities are allowed to have both the same starts and the same ends.
See figure 3 below.
Figure 3 Dummy activities
(b) To clear dependency problems and retain the logic of a network.
A dummy activity is used to maintain the logic of a network. A dummy activity uses NO resources and takes NO time.
It is represented by a dotted arrow
![]()

Consider the situation where you are given the following information about dependencies:
| Activity | precedes | Activity |
|---|---|---|
| A | C | |
| A B | D |
The only way to represent this in a conventional form is:
The problem is that this is incorrect. True activity A comes before activities C and D, but the diagram shows that activity C also needs activities A and B to be completed before it can begin, which is not correct. C only requires activity A to be finished.
Solution
A dummy activity is inserted to overcome the problem.
1. Draw the logic networks to represent the four different activities - i.e. ignore the duplicated activity when it is paired: in this case activity A
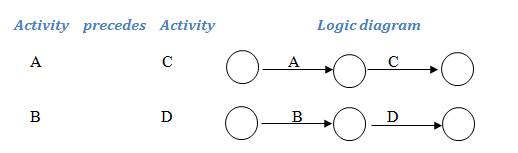
2: Use a dummy activity to join the two diagrams to produce the correct answer:
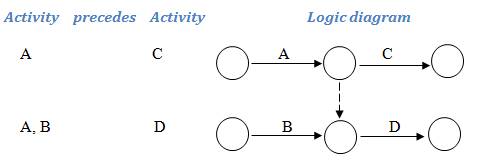

The direction of the arrow-head can be decided by thinking of rivers flowing and coalescing. Water flows from river A into both C and D, but water from B only flows into D - it cannot flow upstream into C.
Therefore, activity A flows into activities C and D. Activity B can only flow into activity D as up the dummy head points downwards. This satisfies the desired logic:
| Activity | precedes | Activity |
| A | C | |
| A B | D |
Activities A and B now operate in parallel; they are concurrent activities. Activity C follows only activity A, so can begin when A is finished, even if activity B is not complete. However, activity D follows activities A and B and cannot begin until both are finished.

Examiner's advice
You can recognise a dummy by the following rule:
You must construct a dummy when an activity precedes two different activities, but in only one case is it also linked with another activity.

Spot the Dummy!
You are provided with the following information on which you asked to construct a network diagram:
| Activity | precedes | Activity |
|---|---|---|
| A | B | |
| A | C | |
| B | D | |
| C | E | |
| D E | F | |
| D E | G | |
| F | H | |
| G H | I | |
| H | K | |
| I | J | |
| J | L | |
| K | L |
Have you spotted the dummy and know why? Follow the link below to check your understanding and logic:
Have you spotted the dummy?

Try drawing the entire network for this starting with individual logic diagrams.
In summary, the dummy is used as to maintain the correct logic in a set of dependencies, but does not create an additional activity. Remember that dummy activities take no time and use no resources:
Figure 4 Dummy activities

A dummy activity - Check your understanding
Explain the logic of the two diagrams above and how they differ.
CPA Stage 3 - tidying and simplifying
Tidy and simplify the diagram. Lines should be horizontal or slope forwards, showing that later activities follow on.

It is common when first drawing a network to accidentally add extra activities that should not be there. Check that all of your activities have a letter - except a dummy activity. Getting rid of these activities normally needs one activity line to be extended or moved diagonally.
Adding information to the nodes
A node is normally split into three sections
Figure 5 Network nodes
Part 1 - the identity number
Part 2 - the earliest start/finish
Part 3 - the latest start/finish.
The tidied logic diagram therefore looks like this. However, we will need to add more information to each of the nodes. The node numbers usually begin with 0 or 1.
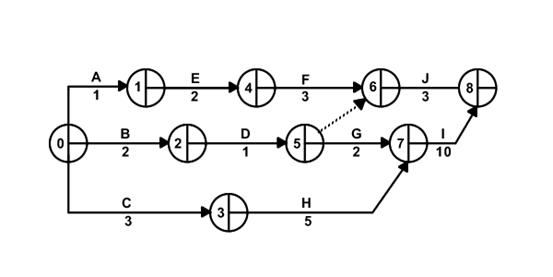
Figure 6: tidy logic diagram
Real projects will often involve hundreds of activities, and are usually managed using computer simulations.

Examiner advice
Our diagrams are quite small so they fit neatly onto the page of your notes. When you are working on a CPA, however, make the diagram as large as you can as this prevents mistakes resulting from misreading of numbers. It also allows you to add information to the nodes that are clear to you and the examiner! You may even choose to turn the page sideways if it is a complicated diagram.
CPA Stage 4 - Earliest starting time (EST)
Add the earliest starting time (EST) to all the nodes on the network
To see how to add the earliest starting time, follow the link below or click on the screenshot. The presentation will open in a new window.
Earliest starting time
N.B. You will need a set of speakers or headset to hear the explanation.

CPA Stage 5 - Add the Latest finishing time (LFT)
Stage 5 - Add the latest finishing time (LFT) to all the nodes on the network
To see how to add the earliest starting time, follow the link below or click on the screenshot. The presentation will open in a new window.
Latest finishing time
N.B. You will need a set of speakers or headset to hear the explanation.

CPA Stage 6 - Identify the CRITICAL PATH
Critical activities are ones that have no free time - they must start and finish when they are planned. There cannot be delays on these activities or the entire project will be late. The critical path is the chain of critical activities which will be found winding its way through the network.
There is a three-point test to see if an activity is critical.
Test 1 - the earliest and latest start times are the same,
Test 2 - the earliest and latest finish times are the same,
Test 3 - start time + duration = finish time (there is no float).
Only if all three tests are met will the activity be critical. Beware of the activity that passes tests 1 and 2 but fails test 3.
Mark the path in some way on the diagram. In figure 8 below, we have marked the path with a series of double lines to make it very clear. In your diagram you only need to mark critical activities with a single set of double lines
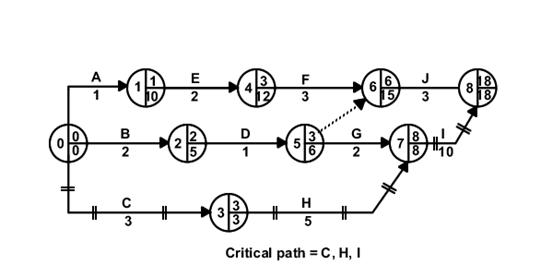
Figure 8 Completed network diagram with critical path
Figure 9 gives a reminder of the key to the diagram. If asked to draw one, it is always worth providing a key as well.
Key:
Figure 9 Network diagram key
Stage 7 - CHECK IT
So, we now have a plan for our project and know that it should take 18 weeks, and that the critical activities, in time order are C, H and I.

Use of networks

Network planning is an efficient and effective way of
- Planning
- Scheduling and
- Controlling
Complex projects, in fact especially complex projects, may require the use of CPA. A rule of thumb is that if you can control the project by hand you probably do not need CPA. If you have to use a computer, then CPA is just the thing!
It provides a useful way of breaking down complex projects into easily understandable stages. It helps identify the fastest time in which a project can be completed. It can be used to establish priorities and to allocate resources.
It is especially useful as a means of controlling a project during its execution, and devising plans to overcome difficulties and allocate resources.
It can be used to put all activities into priority order, not just the critical ones. This is important when it comes to progress review meetings. This priority setting is done through a process known as float analysis.

Float analysis

A float is a measure of the spare time within a project.
Two types of float exist:
- Total float
- Free float

Total float
The total float measures the spare time available on a single activity without delaying the project as a whole.
Free float
The free float measures the spare time available on a single activity, so that there is no delay on the start of the following activity, i.e. it does not delay the EST of the following activity. This float is a stricter requirement than total float. The free float will never exceed the total float.

Critical activities have no float, because they have no spare time.
Calculation of float times
The formulae for calculating the float times are as follows:
Total float:
Latest finishing time (this activity) - (Earliest starting time (this activity) + Duration (this activity))
TF = LFT - (EST + D)
For activity F
TF = 15 - (3 + 3) = 9 days
Free float:
Earliest starting time (next activity) - Duration (next activity) - Earliest starting time (this activity)
FF = EST (next) - D (next) - EST (this)
For activity F
FF = 6 - 3 - 3 = 0 days
Free and total float formulas are illustrated below.
Figure 10 Free and total float times
Float should be passed on to the next activity whenever it can be. This is why CPA is a management philosophy as well as a planning tool. It encourages teamwork, helping others, and generates and requires a positive and open approach to problem solving.
Results are usually tabulated. Remember, critical activities have no float at all.
The following is the float analysis chart for the test market project. Make sure you are clear about how all the floats are calculated.
| Activity | Start | Time | Finish | Float | |||
|---|---|---|---|---|---|---|---|
| Earliest | Latest | Earliest | Latest | Total | Free | ||
| A | 0 | 0 | 1 | 1 | 10 | 9 | 0 |
| B | 0 | 0 | 2 | 2 | 5 | 3 | 0 |
| C | 0 | 0 | 3 | 3 | 3 | 0 | 0 |
| D | 2 | 5 | 1 | 3 | 6 | 3 | 0 |
| E | 1 | 10 | 2 | 3 | 12 | 9 | 0 |
| F | 3 | 12 | 3 | 6 | 15 | 9 | 0 |
| G | 3 | 6 | 2 | 8 | 8 | 3 | 3 |
| H | 3 | 3 | 5 | 8 | 8 | 0 | 0 |
| I | 8 | 8 | 10 | 18 | 18 | 0 | 0 |
| J | 6 | 15 | 3 | 18 | 18 | 9 | 9 |
What does this table tell us about the priority we should give to activities? Which one is more important than others?
It is clear that the critical activities are C, H and I and should take priority. What about the rest?
Let's examine the total float first. There are 2 figures in the chart:
3 - activities B, D and G - a chain:
All three have the same 3 days float. If B uses it up, then D and G have nothing.
The aim is to pass on float, to work as a team and to cooperate. It is not a competition.
9 - Activities A, E, F and J - another chain.
Again this is the same float which is passed on to the next activity in the chain.
Now for the free float. This exists only with activities G and J, at the end of chains. If it gets to them, they can do what they like with it. They have nowhere to pass it to.
The priorities? B, D and G are sub-critical by 3 days and A, E, F and J by 9 days. So:
- 1st priority - critical activities - C, H and I
- 2nd priority - activities B, D and G
- 3rd priority - activities A, E, F and J.
This would be the agenda, in effect, at all project review and planning meetings.
What if there is a delay on a critical activity?
The project manager will identify critical activities from the network diagram. If there is a delay on any of these, the whole project will also be delayed. This may have serious consequences. Many contracts for projects contain penalty clauses, should the project be delayed - road repairs are a prime example. The project manager has a number of choices to prevent the delay on the entire project.
Firstly, he or she can look to see if there is any spare capacity. For instance, if there is a float on another activity, employees working on this may be transferred from this activity to the delayed critical activity to bring it back on track. Of course, there may be a flaw here, since these 'spare' employees may not have suitable skills. For example the manager should not use plumbers to install electrics - it is likely to be dangerous and against the law! The same will go for other resources, such as idle machinery.
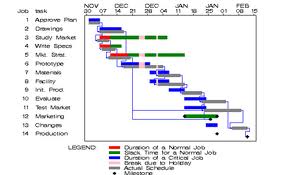 Alternatively, the project manager could persuade existing employees to work longer hours or could hire new staff on a temporary basis to rectify the problem. Again, these are far from perfect as both options carry additional cost, which may result in the project going over budget. Indeed, the project manager may decide it is cheaper to incur the penalty charge.
Whatever the option taken, at least the planning process using CPA allows a potential problem to be identified at an early stage, offering the possibility of corrective action.
Many project managers use additional visual tools to monitor projects. One particularly useful tool is Gannt Chart, a form of bar chart, which provides a visual representation of progress on every activity. Unlike CPA, however, dependencies between activities are not easy to recognise.

Evaluation of networks

Advantages
- CPA provides a visual representation of a project, which makes it simpler to interpret.
- Drawing up a CPA requires careful analysis of the project, the resources required and the timings of activities, which should help the project to run smoothly. Forward planning should identify potential problems.
- CPA encourages teamwork and consultation, especially if employees are consulted in the process of identifying durations and resource requirements for the various activities.
- Identifying activities that can be run simultaneously, shortens the duration of the project and minimises costs, allowing a more competitive bid to be made if a project is offered for tender.
- The project manager can identify resource requirements in advance of the project start and ensure they are available when they are required, but not before or later. Daily charges for large pieces of equipment such as cranes can be very expensive so hire periods need to be minimised, by linking the hire to the EST of the activities where equipment is required.
- Network diagrams can include skills groups to allow for better flexibility in planning. So where spare capacity exists, the project manager knows the skills these employees have.
- The management of a project using CPA should allow the financial and cash implications to be more clearly identified and it also promotes clarity in stock control and the use of just-in-time methods.
- The sequential and quantitative nature of the CP process is very suited to computer operations.
Disadvantages
- It is an expensive and time-consuming procedure as it involves the time of highly skilled personnel.
- Complex projects may be difficult to represent visually and can make the process unmanageable and pointless.
- It requires trained staff to manage it effectively, which adds to the cost of the project and must be built into any bidding process.
- Drawing the network diagram does not ensure effective management of the process, nor does the plan necessarily accurately represent the actual project and its progress. The diagram is only as good as the data that is used to prepare it - as they say in computing; 'Garbage In, Garbage Out'.
- The network is drawn up using quantitative data; qualitative factors such as motivation are not considered directly in the process, although durations may reflect this.
- All staff that will come in contact with it, or its consequences, needs to understand the method, its philosophy and its use.

Example - A simple project network

Let's look at another fully worked example:
Example 2: A simple project network
Stage 1 Activity list
| Activity | Dependency | Duration (days) |
|---|---|---|
| A | Start | 1 |
| B | Follows A | 2 |
| C | Follows A | 1 |
| D | Follows B | 3 |
| E | Follows B and C | 1 |
| F | Follows E | 1 |
| G | Follows D and F | 2 |
Stage 2 Draft logic diagram
Try drawing the draft logic diagram - is there a dummy? When you have prepared your diagram, follow the link below to see if it corresponds with ours.
Draft logic diagram - answer
Stage 3 Completed network, time and calculated.
Complete the network diagram showing durations and EST/LFT and, when you have completed the diagram, follow the link below to check your answer.
Network diagram - answer
Stage 4 Critical path
Now add the critical path to complete the network diagram and follow the link below to check your answer.
Critical path - answer
Stage 5 Float analysis
Prepare a table showing the free float and total float for the project. Once you have had completed this, follow the link below and see how you got on.
Free and total float - answer

Use of CPA diagrams

What are CPA charts used for? Look at the title again, especially PERT (Project Evaluation and Review Technique). CPA is used for:
- Planning, and then
- Control (checking performance)
of complex projects.
The plan should be reviewed regularly, and the actual performance compared with the plan (this is variance analysis again). If there are problems, then the team should work out solutions. Staff on non-critical activities may help out on critical ones that are drifting late (provided, of course, they have the requisite skills).
CPA can go beyond the obvious platform of time control. As a management philosophy it immediately has implications for efficiency, and allows construction/project type firms to be effective and profitable. It can help considerably in decision making in the area of resource planning, including capital and revenue expenditure forecasting and planning.
This will be true if, at the time of collecting the time estimates, managers are also required to estimate the following:
- Staff needs - supervisors, fitters, riggers, electricians etc.
- Plant needs - cranes, hoists, drill, welding sets etc.
- Capital needs - cost of items in that activity
- Revenue expenses - estimate of daily payroll and materials payments

5.8 Project management - questions (HL only)

In this section are a series of questions on the topic - Project management. The questions may include various types of questions. For example:
- Self-test questions - on-screen questions that give immediate marking and feedback
- Short-answer questions - a series of short-answer questions to help you check your understanding of the topic
- Case study - a case study with associated questions
- In the news - questions based around a topical business news article
Click on the right arrow at the top or bottom of the page to work through the questions.

Critical path analysis - short answer questions


Question 1
Explain the nature and purpose of a dummy activity.
Question 2
Explain the difference between free and total float and how these can be used by a project manager.
Question 3
Outline how the earliest start and finishing times for an activity in a network are calculated.
Question 4
Explain why the term PERT is more meaningful as a management process than using the term critical path analysis.
Question 5
Analyse the advantages and disadvantages of using CPA to monitor and control a construction project.

Critical path analysis - numerical questions


Question 1
Construct the network for the following project:
Activities:
A is the first activity in the project
B starts when A is complete
C follows B
D starts at the same time as B
E follows all other jobs.
Number the nodes, starting at one.
Using the following activity timings, add the EST and LFT for each node and determine the critical path for this project.
| Activity | A | B | C | D | E |
|---|---|---|---|---|---|
| Duration (days) | 2 | 5 | 3 | 2 | 6 |
Ensure you title your diagram and add a key.
Question 2
Draw a network using the following information:
Activities:
A is the start of the project
B and E can start when A is complete
C follows B
F and G can start when E is complete
D cannot start before C and F are complete and must finish before J can start
J also depends on the completion of G before it can start.
- Number the nodes, starting at one.
- Using the activity timings below, add the EST and LFT for each node.
- Calculate the free and total floats for the project and identify the critical path through the diagram.
| Activity | A | B | C | D | E | F | G | J |
|---|---|---|---|---|---|---|---|---|
| Duration (days) | 1 | 3 | 3 | 6 | 4 | 3 | 5 | 2 |
Ensure you title your diagram and add a key.
Question 3

Not all networks have the alphabetical order you may expect - you will have to make the logic relationships work by moving some of the activities around!
Construct a network diagram from the following information:
Activities:
| Activity | Precedes | Activity |
|---|---|---|
| A | B | |
| A | C | |
| A | D | |
| B | E | |
| C | G | |
| D & E | F | |
| F & H | K | |
| G | H | |
| G | J | |
| J | L | |
| K & L | M |
- Number the nodes, starting at one.
- Using the activity timings below, add the EST and LFT for each node.
- Calculate the free and total floats for the project and identify the critical path through the diagram.
| Activity | A | B | C | D | E | F | G | H | J | K | L | M |
|---|---|---|---|---|---|---|---|---|---|---|---|---|
| Duration (days) | 2 | 6 | 10 | 11 | 9 | 6 | 8 | 5 | 4 | 6 | 4 | 3 |
Ensure you title your diagram and add a key.
