Applications of demand and supply
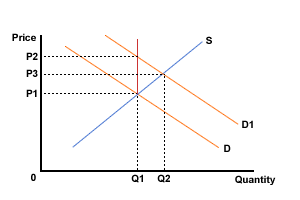
Markets rarely react fast, so it takes time for the market to regain equilibrium after it has experienced a change (known as a shock). Examine Figure 1, which shows the effect of an increase in demand on the market for new houses in an area. Assume that a major, large government department has just announced that it is to relocate to this area.

NB. the S on the vertical supply is missing - diagrams MUST be fully labelled, also the excess demand is not i shown where is it on the diagram?
Figure 1 The market for new houses
The initial market was defined by
demand curve D and supply curve S. The market was in equilibrium at
price P1 when Q1 new houses were bought and sold. The entry of the
government department will increase demand and shift the demand curve
to D1. Supply will take time to react so price will rise initially to
P2, then fall back slowly to P3 as the supply of houses increases. It
will move from one equilibrium position, P1Q1, to another, P3Q2, over a
period of time. It will pass through P2Q1 on the way. NB How the
diagram is uased to explain the changes and their effects.
Further examples are the markets for drugs or alcohol. Suppose the police were to really crack down on drug dealing, with considerable but not perfect effect. What would happen?
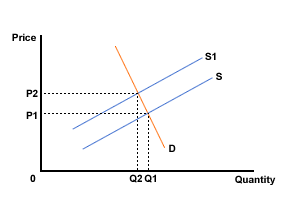
The US Government once tried to ban the sale, and hence consumption, of alcohol in America, but with only partial success. What happened here? Look at Figure 2.

Figure 2 The drug or alcohol market
In both cases the measures had no effect on demand, but reduced supply. So price would go up because the quantity available would fall.
For the drugs, the street price would be an indication of the success of the police. The greater the rise, the greater the degree of success.
