Topic pack - Microeconomics - introduction
Welcome to this Triple A Learning topic pack for Microeconomics. The pack has a wide range of materials including notes, questions, activities and simulations.

A few words about Navigation
So that you can move to the next page in these notes more easily, each page has navigation tools in a bar at the top and the bottom. These tools are shown below.
![]() The right arrow at the top or bottom of the page will take you to the next page of content.
The right arrow at the top or bottom of the page will take you to the next page of content.
![]() The left arrow at the top or bottom of the page will take you to the previous page.
The left arrow at the top or bottom of the page will take you to the previous page.
![]() The home button will take you back to the table of contents for the pack.
The home button will take you back to the table of contents for the pack.
The pack is split into a series of sections and to access each section, the easiest way is to use the table of contents on the left-hand side of the page. To return to the full table of contents, please click on the 'home button' at any stage.
Higher level extension material
Some of the material in this pack relates to the higher level extension topics in the Business and Management guide. This material is marked by icons as follows:

This icon indicates the start of the higher level extension material.

This icon indicates either:
- The higher level extension material continues on the next page or
- The higher level extension material continues from the previous page

This icon indicates the end of the higher level extension material.
To start viewing the contents of the pack, please click on the right arrow at the top or bottom of the page.
Key terms - competitive markets
One of the key things you need to be sure to know are the definitions of all key microeconomics terms. In this section we give you explanations and definitions of terms relevant to competitive markets.

If you would prefer to view this interaction in a new web window, then please follow the link below:
Key terms - elasticity
One of the key things you need to be sure to know are the definitions of all key microeconomics terms. In this section we give you explanations and definitions of terms relevant to elasticity.

If you would prefer to view this interaction in a new web window, then please follow the link below:
Key terms - government intervention
One of the key things you need to be sure to know are the definitions of all key microeconomics terms. In this section we give you explanations and definitions of terms relevant to government intervention.

If you would prefer to view this interaction in a new web window, then please follow the link below:
Key terms - market failure
One of the key things you need to be sure to know are the definitions of all key microeconomics terms. In this section we give you explanations and definitions of terms relevant to market failure.

If you would prefer to view this interaction in a new web window, then please follow the link below:
Key terms - theory of firm

One of the key things you need to be sure to know are the definitions of all key microeconomics terms. In this section we give you explanations and definitions of terms relevant to theory of the firm.

If you would prefer to view this interaction in a new web window, then please follow the link below:
Aims of the economics course

The aims of the economics course at HL and SL are to enable students to:
- develop an understanding of microeconomic and macroeconomic theories and concepts and their real-world application
- develop an appreciation of the impact on individuals and societies of economic interactions between nations
- develop an awareness of development issues facing nations as they undergo the process of change.
Assessment Objectives
Having followed the economics course at HL or SL, students will be expected to:
- AO1 Demonstrate knowledge and understanding of specified content
- Demonstrate knowledge and understanding of the common SL/HL syllabus
- Demonstrate knowledge and understanding of current economic issues and data
- At HL only: Demonstrate knowledge and understanding of the higher level extension topics
- AO2 Demonstrate application and analysis of knowledge and understanding
- Apply economic concepts and theories to real-world situations
- Identify and interpret economic data
- Demonstrate the extent to which economic information is used effectively in particular contexts
- At HL only: Demonstrate application and analysis of the extension topics
- AO3 Demonstrate synthesis and evaluation
- Examine economic concepts and theories
- Use economic concepts and examples to construct and present an argument
- Discuss and evaluate economic information and theories
- At HL only: Demonstrate economic synthesis and evaluation of the extension topics
- AO4 Select, use and apply a variety of appropriate skills and techniques
- Produce well-structured written material, using appropriate economic terminology, within specified time limits
- Use correctly labelled diagrams to help explain economic concepts and theories
- Select, interpret and analyse appropriate extracts from the news media
- Interpret appropriate data sets
- At HL only: Use quantitative techniques to identify, explain and analyse economic relationships
Section One Structure
Unit one has four core sub-topics and one HL extension.
1.1 Competitive Markets: Demand and Supply

By the end of this section you should be able to:
- Outline the meaning of the term market.
- Explain the negative causal relationship between price and quantity demanded.
- Describe the relationship between an individual consumer's demand and market demand.
- Explain that a demand curve represents the relationship between the price and the quantity demanded of a product, ceteris paribus.
- Draw a demand curve.
- Explain how factors including changes in income (in the cases of normal and inferior goods), preferences, prices of related goods (in the cases of substitutes and complements) and demographic changes may change demand.
- Distinguish between movements along the demand curve and shifts of the demand curve.
- Draw diagrams to show the difference between movements along the demand curve and shifts of the demand curve.
- Explain the positive causal relationship between price and quantity supplied.
- Describe the relationship between an individual producer's supply and market supply.
- Explain that a supply curve represents the relationship between the price and the quantity supplied of a product, ceteris paribus.
- Draw a supply curve.
- Explain how factors including changes in costs of factors of production (land, labour, capital and entrepreneurship), technology, prices of related goods (joint/competitive supply), expectations, indirect taxes and subsidies and the number of firms in the market can change supply.
- Distinguish between movements along the supply curve and shifts of the supply curve.
- Construct diagrams to show the difference between movements along the supply curve and shifts of the supply curve.

- Explain and plot a demand curve from a linear function
- Identify the slope of the demand curve as the slope of the demand function
- Outline why, if the "a" term changes, there will be a shift of the demand curve.
- Outline how a change in "b" affects the steepness of the demand curve
- Explain and plot a supply curve from a linear function
- Identify the slope of the supply curve as the slope of the supply function
- Outline why, if the "c" term changes, there will be a shift of the supply curve.
- Outline how a change in "d" affects the steepness of the supply curve.
1.1 Competitive Markets: Demand and Supply - notes
Introduction
 Resources are allocated in competitive (free) markets through the workings of the price mechanism. Price changes give signals to suppliers who are able to respond to the demands of consumers. If the price of vegetables rises, for instance, more farmers will want to grow and sell (supply) vegetables. Also, if more people want to buy vegetables (demand) in an area, say as a result of increased population, prices will rise.
Two key terms have been mentioned, supply and demand. Write down now, before you go any further, what you think these terms mean. Put your descriptions to one side. We will return to them later.
The free market price mechanism, operating under certain specific conditions (more of this later) is also the base against which the workings of real markets and economies are measured by economists.
In this section we consider the following topics in detail:
- Markets and market structure (this is covered in detail by HL students in section 1.5)
- Market structure
- The importance of price as a signal
- Demand
- Supply
- Interaction of demand and supply
- Price controls
This unit examines the concepts of demand and supply in detail, then goes on to examine the operation of a competitive market. It is an extremely important unit, not only in its own right, but also because it links in with other units, such as units 3 (International Economics) and 4 (Development Economics).
The nature of markets
So, what is a market?

Market
A market is any effective arrangement for bringing buyers and sellers together, not necessarily face-to-face, to enable trade to take place.
The forces of supply and demand meet and react in a market. Prices are established and buyers and sellers alike give signals. Markets can involve face-to-face dealings between buyers and sellers, or may be postal or even electronic.
The market mechanism brings together two different forces, the power of the consumer and the interests of the supplier. Both want 'the best' from the market, but their 'bests' are different.
Objectives of consumers
Rational consumers want to get the most from their money and a RATIONAL CONSUMER wants the highest quality at the lowest price.
Objectives of producers
Firms want to get the maximum from the resources that they use. In financial terms they want to maximise profit. This means that they may want to sell as low a quality product as they can for as high a price as possible.
The general assumption of economics is that the main objective of private businesses is profit maximisation.
Types of markets
If you would prefer to view this interaction in a new web window, then please follow the link below:
Market structure
 In a competitive market, firms are expected to compete. We have assumed so far in our market model that firms compete on price only. This is not the case in the real world. Firms may compete on the basis of:
- Quality
- Service
- Reputation
as well as price.
The world of competition can be fierce and dynamic. Highly competitive firms continually try to improve their position in the market by producing better, more reliable goods and services, to ensure that they are providing products that are better than their rivals, for example. They ultimately want to increase their profit. They will look at their production processes and may try to reduce costs and to increase revenues.
They will only do this if they can get something from it, and that something is profit. Unless there is a financial return they will not invest in any improvements. Why should they?
Spectrum of competition
If you would prefer to view this interaction in a new web window, then please follow the link below:
You may also like to see a table summarising each of these key market structures with examples. Don't worry too much about the column headed 'Demand curve for firm' as this will be fully explained in the study of demand.
Summary of market types
Demand
A detailed understanding of demand theory is essential for success in economics.

Demand
Demand is that quantity of a good or service that consumers are willing and able to buy at each and every price in a given period of time.
This means that demand combines:
- The desire for a product
- A willingness to pay for it
- The ability to pay for it
This definition is important. The demand for something has to be what is known as effective demand. This means that the demand has to be backed by a willingness AND ability to pay. You might want to buy a Lamborghini car, but only if you are willing and able to pay for it can the demand be regarded as effective.
The law of demand
If you would prefer to view this interaction in a new web window, then please follow the link below:
Individual and market demand
If you would prefer to view this interaction in a new web window, then please follow the link below:
Non-price determinants of demand
If you would prefer to view this interaction in a new web window, then please follow the link below:
Movements along the demand curve
If you would prefer to view this interaction in a new web window, then please follow the link below:

The demand curve is drawn on the assumption that only price has changed and everything else has remained the same. This is an important assumption to note. In reality many factors are changing at the same time, but if we are to analyse the factors causing a change in the market, we first need to isolate each of the factors. This assumption, known as 'ceteris paribus' or 'other things being equal' enables us to do this.
Shifts in the demand curve
If you would prefer to view this interaction in a new web window, then please follow the link below:

The demand curve is drawn on the assumption that only price has changed and everything else has remained the same. This is an important assumption to note. In reality many factors are changing at the same time, but if we are to analyse the factors causing a change in the market, we first need to isolate each of the factors. This assumption, known as 'ceteris paribus' or 'other things being equal' enables us to do this.
Summary
Having completed this session you should know and understand that:
1. Effective demand is the quantity of a good that would be bought at each and every price over a period of time.
2. It combines the desire for the good with an ability and willingness to pay for it.
3. Demand has several determinants, e.g. own price, price of other goods, real income, changes in tastes and fashion, season and population.
4. A change in price results in a movement along an existing demand curve.
5. A change in any other factor, apart from price, will cause the entire demand curve to shift.
Example - shifts and movements along a demand curve
You must be absolutely certain about what causes shifts and movements along a demand curve. Work carefully through the following example.

Example 1 - Movements along and shifts of demand curve
The diagram below, Figure 1, represents the demand for a product at a point in time. The price then was P*.
Figure 1 Demand curve
Copy this onto another piece of paper, then sketch on this new diagram the effect of the following changes. Treat each change as a separate change - in other words start each time from Figure 1. Once you have had a go at each one then follow the link below to check you got the change right.
(a) The firm launches a new, effective advertising campaign.
Answer - change (a)
(b) The market price of the product rises to P2.
Answer - change (b)
(c) The price of a substitute good is reduced.
Answer - part (c)
(d) The price of a good falls from P1 to P2.
Answer - part (d)
(e) The real incomes of the buyers of this desirable product increase significantly.
Answer - part (e)
(f) There is an increase in the population size and the size of the potential market.
Answer - part (f)
These should not be difficult if you keep calm. Ask yourself three questions:
- Has a 'ceteris paribus' factor (or another determinant of demand other than the price of the good itself) changed? If the answer is yes, then there is a shift.
- Will demand increase or decrease? This will determine if the shift is to the right or left?
- If the price has changed, will there be an extension or contraction of demand?
Exceptions to the normal law of demand
We have assumed so far that demand curves slope downwards from left to right, and most of the time this is true. However, there are a few circumstances where it is possible for the demand curve to slope upwards to the right. This may be for the whole curve or, more likely, it may be over a certain price range, as shown in Figure 1. This is often termed a perverse or upward sloping demand curve.
Figure 1 Perverse demand curve
There are two particular types of goods where this may occur and they are called Giffen goods and Veblen goods. Let's look at the definitions of these.

Giffen good
A Giffen good is a good for which an increase in price results in an increase in demand for the good. It is an extreme inferior good and will have a perverse (i.e. upward sloping) demand curve.

Veblen good
A Veblen good (named after an American economist - Thorstein Bunde Veblen) is a good that has an upward-sloping demand curve. People buy more of the good because it is more expensive and therefore demand is higher when the price is higher.
Giffen goods
In some poor countries, the people often live on a basic diet of rice which is very cheap plus a few more expensive vegetables or some much more expensive meat or fish. In such societies, if the price of rice rises then the people may well decide to buy more in order to substitute it for the more expensive vegetables and meat. There has been an increase in demand in response to an increase in price. Sir Robert Giffen fist noticed this phenomenon. In the 19th century, he saw that the demand for potatoes increased in response to the rises in the price of potatoes caused by the great potato famines in Ireland. Hence products of this kind are known as Giffen goods. Examples of Giffen goods are difficult to find in richer countries.
Veblen goods
Products such as perfumes, expensive cars, jewellery, works of art and designer clothes may be regarded as Veblen goods. With these products, a rise in price is often interpreted by the consumer as an increase in quality or ostentation and so they may decide to buy more, thinking that they are buying a superior product. There may be psychological factors at work. The economist Veblen carried out research into this and concluded that the price of a product conveyed more than just value information for the consumer; it also represented status and exclusivity. These products which appear to experience rising demand with rising price are known as Veblen goods.
The demand curve for such goods will slope upwards from left to right.
Price expectations
It is also possible for goods where price expectations are critical to have perverse demand curves. This is because if people expect prices to increase further, then they may buy more now. In this case it appears that an increase in price has increased demand, but in reality this has come about because people expect prices to rise even further in the future.
Linear demand functions


For higher level, you need to be able to understand linear demand functions and to be able to calculate demand and plot a demand curve from a demand function. The presentation below goes through this. Click on the screenshot or link below to open the presentation. It will open in a new web window. You will need a headset or speakers to listen to the explanation.
Linear demand functions

Linear demand functions - example


Assume a linear demand function of the form:
Qd = 100 - 8P
Using this demand function, answer the following questions. Once you have had a go at the questions, follow the link below to compare your answers.
- Calculate the quantity demanded for prices from $0 - $10.
- Plot these figures to give the demand curve for the product.
- If the demand function changes to Qd = 100 - 10P, draw up a new table to show the change in quantity demanded for prices from $0 - $10.
- Plot the new demand curve.
- If the demand function now changes to Qd = 120 - 10P, draw up a new table to show the change in the values for quantity demanded for prices from $0 - $10.
- Plot this new demand curve.
- Explain two reasons for:
- the change in the demand function from Qd = 100 - 8P to Qd = 100 - 10P
- the change in the demand function from Qd = 100 - 10P to Qd = 120 - 10P

The law of supply
Supply
That quantity of goods and services that will be supplied to the market at various prices in a given time period.
If you would prefer to view this interaction in a new web window, then please follow the link below:
Non-price determinants of supply
If you would prefer to view this interaction in a new web window, then please follow the link below:
Movements along the supply curve
If you would prefer to view this interaction in a new web window, then please follow the link below:

The supply curve is drawn on the assumption that only price has changed and everything else has remained the same. This is an important assumption to note. In reality many factors are changing at the same time, but if we are to analyse the factors causing a change in the market, we first need to isolate each of the factors. This assumption, known as 'ceteris paribus' or 'other things being equal' enables us to do this.
Shifts in the supply curve
If you would prefer to view this interaction in a new web window, then please follow the link below:

The supply curve is drawn on the assumption that only price has changed and everything else has remained the same. This is an important assumption to note. In reality many factors are changing at the same time, but if we are to analyse the factors causing a change in the market, we first need to isolate each of the factors. This assumption, known as 'ceteris paribus' or 'other things being equal' enables us to do this.
Shifts and moves of supply curve
You must be absolutely certain about what causes shifts along or movements of a supply curve. Work carefully through the following example.

Example 1
The diagram below, Figure 1, represents the supply of a product (X) at a point in time. The price then was P1 and the quantity supplied Q1.
Figure 1 The supply of Product X
Copy this onto another piece of paper, then sketch on this new diagram the effect of the following changes. Treat each change as a separate change - in other words start each time from Figure 1. Once you have had a go at each one then follow the link below to check you got the change right.
(a) Market price of the product falls from P1 to P2.
Answer - part (a)
(b) The government passes new minimum wage legislation, which will have the effect of increasing the cost of labour to the firm (an increase in costs of production).
Answer - part (b)
(c) The government places a tax on the sale of the product.
Answer - part (c)
(d) A new and highly efficient production process has been developed for a good.
Answer - part (d)
(e) Producers in a market can easily produce two products - chocolate chip cookies and chocolate coated cookies. The market for chocolate coated cookies has considerably declined. Producers decide to supply more chocolate chip cookies to the market instead.
Answer - part (e)
This should not be too difficult if you keep calm. Ask yourself three questions:
- Has a ceteris paribus factor changed - in which case the curve will shift?
- Will supply increase or decrease?
- If price has changed will there be an extension or contraction of demand?
The real supply curve?
The supply curve is usually drawn as an upwards (left to right) sloping curve. This implies that as price rises, so will the supply. This further supposes that the response time for the supplier is zero. In many cases this is far from the case. If it was, then supermarket shelves would never be out of stock of the item you want! Consider the market for houses in a region illustrated in Figure 1 below.
Figure 1 Supply of houses
Builders are constructing and selling 'Q' houses per month at present at price 'P'. Suddenly demand increases significantly, as a government department is moving a capital city office there. What can be done? Not much, at least in the next few months.
Supply is essentially fixed at Q, regardless of demand. The supply curve is a vertical line. Prices will be put up by the developers if they think it worthwhile - in our diagram prices have risen to P1.
 Supply will take time to react to the new situation. They need land and planning permission and this can take months or years to organise. It will then take anything from 6 months to a year to build the house itself.
Once adjusted, the builders will actually be operating on another vertical supply curve. They will now be building Q2 houses per month and the pressure on prices is eased (though the exact impact will depend on national effects as well). Let's hope the government does not change its mind!
Figure 2 Increase in supply
Now think about the supply of things like CIVIL AIRCRAFT, AGRICULTURAL PRODUCTS and FOREIGN HOLIDAYS.
SUPPLY CHANGES SLOWLY, MUCH MORE SLOWLY THAN DEMAND.
Linear supply functions


For higher level, you need to be able to understand linear supply functions and to be able to calculate supply and plot a supply curve from a supply function. The presentation below goes through this. Click on the screenshot or link below to open the presentation. It will open in a new web window. You will need a headset or speakers to listen to the explanation.
Linear supply functions

Linear supply functions - example


Assume a linear supply function of the form:
Qs = -30 + 10P
Using this supply function, answer the following questions. Once you have had a go at the questions, follow the link below to compare your answers.
- Calculate the quantity supplied for prices from $4 - $15.
- Plot these figures to give the supply curve for the product.
- If the supply function changes to Qs = -30 + 12P, draw up a new table to show the change in quantity supplied for prices from $4 - $15.
- Plot the new supply curve.
- If the supply function now changes to Qs = -50 + 12P, draw up a new table to show the change in the values for quantity supplied for prices from $4 - $15.
- Plot this new supply curve.
- Explain two reasons for:
- the change in the supply function from Qs = -30 + 10P to Qs = -30 + 12P
- the change in the supply function from Qs = -30 + 12P to Qs = -50 + 12P

Market equilibrium
In the previous section we explained markets and the rules of supply and demand. We now move on to examine market equilibrium, the price mechanism and market efficiency.
 .
.
By the end of this section you should be able to:
- Explain, using diagrams, how demand and supply interact to produce market equilibrium.
- Analyse, using diagrams and with reference to excess demand or excess supply, how changes in the determinants of demand and/or supply result in a new market equilibrium.
- Explain why scarcity necessitates choices that answer the "What to produce?" question.
- Explain why choice results in an opportunity cost.
- Explain, using diagrams, that price has a signalling function and an incentive function, which result in a reallocation of resources when prices change as a result of a change in demand or supply conditions.
- Explain the concept of consumer surplus.
- Identify consumer surplus on a demand and supply diagram.
- Explain the concept of producer surplus.
- Identify producer surplus on a demand and supply diagram.
- Explain that the best allocation of resources from society's point of view is at competitive market equilibrium, where social (community) surplus (consumer surplus and producer surplus) is maximized (marginal benefit = marginal cost).

- Calculate the equilibrium price and equilibrium quantity from linear demand and supply functions.
- Plot demand and supply curves from linear functions, and identify the equilibrium price and equilibrium quantity.
- State the quantity of excess demand or excess supply in the above diagrams.
Market equilibrium - notes
If you would prefer to view this interaction in a new web window, then please follow the link below:
Excess demand and excess supply
If you would prefer to view this interaction in a new web window, then please follow the link below:
Changes in demand and supply
We can now see how shifts of supply and demand curves cause changes in prices and quantities bought and sold. In the next two pages, there are two example markets with a series of changes to each. Try working through each one and check that you understand how the curves shift. Click on the right arrow at the top or bottom of the page to look at the first example.
Summary
Having worked through this unit you should be able to:
1. Define a market
2. Show how it responds to changes in supply and demand
3. Demonstrate that movements along a demand curve come as a result of a shift in the supply curve, and movements along a supply curve from a shift of the demand curve.
Example 1 - the market for DVD players

Copy out Figure 1 below and label it as the market for DVD players.

Figure 1. The demand and supply model of a market
Now work through the following changes, and adjust the diagram as you go. After you have had a go at each change, follow the answer link below and see if you made the right changes. Treat each change as a separate change - in other words start with Figure 1 each time.
Change 1. The development of a new microchip enables producers to reduce the price of their products.
Change 1 - answer
Change 2. A major and successful advertising campaign is mounted for DVD's.
Change 2 - answer
Change 3. The government applies VAT (sales tax) to all home entertainment equipment.
Change 3 - answer
Example 2 - the market for fish

 Let's look at another example, and make sure that you understand how the shifts and movements occur and interact. Now work through the following changes, and adjust the diagram as you go. After you have had a go at each change, follow the answer link below and see if you made the right changes.
Figure 1 represents the market for fish at the start of a week. Assume that all demand and supply changes occur without delay, i.e. they react instantly. The changes given are all sequential. In other words use the diagram you end up with as the starting point for the next change.
Figure 1 The Market for fish
Change 1. There are very rough seas and small boats cannot fish.
Change 1 - answer
Change 2. It is Thursday, a day where the demand for fish is very high. Seas become even rougher and even fewer boats can go to sea.
Change 2 - answer
Change 3. It is Friday, when demand for fish is even higher. Storms weaken, though, and fishing becomes easier.
Change 3 - answer
In this example, we have seen price rises accompanied by an increase in sales. This does not mean that the rules of price and demand are wrong, just that in such cases there will have been changes in the determinants, other than price, of supply and demand. Be careful to separate shifts from movements. Notice that movements along a demand curve come as the result of movements (shifts) of supply.
Applications of demand and supply
Markets rarely react fast, so it takes time for the market to regain equilibrium after it has experienced a change or a shock. Examine Figure 1, which shows the effect of an increase in demand on the market for new houses in an area. Assume that a major, large government department has just announced that it is to relocate to this area.
Figure 1 The market for new houses
The initial market was defined by demand curve D and supply curve S. The market was in equilibrium at price P1 when Q1 new houses were bought and sold. The entry of the government department will increase demand and shift the demand curve to D1. Supply will take time to react so price will rise initially to P2, then fall back slowly to P3 as the supply of houses increases. It will move from one equilibrium position, P1Q1, to another, P3Q2, over a period of time. It will pass through P2Q1 on the way.
Further examples are the markets for drugs or alcohol. Suppose the police were to really crack down on drug dealing, with considerable but not perfect effect. What would happen?
The US Government once tried to ban the sale, and hence consumption, of alcohol in America, but with only partial success. What happened here? Look at Figure 2.
Figure 2 The drug or alcohol market
In both cases the measures had no effect on demand, but reduced supply. So price would go up but the quantity available would fall.
For the drugs, the street price would be an indication of the success of the police. The greater the rise, the greater the degree of success.
Calculating market equilibrium


For higher level, you need to be able to understand how to calculate market equilibrium from demand and supply functions. The presentation below goes through this. Click on the screenshot or link below to open the presentation. It will open in a new web window. You will need a headset or speakers to listen to the explanation.
Calculating market equilibrium

Calculating equilibrium - example


Assume a linear demand function of the form:
Qd = 85 - 5P
and a linear supply curve of the form:
Qs = -20 + 10P
Using these demand and supply functions, answer the following questions. Once you have had a go at the questions, follow the link below to compare your answers.
- Calculate the quantities demanded and supplied for prices from $2 - $12.
- Plot these figures to give the demand and supply curves for the product.
- Using simultaneous equations, calculate the equilibrium price and output.
- If the demand function changes to Qd = 100 - 5P, draw up a new table to show the change in quantity demanded for prices from $2 - $12.
- Plot the new demand curve on the original demand and supply diagram.
- Using simultaneous equations calculate the new equilibrium price and quantity.

Scarcity and choice
If you would prefer to view this interaction in a new web window, then please follow the link below:
Choice and opportunity cost
When you make a choice to buy something you exchange cash for a product or service. For most people, cash is relatively scarce. So this choice means that spending the cash on means that it cannot be used to buy something else. This introduces the concept of opportunity cost.
Opportunity cost
The opportunity cost of an activity is the sacrifice made to do it. It is the real cost of the next best alternative foregone when an economic decision is made. The more a nation produces of one thing, the less of something else it can produce. The sacrifice of the alternative is the opportunity cost.
A few examples:
- The government choose to spend more on health care. This may mean sacrifices elsewhere and may mean less spent on affordable housing. The reduction in housing is the opportunity cost.
- The opportunity cost of working overtime (supplying more labour) is the leisure time that you have sacrificed.
- You own a lawnmower that you rarely use. It has a second hand value of $50. The opportunity cost of keeping the mower is $50.
- You are given $400 as an 18th birthday present. You decide to spend it on a holiday rather than put it into a long - term saving account. The opportunity cost of the holiday is the savings that have been given up.
- You buy a CD instead of purchasing lunches for a week. The opportunity cost of the CD is the lunches given up.
The fact that there is an opportunity cost to every transaction means that we all face trade-offs in the decisions we make. As a society, we cannot have everything we want and so to have more of one thing, we may have to have less of another. This notion of trade-offs is one that will recur throughout your economics course. It will also arise when we look at the management of the national economy as governments face trade-offs as well as individuals. They may want low unemployment and low inflation, but less of one may mean more of the other.
Remember, however, that opportunity cost is not a financial cost - it is a resource cost, i.e. what's given up in real, as opposed to money terms.
Price signalling
Resource allocation - the importance of price as a signal

Signalling function
In a market economy, prices perform a signalling function - prices adjust to show where resources are required and where they are not.

Incentive function
Prices also perform an incentive function. As prices rise or fall, this provides an incentive for producers to increase/reduce supply (as profitability of the good changes) and an incentive for consumers to purchase less/more (as the benefit they receive falls/rises).
 The central problem of economics is one of scarcity of productive resources relative to the unlimited potential demand that could be made upon them. It therefore follows that every society, be it centrally planned or based upon markets, has to have some mechanism (system) by which its resources, that is its land, labour and capital, are allocated amongst all the numerous uses to which they could be put. So, by what process are resources deployed so as to ensure that consumers obtain exactly the right amounts of frying pans, ice creams, jeans etc. that they require? Well, under a system of central planning the answer is not too difficult to ascertain - the state planning authority decides upon its priorities and directs resources to those lines of production which are deemed to be most important; but, in the absence of a central planning authority, how do consumers magically obtain those goods that they want in just the right quantities? Here the answer is slightly less obvious - essentially, it is through the interaction of demand and supply. How exactly does this interaction perform the allocative function?
The short answer to the above question is that it is through movements in prices. These changes in price indicate and motivate - this is called the signalling function. Changes in price indicate the relative strength of consumer demand and signal to producers the changes in demand for their goods or services. Prices also indicate changes in supply that enable producers to signal to consumers what is available on the market and on what terms. Rising prices of goods motivate producers to respond to increases in demand by increasing supply; producers will decrease supply when prices fall. You will see more clearly how this works when you see how the market forces of supply and demand interact to determine price.
Market efficiency - consumer surplus
If you would prefer to view this interaction in a new web window, then please follow the link below:
Market efficiency - producer surplus
If you would prefer to view this interaction in a new web window, then please follow the link below:
Allocative efficiency
Allocative efficiency is an important concept in economics and one we shall return to throughout this module. Allocative efficiency is essentially a situation where consumers are getting the maximum possible satisfaction from the current combination of goods and services being produced and sold. In other words by changing their pattern of consumption and buying different quantities of goods and services, consumers could not increase the satisfaction they are getting.
If we apply this concept at the level of a market, then we can see that society will get the maximum possible benefit when a market is in equilibrium. If we look at figure 1 below, then we can see that at a quantity of Q* (the equilibrium quantity), both consumer and producer surplus are maximised. If the economy was to produce a quantity below Q*, then more consumer and more producer surplus could be gained by a greater quantity being produced and sold of this good.
Figure 1 Consumer and producer surplus
Allocative efficiency requires two different types of efficiency:
- Efficiency in consumption - this is where consumers allocate their incomes in such a way that they get the maximum possible satisfaction from their limited incomes. We assume that this is what all rational consumers are trying to achieve.
- Efficiency in specialisation and exchange - this type of efficiency requires efficient markets where firms specialise in producing and selling and consumers specialise in working so that they can buy goods and services. In this way the markets are as efficient as is possible.
The combination of both these types of efficiency results in allocative efficiency. Allocative efficiency will be increased as long as doing more of something results in a greater marginal benefit to society than marginal cost. As long as this process continues, allocative efficiency will increase. The optimum level of allocative efficiency will be where this process reaches its logical conclusion. In other words where marginal benefit = marginal cost.
1.1 Competitive markets - questions
In this section are a series of questions on the topic - competitive markets. The questions may include various types of questions. For example:
- Self-test questions - on-screen questions that give immediate marking and feedback
- Short-answer questions - a series of short-answer questions to help you check your understanding of the topic
- Numerical - calculation questions
- In the news - questions based around a topical economics news article
Click on the right arrow at the top or bottom of the page to work through the questions.
Market structures - self-test questions

1 |
Market structuresMatch the following descriptions with the appropriate market structure? |
2 |
Market structuresWhich of the following is the most competitive market structure? |
3 |
Market structuresWhich of the following is the least competitive market structure? |
4 |
Market structuresWhich of the following is NOT a feature of monopolistic competition? |
5 |
Market structuresIn which form of market structure would price be the key factor when competing? |
Market structure - short answer

Question 1
Discuss three different ways that firms can compete.
Question 2
Why do firms do research?
Question 3
Distinguish between short run and long run advantages to a firm of competition.
Question 4
Distinguish between short run and long run advantages to a consumer of competition.
Question 5
What is the driving force behind the research done by firms?
Price as a signal - short answer

The importance of price as a signal
Question 1
Explain how the price mechanism assists in the allocation of resources
Question 2
Discuss the case for and against doctors charging patients for their services
Demand - self-test questions

1 |
DemandWhich of the following would be likely to decrease the demand for a product? |
2 |
Shift in demand curveWhich of the following may lead to a shift in the demand curve? (Select all possible correct responses) |
3 |
SupplyWhich of the following would be likely to shift the supply curve for Mars Bars to the left? |
4 |
DemandWhich of the following would be likely to lead to an extension in demand for iPods? |
Demand - short answer

Question 1
What is individual demand? What is the difference between individual demand and market demand?
Question 2
The table below represents the market for DVD's. For each of the changes given, tick the relevant column to show whether the demand curve has shifted either left or right or whether there has been an extension or contraction of demand (a movement along the demand curve).
| Change | Shift right | Shift left | Extension in demand | Contraction in demand |
|---|---|---|---|---|
| There is an increase in real incomes | ||||
| Raw material costs increase | ||||
| New capital equipment enables DVD producers to increase productivity | ||||
| A new super CD-ROM is developed that is cheaper than DVD's but has same functionality | ||||
| A major pay per view cable provider goes into liquidation | ||||
| There is a serious recession | ||||
| Prices of DVD players fall |
Question 3
Demand curve shifting right
 Energy saving light bulbs can be used to replace conventional light bulbs. At present energy saving light bulbs are significantly more expensive to buy than normal light bulbs and the light takes several minutes to reach full intensity. If the above demand curve is the demand curve for energy saving light bulbs, which of the following events may have caused the shift shown?
(a) A fall in price of a conventional light bulbs
(b) Government legislation restricting the manufacture and sale of conventional light bulbs
(c) An increase in the cost of electricity
(d) An increase in the price of raw materials required for the manufacture of energy saving light bulbs
(e) Medical reports about cancer causing effects of energy light bulbs
(f) A decrease in real incomes
(g) An increase in real incomes
(h) A major advertising campaign showing the benefits of energy light bulbs
(i) Improved technology speeding up the time taken for energy saving light bulbs to reach full light intensity
Question 4
Which of the following would you regard as substitutes for a laptop computer and which may be complements? In each case consider whether they are 'close' complements or substitutes.
(a) Apple iPod
(b) Desktop computers
(c) PDA's
(d) Web site development software
(e) Mobile phones
(f) Handheld tablet computers
(g) Docking stations
Supply - short answer

Question 1
The table below represents the market for computers. For each of the changes given, tick the relevant column to show whether the supply curve has shifted either left or right or whether there has been an extension or contraction of supply (a move along the supply curve).
| Change | Shift right | Shift left | Extension in supply | Contraction in supply |
|---|---|---|---|---|
| There is an increase in real incomes | ||||
| A surplus of memory on world markets leads to a significant price fall for memory chips | ||||
| New capital equipment enables computer producers to build machines cheaper | ||||
| Labour costs for manufacture increase | ||||
| There is agreement by G8 countries to put a tax on computers | ||||
| Rapid growth in the developing world means increased demand for computers | ||||
| The development of TV-based interactive internet services |
Question 2
Supply curve shifting left
If the above supply curve is the supply curve for energy saving light bulbs, which of the following events may have caused the shift shown?
(a) A fall in price of a substitute for energy saving light bulbs
(b) A subsidy on the production of energy saving light bulbs
(c) A fall in labour costs for producing conventional light bulbs
(d) A fall in the price of raw materials required for manufacture
(e) Anticipating a increase in demand, major manufacturers invest in new capital equipment for the manufacturing of energy saving light bulbs
(f) A decrease in real incomes
Question 3
Which of the following is a reasonable explanation of the direct relationship between price and supply (the supply curve)? N.B. A number of them could be right.
(a) Improvements in technology help manufacturers to supply more at a lower price.
(b) As price of a good or service falls, firms will shift to producing other goods which become more profitable.
(c) At higher prices it is still profitable to use more expensive factors of production switched from other areas.
(d) At higher prices it is worthwhile producing more despite higher costs of production as the profit margin stays the same.
(e) Labour costs tend to increase each year.
Demand and supply - short answer

Interaction of demand and supply
Question 1
The data in the table below shows the demand and supply for digital cameras at various prices.
| Price (£) | Quantity demanded (millions per year) | Quantity supplied (millions per year) |
|---|---|---|
| 16 | 140 | 20 |
| 32 | 120 | 60 |
| 48 | 100 | 100 |
| 64 | 80 | 140 |
| 80 | 60 | 180 |
(a) Plot the demand and supply curves on a diagram.
(b) What would be the excess demand or supply if the price was set at £32?
(c) What would be the excess demand or supply if the price was set at £80?
(d) What is the equilibrium price and quantity?
(e) If income rises and demand, as a result, rises by 20 million units at each level, what will be the new equilibrium price?
Question 2
In the table below tick the appropriate column to show the impact of the change given on the market for cinema tickets.
| Change | Demand shift right | Demand shift left | Supply shift right | Supply shift left |
|---|---|---|---|---|
| There is an increase in real incomes | ||||
| Stelios Haji-Ioannou rolls out the EasyCinema low price model nationwide | ||||
| The commission paid to film distributors by the cinemas falls | ||||
| Planning law changes to restrict the development of out-of-town entertainment complexes | ||||
| Pay-per-view cable, satellite and internet film services are developed and grow in popularity | ||||
| Spiralling film production costs mean fewer new releases | ||||
| Cinema operators develop new premium services |
Markets and prices - self-test questions

1 |
Market changes
The diagram below shows the market for 3G mobile phones. Which of the following events might have caused the shift in the demand curve?
|
2 |
Market changesThe diagram below shows the market for coffee. Which of the following events might have caused the shift in the supply curve? |
3 |
Market changes
The diagram below shows the market for olive oil. Which of the following events might have caused the shift in the supply curve?
|
4 |
Market changes
The diagram below shows the market for hard disk music players. Which of the following events might have caused the shift in the demand curve?
|
5 |
Shifts in demand and supply curvesConsider the market for Mars Bars. Match the changes below with the shifts in supply and demand that they are likely to lead to. |
6 |
7 |
Market equilibrium - numerical


Question 1
For a linear demand function of Qd = 155 - 5P, calculate the values of quantity demanded for prices from $1 to $20.
Question 2
For a linear supply function of Qs = -25 + 10P, calculate the values of quantity supplied for prices from $1 to $20.
Question 3
Plot the demand and supply diagram for the values for quantity demanded and supplied calculated in questions 1 and 2.
Question 4
Using simultaneous equations calculate the equilibrium price and output. Show your working.
Question 5
The demand function changes to Qd = 125 - 5P.
- Calculate the new values for quantity demanded for prices from $1-$20.
- Calculate the new equilibrium price and output using simultaneous equations
- Plot the new demand curve as D2 on the demand and supply diagram. Use the diagram to confirm your answers to part (b).
Question 6
The supply function now changes to Qs = -15 + 15P.
- Calculate the new values for quantity supplied for prices from $1-$20.
- Calculate the new equilibrium price and output using simultaneous equations
- Plot the new supply curve as S2 on the demand and supply diagram. Use the diagram to confirm your answers to part (b).
Question 7
Suggest two reasons for:
- The change in the demand function from Qd = 155 - 5P to Qd = 125 - 5P.
- The change in the supply function from Qs = -25 + 10P to Qs = -15 + 15P.

Demand and supply - data response

Interaction of demand and supply
Oil Prices
"Experts see no relief from high oil prices. Even OPEC's promise to pump more crude has failed to cool markets" reads a headline in The International Herald Tribune -The Global Edition of the New York Times (7 April 2011. Matthew Saltmarsh). The article goes on to report on the oil conference in Paris held the previous day. The Chief Executive of the French oil company, Total, Christophe de Margerie, stated that whilst he would be happy for oil prices to go down to $80 he could not see it happening: "Demand plus costs are increasing - tell me how you could see a reduction in oil prices," he said.
He went on to say that oil prices were being buoyed (kept high) by the concerns of the political stability in the Middle East and the worries about the future of nuclear power as a result of the effects of the earthquake and tsunami in Japan last month. "Short term, there's enough capacity available," he said. "But for the long term the best way we can avoid rising prices is investment in projects, non-conventional energy and reducing consumption in all countries."
Question 1
Define the terms:
- demand
- market
Question 2
With the aid of a suitable diagram, explain how increased demand for oil and increased costs of production lead to higher oil prices.
Question 3
Using your knowledge of economics and of the real world, explain how uncertainty in a market can lead to buyers stockpiling reserves of a good such as oil regardless of high prices.
Question 4
Evaluate the likely success of the imposition of policies by a government to promote non-conventional energy, such as bio-fuels, and reduction of oil consumption.
High Food Prices

"Rush to biofuels playing role in hunger and higher prices." (International Herald and Tribune. 7 April 2011. Elisabeth Rosenthal.) In her article Ms Rosenthal states:
"The starchy cassava plant has long been an ingredient in everything from tapioca pudding and ice cream to paper and animal feed.
"But last year, 98% of cassava chips exported from Thailand, the world's largest cassava exporter, went to just one place and for just one purpose: to China to make biofuel. Driven by new demand, Thai exports of cassava chips have increased nearly fourfold since 2008, and the price of cassava has roughly doubled." It can be seen that increased demand has led to an increase in price which has signalled to producers in Thailand to supply more cassava in the market.
She then goes on to write "Each year an ever larger portion of the world's crops, from cassava to corn to sugar to palm oil, is being diverted for biofuels as developed countries laws mandating greater use of non-fossil fuels and emerging powerhouses like China seek new sources of energy ....... But many experts are calling on countries to scale back their headlong rush in to green fuel development, arguing that ambitious biofuel targets and mediocre harvests of some crucial crops is contributing to high prices, hunger and political instability".
Question 1
Define the terms:
- supply
- market
Question 2
Using an appropriate diagram, show how increased demand from China and increased supply by Thailand of cassava has caused changes in price in the market for cassava chips.
Question 3
Explain how the diversion of traditional food products, such as cassava and palm oil, to biofuel production can lead to high food prices, hunger and possible political instability in a country such as Egypt.
Question 4
Using your knowledge of economics and of the real world, evaluate the decision by governments in developed countries to move to new sources of energy in the form of green fuel development.
Oil - the rise and rise
Read the article 2011 Halftime Report: Oil Outlook Remains Strong and then answer the questions below. You can either read the article in the window below or you can follow the previous link to read the article in a separate window.

You may also want to read to help answer the questions:

Question 1
Define the following terms used in the text of the article 'Halftime Report':
- Supply and demand fundamentals
- Bull market
Question 2
Using diagrams, as appropriate, explain the changes that have taken place in the oil market.
Question 3
Analyse the extent to which the rise in oil prices has been as a result of policies pursued by OPEC - the oil cartel.
Question 4
Analyse the extent to which the increase in oil prices will impact on countries in the developed world
Question 5
Discuss the likelihood of oil prices rising further.

Extension exercises:
Focusing on supply and demand factors over the next 2 to 3 years, write a 500 to 1000 word report on one of the following:
- the market for oil and gas
- the market for wind power generated electricity
- the effect of further increases in the price of oil.
New Zealand dairy prices increase
Read the article Dairy product prices to rise despite milk freeze and then answer the questions below. You can either read the article in the window below or you can follow the previous link to read the article in a separate window.

Question 1
Identify the key determinants of demand for dairy products in New Zealand.
Question 2
Using diagrams, as appropriate, explain the changes that have taken place in the market for dairy products.
Question 3
Analyse the likely impact of the increase in the price of milk on
- pizzas and
- soya milk and other milk substitutes.
Question 4
Discuss the extent to which manufacturers of dairy products will be able to pass on the increased costs to consumers in the form of higher prices.
Orange juice will soon be a luxury
Read the article Orange juice will soon be 'luxury' and then answer the questions below. You can either read the article in the window below or you can follow the previous link to read the article in a separate window.

Question 1
Define the terms:
- luxury item
- commodity prices
Question 2
Using supply and demand diagrams as appropriate, explain the impact of the freezing weather in Florida and China on the world price of oranges.
Question 3
With the use of supporting diagrams, analyse the impact of non-price determinants on the supply of, and demand for, orange juice.
Question 4
To what extent are retailers able to absorb price increases from their suppliers, rather than pass them onto consumers?
The true face of global warming
Read the article Mozambique's riots: The true face of global warming and then answer the questions below. You can either read the article in the window below or you can follow the previous link to read the article in a separate window.

Question 1
Define the terms:
- inflation
- recession
Question 2
Explain the impact of financial speculators on the prices of food commodities.
Question 3
Using supply and demand diagrams as appropriate, analyse the 'Deeper reasons for Mozambique's price hike'.
Question 4
'Global commodity speculators continue to treat food as if it were the same as television sets, with little end in sight to what the World Development Movement has called "gambling on hunger in financial markets". To what extent can international governments influence food prices to protect less developed countries, such as Mozambique?
How much is a 2p worth? Actually 3p
Read the article How much is a 2p worth? Actually 3p and then consider answers to the questions below. You can either read the article in the window below or you can follow the previous link to read the article in a separate window.

You may also like to read the article Mint warns against melting coins.

Question 1
Examine the factors that have caused the rise in copper prices on world markets.
Question 2
Describe the principal factors affecting the demand for copper and other metals.
Question 3
Explain what is meant by the terms "goldilocks economy" and "super-cycle"? (See the Guardian article.)
Labour mobility
Read the article EU free movement of labour map and then consider answers to the questions below. You can either read the article in the window below or you can follow the previous link to read the article in a separate window.

Question 1
Explain the reasons why some EU countries have maintained restrictions on workers entering their countries.
Question 2
Analyse the advantages and disadvantages of increasing labour mobility in Europe.
Question 3
Using diagrams, as appropriate, evaluate the impact on greater labour mobility on the labour market of one of the 'Old EU' countries.
1.1 Competitive markets - simulations and activities
In this section are a series of simulations and activities on the topic - Markets. These simulations and activities might include:
- Interactive diagrams - diagrams where you can drag curves or sliders to see the impact of the changes on the diagram
- PlotIT - a chance to build diagrams from data
- Step-by-step - diagrams built up step by step to help you see how to draw them and understand the principles behind the diagram
Click on the right arrow at the top or bottom of the page to move on to the next page.
PlotIT - Build a demand curve
Consider the (imaginary) data in the following table. This shows the annual demand for tennis shoes in three sections of the market. Calculate the total (annual) market demand. Jot this down on a piece of paper. You may like to check your answer.
| Price (£) | Tennis club members ('000s) | Players, but not club members ('000s) | Non-tennis players ('000s) | Total market ('000s) |
|---|---|---|---|---|
| 100 | 6 | 1 | 0 | |
| 80 | 7 | 3 | 0 | |
| 60 | 8 | 6 | 2 | |
| 40 | 9 | 10 | 8 | |
| 20 | 10 | 18 | 20 |
From the table, plot each of the figures for total market demand on the following diagram. To do this, click your mouse on the graph axes for the position of each of the plots. When you have done this, the demand curve will automatically be drawn.
You may like to check your answer to see if it matches the correct curve.

1 |
Expansion/contraction of demandIf the price of tennis shoes falls, there will be an extension in demand. |
2 |
Demand for tennis shoesA higher rate of economic growth will lead to an extension in demand. |
Step by step - a decrease in demand
If you would prefer to view this interaction in a new web window, then please follow the link below:
Step by step - an increase in demand
If you would prefer to view this interaction in a new web window, then please follow the link below:
Step by step - a decrease in supply
If you would prefer to view this interaction in a new web window, then please follow the link below:
Step by step - an increase in supply
If you would prefer to view this interaction in a new web window, then please follow the link below:
PlotIT - Build a demand and supply diagram
The demand and supply schedules for organically grown wheat are shown in the following table. From it we can see that at a price of £200, farmers will produce (or plan to plant and produce) 220 tonnes per annum (p.a.); likewise consumers will buy 220 tonnes p.a. at this price. However, the price of non-organic wheat falls dramatically and is considerably cheaper than organic wheat. As a result the demand for organically grown wheat changes by 80 tonnes at all prices. Calculate the new level of demand at each price level. Jot this down on a piece of paper. You may like to check your answer.
| Price per tonne (£) | 50 | 100 | 150 | 200 | 250 | 300 | 350 |
|---|---|---|---|---|---|---|---|
| Tonnes supplied p.a. | 100 | 140 | 180 | 220 | 260 | 300 | 340 |
| Tonnes demanded p.a. | 400 | 320 | 260 | 220 | 180 | 140 | 120 |
| New tonnes demanded p.a |
In the diagram below plot the original supply and demand curves and the new demand curve given this change in the price of non-organic wheat.
You may like to check your answer to see if it matches the correct demand and supply curves.

1 |
Market for organic wheatWhat will be the shortage/surplus at the original price of £200 per tonne? |
2 |
DragIT - Demand and supply
The following diagram shows the demand and supply of good X. For each of the following, click on either the demand or supply curve (or first one and then the other) and drag the curve(s) to a position that illustrates the question to help you match the events to the particular change.

1 |
Shifts in demand and supplyMatch the following changes to the shifts that will take place. |
Diagram toolkit
In the diagram toolkit you get given a panel showing possible curves and labels and you then drag these curves onto targets on the diagram to try to build an appropriate diagram.
There are a number of sections. Follow the links below to access the different sections or use the table of contents on the left.
- The market for air travel (1)
- The market for air travel (2)
- The market for air travel (3)
- The market for iPods (1)
- The market for iPods (2)
- The market for iPods (3)
Why not try the one below as some practice? Drag curves and labels onto the targets on the diagram to build a demand and supply diagram showing a market in equilibrium. Once you think the diagram is right, click 'Check answer'. To see the correct answer, click the 'Feedback' button.
Click on the right arrow to start trying out the diagram toolkit.
Air travel (1)
On the diagrams below, drag curves and labels from the panel on the right to build the appropriate diagram. Once you think the diagram is right, click 'Check answer'. To see the correct answer, click the 'Feedback' button.
Number 1
Number 2
Number 3
Number 4
Click on the right arrow try some further examples.
Air travel (2)
On the diagrams below, drag curves and labels from the panel on the right to build the appropriate diagram. Once you think the diagram is right, click 'Check answer'. To see the correct answer, click the 'Feedback' button.
Number 1
Number 2
Number 3
Click on the right arrow try some further examples.
Air travel (3)
On the diagrams below, drag curves and labels from the panel on the right to build the appropriate diagram. Once you think the diagram is right, click 'Check answer'. To see the correct answer, click the 'Feedback' button.
Number 1
Number 2
Number 3
Click on the right arrow try some further examples.
iPods (1)
On the diagrams below, drag curves and labels from the panel on the right to build the appropriate diagram. Once you think the diagram is right, click 'Check answer'. To see the correct answer, click the 'Feedback' button.
Number 1
Number 2
Number 3
Number 4
Click on the right arrow try some further examples.
iPods (2)
On the diagrams below, drag curves and labels from the panel on the right to build the appropriate diagram. Once you think the diagram is right, click 'Check answer'. To see the correct answer, click the 'Feedback' button.
Number 1
Number 2
Number 3
Click on the right arrow try some further examples.
iPods (3)
On the diagrams below, drag curves and labels from the panel on the right to build the appropriate diagram. Once you think the diagram is right, click 'Check answer'. To see the correct answer, click the 'Feedback' button.
Number 1
Number 2
Number 3
1.2 Elasticities
In the previous sections we explained markets, the rules of supply and demand, market equilibrium, the price mechanism and market efficiency and how demand and supply are used to calculate market price and plot market equilibrium. In this section we explain the concept of elasticity.
 .
.
By the end of this section you should be able to:
- Explain the concept of price elasticity of demand, understanding that it involves responsiveness of quantity demanded to a change in price, along a given demand curve.
- Calculate PED
- State that the PED value is treated as if it were positive although its mathematical value is usually negative.
- Explain, using diagrams and PED values, the concepts of price elastic demand, price inelastic demand, unit elastic demand, perfectly elastic demand and perfectly inelastic demand.
- Explain the determinants of PED, including the number and closeness of substitutes, the degree of necessity, time and the proportion of income spent on the good.
- Calculate PED between two designated points on a demand curve using the PED equation.
- Explain why PED varies along a straight line demand curve and is not represented by the slope of the demand curve.
- Examine the role of PED for firms in making decisions regarding price changes and their effect on total revenue.
- Explain why the PED for many primary commodities is relatively low and the PED for manufactured products is relatively high.
- Examine the significance of PED for government in relation to indirect taxes.
- Outline the concept of cross price elasticity of demand, understanding that it involves responsiveness of demand for one good (and hence a shifting demand curve) to a change in the price of another good.
- Calculate XED
- Show that substitute goods have a positive value of XED and complementary goods have a negative value of XED.
- Explain that the (absolute) value of XED depends on the closeness of the relationship between two goods.
- Examine the implications of XED for businesses if prices of substitutes or complements change.
- Outline the concept of income elasticity of demand, understanding that it involves responsiveness of demand (and hence a shifting demand curve) to a change in income.
- Calculate YED
- Show that normal goods have a positive value of YED and inferior goods have a negative value of YED.
- Distinguish, with reference to YED, between necessity (income inelastic) goods and luxury (income elastic) goods.
- Examine the implications for producers and for the economy of a relatively low YED for primary products, a relatively higher YED for manufactured products and an even higher YED for services.
- Explain the concept of price elasticity of supply, understanding that it involves responsiveness of quantity supplied to a change in price along a given supply curve.
- Calculate PES
- Explain, using diagrams and PES values, the concepts of elastic supply, inelastic supply, unit elastic supply, perfectly elastic supply and perfectly inelastic supply.
- Explain the determinants of PES, including time, mobility of factors of production, unused capacity and ability to store stocks.
- Explain why the PES for primary commodities is relatively low and the PES for manufactured products is relatively high.
1.2 Elasticities - notes
 This unit, with its numbers, will scare some students. Be positive, the maths is easy; the key is to understand what the words mean. It is the language, rather than the numbers, that is usually the problem.
In the last unit we saw what demand is, and what its determinants are. We know that demand is sensitive to changes in these determinants; it is important to know how sensitive. Economists do this by measuring elasticity. In particular, they study price, income and cross price elasticity of demand. In addition they study price elasticity of supply. This is new language, so some definitions are needed.
Elasticity is simply the economist's word for responsiveness. For example, price elasticity shows how responsive demand is to changes in price. Economists will, in this case, be measuring how much the demand for a good or service will change as a result in a change in its price. In this section we consider the following topics in detail:
- Price elasticity of demand (PED)
- Cross elasticity of demand (XED)
- Income elasticity of demand (YED)
- Price elasticity of supply (PES)
- Applications of concepts of elasticity
- PED and taxation
- Other applications of elasticity
Price elasticity of demand (PED)

Price elasticity of demand (PED)
A measure of the resposniveness of the demand for a product to changes in its own price.
PED - formula
Price elasticity of demand is calculated and defined as:
![]()
Where Qd = Quantity demanded
and P = Price
The % change in quantity demanded is divided by the % change in price.
Some students find it difficult to remember which way up this equation is. The following 'aide memoire' may be of use. You usually put your dinner (demand) on your plate (price). Demand is over price, D over P!
Price elasticity is negative because price and quantity demanded usually vary inversely with each other. This is so common that the sign is ignored. Do not forget, when price increases, demand falls and vice versa. If necessary, go back and review the section relating to the law of demand.
PED values
If you would prefer to view this interaction in a new web window, then please follow the link below:
Determinants of price elasticity
If you would prefer to view this interaction in a new web window, then please follow the link below:
Calculating PED
You will be expected to calculate and use elasticity, and to interpret given data. This may happen in any of the papers that are taken. As we have seen price elasticity of demand is calculated and defined as:
![]()
Where Qd = Quantity demanded
and P = Price
So, to calculate the value of the price elasticity, we simply need to substitute the appropriate values in this equation. Let's look at this calculation through some examples.

Example 1 - price elasticity of demand
A product sells for $100 per unit, and the demand at that price is 10,000 units per week. The firm increases its price to $110 each and sales fall to 8,000 units per week. What is the price elasticity of demand for the product, and what effect will the price rise have on the firm's revenue?
| P1 | $100 | Q1 | 10,000 |
|---|---|---|---|
| P2 | $110 | Q2 | 8,000 |
| Change in price | +10 | Change in quantity demanded | -2,000 |
| Percentage change in price | +10% | Percentage change in quantity demanded | -20% |
Price elasticity of demand = % change in quantity demand / % change in price = -20 / +10 = -2
Demand in this case is elastic, i.e. the numerical value is greater than 1.
Sales revenue was $100 x 10,000 = $1,000,000 and became $110 x 8,000 = $880,000
Revenue has fallen.
Remember, if demand for a good or service is price elastic then an increase in price will decrease both sales and sales revenue. However, a price cut will increase both sales and revenue.

Example 2 - price elasticity of demand
A product has a PED (price elasticity of demand) of 0.8. At present it sells for $10 and sales have reached 100,000 per month. The firm is planning a price increase to $12 each. What can it expect to happen to sales and revenue if it goes ahead with the rise?
First remember that price elasticity is negative, and then use the formula that you know.
| P1 = $10 | P2 = $12 | Change in P = $2 (+20%) |
PED = 0.8
![]()
Cross-multiply and find:
% change in quantity = -0.8 x 20 = - 16%
New sales = 84% (100,000) = 84,000
Price would go up and sales would fall, as expected.
Revenue was $10 x 100,000 = $1,000,000
Would become $12 x 84,000 = 1,008,000
Revenue, on the other hand, would increase by $8,000.
Measuring elasticity
Price elasticity is based on the demand curve. In fact, the elasticity is the gradient of the demand curve at a particular point. i.e mathematicians will note that it is the differential of the demand function, in fact. This means it is a static measure, since it is based on static, or equilibrium data.
In the real world elasticity is very difficult to measure. There are far too many variables, and these change all the time. Quantitative data is rare, but qualitative data can be useful.
It is useful to remember that essentials tend to be price inelastic, as are addictive products. This is one of the reasons behind the taxing of alcohol and tobacco by many governments.
Elasticity along a straight line demand curve
If you would prefer to view this interaction in a new web window, then please follow the link below:
Elasticity and revenue
PED and business decisions - the effect of price changes on revenue
PED is important for business decision making as it determines the effect of price changes on total revenue. When a business is considering increasing or decreasing price, it is important to know the resulting impact on its sales revenue.
Remember that if demand for a good or service is price inelastic then an increase in price will decrease sales but increase sales revenue. However, a price cut will increase both sales but decrease sales revenue.
Firms like the demand for their product if possible to be inelastic. This means that any increase in price that they put in place will have proportionately less of an effect on demand and their total revenue will rise.
If price elasticity is 1, then revenue is the same all the time, even if prices are increased or decreased.
The changes in revenue for different elasticity values are summarised in the table below.
| Price elasticity value | Price change | Impact on firm's revenue | Explanation |
|---|---|---|---|
| Elastic | Increase | Fall | Elastic demand will mean that when price increases, demand will fall by a greater percentage than the price increased. This means a fall in revenue. |
| Elastic | Decrease | Increase | Elastic demand will mean that when price falls, demand will increase by a greater percentage than the price decreased. This means an increase in revenue. |
| Inelastic | Increase | Increase | Inelastic demand will mean that when price increases, demand will fall by a smaller percentage than the price increased. This means an increase in revenue. |
| Inelastic | Decrease | Fall | Inelastic demand will mean that when price falls, demand will increase by a smaller percentage than the price decreased. This means a fall in revenue. |
Consider the following demand curves:
Unit elastic demand
Figure 1 Unit elasticity of demand
Here the curve is a rectangular hyperbola. Thus all rectangles under the curve are equal in area and each rectangle equals total revenue (for example, the blue and red rectangles are equal). Thus, total revenue remains unchanged as price changes.
In this case it might not be worthwhile for a business to lower price as the extra demand would not bring forth any extra revenue (MR = 0), but it is highly likely that extra costs would be incurred in producing the additional output.
Elastic demand
Figure 2 Elastic demand (PED greater than 1 but less than infinity)
Here a decision to reduce price would lead to an increase in total revenue. As price falls from OP1 to OP2, there is a more than proportionate rise in the quantity demanded from OQ1 to OQ2 and total revenue rises from OP1 x OQ1 to OP2 x OQ2. The fall in revenue from the lower price (the red area) is more than compensated by the rise in revenue from the extra sales (the blue area). The decision to lower price may well be sound in this case as total revenue will rise which may lead to higher profits, depending on the relationship between costs and revenue.
Conversely, a decision to raise price would lead to a fall in total revenue. A rise in price from OP2 to OP1 would cause a more than proportionate fall in demand and so reduce total revenue.
Where demand is elastic:
as price increases, total revenue falls
as price decreases, total revenue rises
Inelastic demand
Figure 3 Inelastic demand (PED greater than 0, but less than one)
Here a decision to lower price would lead to a decrease in sales revenue. As price decreases from OP1 to OP2, there is a less than proportionate increase in demand from OQ1 to OQ2 and total revenue falls. We can see from figure 3 that the loss in revenue from the lower price (the red area) is less than the gain in revenue from the higher sales (the blue area) and so total revenue will fall.
Conversely, a decision to raise price from OP2 to OP1 would lead to a less than proportionate fall in demand from OQ2 to OQ1 and sales revenue would rise.
Where demand is inelastic:
as price increases, total revenue increases
as price decreases, total revenue decreases
Thus knowledge of the PED facing a firm's product or service enables rational pricing decisions to be made.
PED - primary vs manufactured
 If we look at the PED values for primary commodities and manufactured goods, we can see straight away that generally primary commodities have relatively low PED values (inelastic), while manufactured goods will tend to have higher values (more elastic).
So why is this? Well, if we look back at the determinants of the PED value that we looked at previously, we can start to identify why this might be the case. Let's remind ourselves first of the determinants of the PED value:
- The availability of close substitutes in the market. The more substitutes available the greater the elasticity.
- Is the good a luxury or necessity? Luxuries are more elastic in demand than necessities.
- Proportion of income spent on them. Cheap items tend to have an inelastic demand.
- Are they addictive? These obviously become price inelastic.
- The time period. Elasticity tends to increase with time.
- Number of uses
In the table below is a comparison of two products - wheat (a primary commodity) and laptops (a manufactured good) - against each of these determinants.
| Determinants | Wheat | Laptop |
|---|---|---|
| Availability of close substitutes | Relatively few substitutes - effectively a necessity | Reasonable number of substitutes depending on precise task (e.g. games consoles etc.) |
| Luxury or necessity? | Necessity | Luxury |
| Proportion of income spent | Depends on nature of economy, but generally relatively low | Depends on nature of economy, but generally relatively high - a one-off purchase |
| Addictive | N/A | N/A |
| Time period | Used over a short period - consumed immediately | Used over a long period |
| Number of uses | Single use - food | Multiple uses |
This helps us see why primary commodities will generally have a lower elasticity value than manufactured goods which will tend to be higher value luxuries rather than necessities and therefore more elastic.
PED and taxation
The imposition of a tax will mean that the price goes up (as supply shifts to the left). However, the amount of the price increase will depend on the elasticity of demand. Compare Figures 1 and 2 to see the difference.
Figure 1 Tax imposed on a good with elastic demand
Figure 2 Tax imposed on a good with inelastic demand

1 |
Tax revenueIf you aimed as a government solely to reduce the consumption of the good, which type of good would you be taxing? |
2 |
Tax revenue (2)If you aimed as a government to tax goods simply to raise tax revenue, which type of good would you tax? |
So, for a government wishing to raise revenue from indirect taxation, they will always tend to impose the taxes on goods with relatively inelastic demand. The more inelastic the demand, the more the price will rise and therefore the more of the tax will be passed on to the consumer.
Cross elasticity of demand

Cross elasticity of demand (CED)
The cross elasticity is a measure of the responsiveness of the demand for one product to changes in the price of another product.
Cross elasticity - formula
Cross elasticity is calculated and defined as:
![]()
Where Qdx = Quantity demanded of Good X
and Py = Price of Good Y
The XED is calculated by dividing the % change in the quantity demanded for one good or service by the % change in the price of another. It must be noted, however, that the two goods/services must be connected in some way (see the discussion of complements and substitutes below).
Cross price elasticity varies from 0 to infinity. As before, the now familiar descriptions are used:
| Value | Description |
|---|---|
| 0 | Perfectly inelastic |
| Under 1 | Inelastic |
| 1 | Unitary |
| Over 1 | Elastic |
| Infinity | Perfectly elastic |
Significance of XED sign
The sign is as important as the numerical value, however.
Some products tend to be bought together, others are purchased in competition to each other. Products bought together are called complementary goods. Products which are in competition with each other are called substitute goods.

Examples of complements are steak and chips, rice and curry, cars and petrol, torches and batteries, gas and gas cookers. Complementary goods have negative cross price elasticities. Perfect complements will have a cross price elasticity of - infinity: negative infinity
Example - complements

Examples of substitutes are beef and lamb, gas and heating oil, petrol and diesel fuel. (Note that the substitution may not be possible at once, it may occur over time). Substitutes have positive cross price elasticities.
Example - substitutes
Cross price elasticity can change with time, therefore.

Again, here are some examples of calculations.
Example 1 - cross price elasticity
Example 2 - cross price elasticity
XED and business decisions
Cross elasticity of demand: relevance for firms
Cross elasticity of demand (CED) is the responsiveness of demand for one good (good X) to a change in the price of another (good Y). Can you write down the FORMULA? Follow the link to check your answer.
The numerical value of the XED will depend on the relationship between the goods in question. If the goods are substitutes or complements, the numerical value of the XED will be much larger than if the two goods bear little relation to each other; i.e. a change in the price of one good will have a significant impact on the demand for the other good. This will be important for business decision making.
For example, consider two manufacturers of different brands of cola, for example (Coke and Pepsi). Let's call them Brand X and Brand Y, which are close substitutes for each other. The decision by the manufacturer of Brand X to lower price will, other things being equal, lead to an increase in the consumption of Brand X cola. If the manufacturer of Brand Y cola leaves the price unchanged, he/she is likely to experience a decrease in demand as Brand X will become relatively, and possibly absolutely, more expensive than Brand Y. The manufacturer of Brand X is faced with an important pricing decision in order to compete effectively with the rival. Can you think of any other goods or services where such close substitutes can be found?
Conversely, consider the case of two goods that are complements, strawberries and cream. A very British example, but very true! A good harvest will increase the supply of strawberries (the supply curve will shift to the right) and lower their price. As a result, there will be a movement along the demand curve for strawberries, an extension of demand. Given that people like to pour cream on their strawberries to give extra taste, manufacturers of cream will have to make important output decisions if they are to meet the potential increase in demand for cream arising from higher consumption of strawberries. Cows cannot suddenly increase their supply of milk so producers may have to switch production from other dairy products to that of cream or choose to keep cream output at the same level forcing the price of cream to rise in the market.
Income elasticity of demand

Income elasticity of demand (YED)
The income elasticity of demand is a measure of the responsiveness of the quantity demanded to changes in real income.
YED - formula
Income elasticity of demand is calculated and defined as:
![]()
Where Y = real income
and Qd is the quantity demanded
YED is calculated by dividing the %change in the quantity demanded for a good or service by the % change in income.
Normal and inferior goods
Elasticity can be calculated and a range of values found. What do they show? What do they tell an economist?
Income elasticity may be positive or negative. If income elasticity is negative, demand falls as real income rises. Goods or services with such elasticity are called inferior goods. These might include supermarket own brands or fake leather compared to real leather, for example. Write down some other examples of inferior goods.
If the income elasticity is positive, demand increases with real income. These goods are known as normal goods. If your income increases you might choose to buy more clothes or go to the cinema more often, for example. Write down some other examples of normal goods.
The sign reveals whether the good is inferior or normal.
Elasticity is given different names over different numerical ranges. Learn these, and the related diagrams.

Some examples of calculations:
Example 1 - income elasticity of demand
Example 2 - income elasticity of demand
YED and business decisions
 Significance of YED for sectoral change (primary - secondary - tertiary) as economy grows
Economic growth is the increase in productive capacity of the economy and is best measured by the increase in real GDP (output) over a period of time. (Remember that the term real takes into account levels of inflation in an economy).
Typically, as economic growth occurs and real incomes and living standards rise over time, the primary sector tends to become relatively less important, while the secondary and tertiary sectors tend to become relatively more important. Fundamentally, this is because of the importance if YED.
In general, the products of the primary sector e.g. fruit, vegetables, rice, tend to have a low YED i.e. as real incomes rise, there tends to be a less than proportionate rise in demand for these products. No matter how rich you are, there is a limit to how much fruit and vegetables you can eat, so an increase in income may not stimulate a large increase in consumption of these goods. Consequently, the primary agricultural sector is likely to grow only slowly as living standards rise.
However, this would not be true for oil and other extracted minerals such as copper, iron and, also, diamonds and other precious and semi-precious stones, for example. Economies rich in primary resources will find that such products would have a relatively higher YED than basic agricultural products. Minerals, oil and gas, and gems for example, will have a derived demand inasmuch as they will be demanded for their use in the manufacturing sector. A study of a country such as Qatar in the Middle East will demonstrate how the primary sector plays a key and highly lucrative role in its GDP.
The demand for manufactured goods and the services of the tertiary sector, however, tend to have a very high YED. As we become better off, there tends to be a more than proportionate increase in demand for electrical equipment, furniture, banking, travel and tourism etc. Hence the secondary and tertiary sectors grow much more rapidly than the primary sector as living standards rise.
In the more developed countries, the tendency is for the tertiary sector to grow the most rapidly in response to rising real incomes. This is not because people in rich countries fail to buy more manufactured goods as they become better off. Rather, it is often the case that these goods are imported from other countries, often newly industrialised countries, which may be able to produce the manufactured goods with a comparative advantage, i.e. relatively more cheaply.
Thus YED has an important effect on resource allocation within an economy and the speed and nature of sectoral change as countries develop.
Price elasticity of supply

Price elasticity of supply (PES)
The responsiveness of the quantity of a good supplied to changes in its price.
PES - formula
The value for price elasticity of supply is calculated and defined as:
![]()
PES is the % change in quantity supplied of a good or service divided by the % change in its price.
Possible PES values
If you would prefer to view this interaction in a new web window, then please follow the link below:
PES - calculation

Follow the links below to see some sample calculations if you are not sure about how to calculate the value of price elasticity of supply.
Example 1 - price elasticity of supply
Example 2 - price elasticity of supply
Price elasticity of supply measures the ability of a firm to increase or decrease its output in response to a change in price. This sensitivity changes with time, or rather with economic time and the degree of substitutability between factors of production.
Unitary elasticity of supply
Any straight-line supply function that passes through the origin has a coefficient of 1. Look at Figure 1. All the supply functions have an elasticity of 1.
Figure 1 Supply schedules with unitary elasticity
Determinants of PES
If you would prefer to view this interaction in a new web window, then please follow the link below:
PES - primary vs manufactured
 If we look at the PES values for primary commodities and manufactured goods, we can see straight away that generally primary commodities have relatively low PES values (inelastic), while manufactured goods will tend to have higher values (more elastic).
So why is this? Well, if we look back at the determinants of the PES value that we looked at previously, we can start to identify why this might be the case. Let's remind ourselves first of the determinants of the PES value:
- The time period
- The substitutability of factors of production available to the firm
- Level of spare capacity within the firm
- Level of stocks available
In the table below is a comparison of two products - wheat (a primary commodity) and laptops (a manufactured good) - against each of these determinants.
| Determinants | Wheat | Laptop |
|---|---|---|
| The time period | Relatively little opportunity to change supply - once planted, supply is effectively determined for a year | Supply is quite flexible - increased globalisation means increased production capacity can be brought on relatively quickly |
| Substitutability | Very difficult to substitute factors of production | Factors of production relatively easy to substitute |
| Capacity factors | Once fields have been planted for a season, capacity is effectively fixed. Only in the long-run can it be changed significantly. | New capacity can be brought in relatively easily - particularly ina ore global economy |
| Stocks | Relatively perishable and so difficult to hold stocks for any significant period of time | Stocks can be held, though these may date as specifications improve |
This helps us see why primary commodities will generally have a lower elasticity value than manufactured goods where production tends to be more flexible and therefore more elastic.
Summary
Having completed this session you should know and understand that:
1. The responsiveness of supply to changes in price is known as supply elasticity.
2. Elasticity of supply is normally positive.
3. Supply is perfectly inelastic if its coefficient is 0, inelastic if it is between 0 and 1, unitary if it is exactly 1, elastic if it is between 1 and infinity and perfectly elastic if it is infinity.
4. Price elasticity of supply of a product varies with time, economic time (i.e. very short run, short run, long run, very long run). It also depends on the substitutability of the factors of production used in its manufacture.
Section 1.2 Elasticities - questions
In this section are a series of questions on the topic - elasticities. The questions may include various types of questions. For example:
- Self-test questions - on-screen questions that give immediate marking and feedback
- Short-answer questions - a series of short-answer questions to help you check your understanding of the topic
- Numerical - calculation questions
- In the news - questions based around a topical economics news article
Click on the right arrow at the top or bottom of the page to work through the questions.
PED - short-answer

Question 1
'The demand for luxury cars is elastic, but the coefficient for Jaguar cars is higher than that for the luxury part of the car market as a whole'.
Why is this the case?
Question 2
'The price elasticity of demand for commuter rail travel is inelastic but that for vacation rail travel is elastic'. Comment on this fact.
Question 3
An exclusive pen manufacturer sells 4,000 pens per month at a price of £40 each. When the price is reduced to £30 sales increase to 6,000 pens per month.
(a) Calculate the price elasticity of demand for the pens over this price range.
(b) Is demand elastic, unit elastic or inelastic?
(c) Calculate the change in revenue due to the change in price.
Question 4
The table below shows the demand schedule for a good. Complete the following table, using the appropriate equation, with the total expenditure and indicate in the elasticity column whether the good is elastic or inelastic over that price range.
| Price (£) | Demand (per week) | Total expenditure | Elasticity - elastic / inelastic? |
|---|---|---|---|
| 1 | 50 | **** | |
| 2 | 40 | ||
| 3 | 30 | ||
| 4 | 25 | ||
| 5 | 20 | ||
| 6 | 16 | ||
| 7 | 13 | ||
| 8 | 10 | ||
| 9 | 8 | ||
| 10 | 5 |
Price, income and cross elasticity - self-test questions

1 |
Price elasticityA cut in price from $1.50 to $1.20 sees demand for a product rise by 10%. What would the price elasticity of demand be for this product? |
2 |
Price elasticityA firm increases its price from $8 to $12 and sees demand for the product fall by 20%. What would the price elasticity of demand be for this product? |
3 |
Income elasticityWhat type of good would you expected to have a negative income elasticity of demand? |
4 |
Income elasticityIf disposable incomes rise by 5% and the income elasticity of demand is known to be 0.5, what change in demand would we expect to see? |
5 |
Price elasticityIf a price cut does not lead to an increase in revenue, we might infer that the demand for this product is? |
6 |
Price elasticityIf the price elasticity of demand for a product is known to be (-) 2.5 and the firm cuts the price of this product by 5%, what change would we expect to see in the demand for this product? |
7 |
Price elasticityIf the price elasticity of demand for a product is known to be (-) 0.5 and the firm increases the price of this product by 10%, what change would we expect to see in the demand for this product? |
8 |
Price elasticityIf the price elasticity of demand for a product is known to be (-) 2.5 and the firm increases the price of this product by 5%, what change would we expect to see in the demand for this product? |
9 |
Sales in a recessionIn a recession, which sort of good would we expect to see a rise in sales for? |
10 |
Price elasticityA cut in price from $75 to $60 sees demand for a product rise by from 1,200 units to 1,500 units. What would the price elasticity of demand be for this product? |
11 |
Income elasticityIf disposable incomes rise by 2% and the income elasticity of demand is known to be 1.5, what change in demand would we expected to see? |
12 |
Price elasticity
The image below shows a medium size yacht. What would you expect the value of the price elasticity of demand for yachts to be?
|

13 |
Price elasticity
The image below shows cigarettes. What would you expect the value of the price elasticity of demand for cigarettes to be?
|

14 |
Price elasticity
The image below shows wheat being harvested. What would you expect the value of the price elasticity of demand for wheat to be?
|
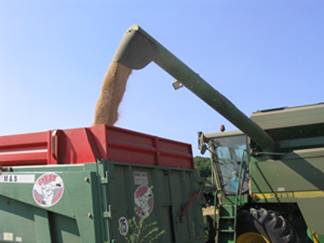
PES - short answer

Question 1
How would you expect the price elasticity of supply for houses to change over time? Explain your answer. (5 marks)
Question 2
Rank the following products according to the value of their price elasticity of supply, starting with the most elastic. Give reasons for your answers.
(a) Computers
(b) Houses
(c) Strawberries
(d) Olives
(e) Ice cream
Inflation soars for staple foods
Read the article Inflation Tough to Digest for Asia as Food Costs Soar From Pork to Onions and then answer the questions below. You can either read the article in the window below or you can follow the previous link to read the article in a separate window.

Question 1
Explain how the factors affecting demand are likely to differ between developed and developing countries.
Question 2
Explain possible values for the price elasticity of demand for staple goods, such as rice, in (a) developed countries and (b) developing countries.
Question 3
Using appropriate diagrams, examine the principal factors that have led to the rapid rise in the price of staple products on world markets.
Question 4
Evaluate the likely success of the Indian government's decision to buy onions from abroad, and to impose an export ban, as a method of reducing the price of onions.

Investigate! Develop an inquiring mind
Global food prices remain high, partly due to increasing fuel prices, and the World Bank's Food Price Index is around its 2008 peak. Since June 2010, an additional 44 million people fell below the $1.25 poverty line as a result of higher food prices. Simulations show that a further 10% increase in the Food Price Index could lead to 10 million people falling into poverty, and a 30% increase could increase poverty by 34 million people. Low-income and lower-middle-income countries are experiencing on average 5% points higher food price inflation compared to better-off countries.
World Bank report 2011
- Investigate the reasons why lower-middle-income countries are experiencing higher food price inflation than better off countries.
- Examine possible actions that can immediately reduce the impact of higher food prices on the poor.

Produce a 500 - 1000 word article for publication in a national magazine, outlining the reasons for global increases in food prices, their effects and possible actions to support those countries and communities most affected.
You may wish to read these additional articles and watch the YouTube video to provide more background:
Food Costs Rising as Coke, Chipotle Pass on Commodity Gains

World Bank: Challenging the Food Crisis
Elastic iPods
Read the article In time of need, Apple's new icon, a nation turns its lonely eyes to you and then answer the questions below. You can either read the article in the window below or you can follow the previous link to read the article in a separate window.

Question 1
Define the term income elasticity of demand.
Question 2
Examine the likely value of the income elasticity of demand for iPods.
Question 3
Analyse
- two goods (other than iPods) that are likely to face an increase in demand and
- two goods that are likely to face a decrease in demand as a result of the US fiscal stimulus.
DaVinci scandal exposes tacky Chinese nouveau tastes
Read the article DaVinci scandal exposes tacky Chinese nouveau tastes and then answer the questions below. You can either read the article in the window below or you can follow the previous link to read the article in a separate window.

Question 1
With the use of an appropriate diagrams compare and contrast Veblen and Giffen goods.
Question 2
Using examples, discuss the extent to which Veblen and Giffen goods exist in real life.
Keep on boating
Read the article Fuel prices not expected to impact boating participation this summer and then answer the questions below. You can either read the article in the window below or you can follow the previous link to read the article in a separate window.

Question 1
Define the term 'cross price elasticity of demand'.
Question 2
Identify the principal determinants of the demand for powerboats.
Question 3
Analyse the main factors that determine the cross price elasticity of demand for powerboats with respect to the price of fuel.
Question 4
Discuss the likely difference between the values of the cross price elasticity of demand for cars with respect to the price of fuel and the cross price elasticity of demand for powerboats with respect to fuel.
Coffee prices remain high
Read the article Coffee prices to remain high and then answer the questions below. You can either read the article in the window below or you can follow the previous link to read the article in a separate window.

Question 1
Identify the main factors that have led to the increase in coffee prices.
Question 2
Using diagrams, as appropriate, illustrate the likely impact of the rise in the price of coffee beans on the market for instant coffee.
Question 3
Comment on the likely value of the price elasticity of demand for instant coffee.
Question 4
Discuss the extent to which coffee producers will be able to pass on the increase in the price of coffee beans to consumers.
SUV's - cross elastic?
Read the article High cost of fuel drives people into smaller cars and then answer the questions below. You can either read the article in the window below or you can follow the previous link to read the article in a separate window.

You may also like to read the following article to support your answer:

Question 1
Describe the main factors that led to a fall in demand for SUVs.
Question 2
Explain the following statement: Petrol and SUV's are complements. SUV's and Hybrids are substitutes.
Question 3
What strategies could the car manufacturers adopt to try to reduce the cross elasticity of demand for SUVs with respect to the fuel price?
Question 4
Explain the external costs that arise from sales of SUVs.
Oil Prices

Oil prices are frequently described as being volatile. They are subject to large variations in prices over time. In the first three months of 2011, Brent crude oil was quoted in the news as being up 28%.
Question 1
What factors are likely to affect the price of crude oil?
Question 3
Draw demand and supply diagrams to show the effect of:
- Rising US demand for oil
- OPEC relaxing quotas on oil to try to prevent the oil price rising further
- Civil unrest in Libya, Bahrain and Syria
Question 4
What would you expect the value of the price elasticity of demand for oil to be? Explain your answer.
Question 5
Analyse the impact that the higher oil price is likely to have on:
- Individual national economies
- The global economy
Scare tactics lift prices for smokers
Read the article Scare tactics lift prices for smokers and then answer the questions below. You can either read the article in the window below or you can follow the previous link to read the article in a separate window.

N.B. the Financial Times online requires registration to access their articles. This is free and allows access to up to 10 articles every 30 days. The following screen will appear when you click on the above link:

Once registered and signed in, the link will go the appropriate article.
The FT is an excellent economics resource and free registration would be beneficial for your studies. E-mail alerts are also possible with registration, which will provide you with instant headlines and information.

Question 1
Given that consumption will likely continue to decline in the mid-single digit range, pricing is necessary to drive top-line growth. Using information from the article, explain this statement.
Question 2
Using diagrams, as appropriate, illustrate the changes that have taken place in the market for cigarettes.
Question 3
Assess the effectiveness of indirect taxation as a tool to improve public health by reducing smoking.
Question 4
Discuss the factors that may lead to a notable shift in demand "elasticity".
Section 1.2 Elasticities - simulations and activities
In this section are a series of simulations and activities on the topic - elasticities. These simulations and activities might include:
- Interactive diagrams - diagrams where you can drag curves or sliders to see the impact of the changes on the diagram
- PlotIT - a chance to build diagrams from data
- Step-by-step - diagrams built up step by step to help you see how to draw them and understand the principles behind the diagram
Click on the right arrow at the top or bottom of the page to move on to the next page.
DragIT - Calculating elasticity
In the diagram below, shift the demand curve to the right by 15 units. Do this by clicking on the 'D1' label and, keeping the mouse pressed, drag it to the right. Note that the slope remains the same (i.e. -5). Once you have done this, try the questions below.

1 |
2 |
DragIT - Elasticity

In this section you can check that you know all the elasticity formulae. In the exercises below, you need to drag the blue buttons on the right onto the orange target areas to build the relevant elasticity formula. Have a go at each in turn. Try to get them right straight away, rather than by trial and error!
Price elasticity of supply
Price elasticity of demand
N.B. A way of remembering this formula is to think of 'dinner (D) on your plate (P)'. In other words demand divided by price.
Income elasticity of demand
Cross elasticity of demand
Price elasticity of demand for exports
Income elasticity of demand for exports
1.3 Government intervention
In the previous sections we explained markets, the rules of supply and demand, market equilibrium, the price mechanism and market efficiency and how demand and supply are used to calculate market price and plot market equilibrium. We then explained the concepts of elasticity. In this section, we consider the role and effects of government intervention in the economy.

By the end of this section you should be able to:
- Explain why governments impose indirect (excise) taxes.
- Distinguish between specific and ad valorem taxes.
- Draw diagrams to show specific and ad valorem taxes, and analyse their impacts on market outcomes.
- Discuss the consequences of imposing an indirect tax on the stakeholders in a market, including consumers, producers and the government.
- Explain why governments provide subsidies, and describe examples of subsidies.
- Draw a diagram to show a subsidy, and analyse the impacts of a subsidy on market outcomes.
- Discuss the consequences of providing a subsidy on the stakeholders in a market, including consumers, producers and the government.
- Explain why governments impose price ceilings, and describe examples of price ceilings, including food price controls and rent controls.
- Draw a diagram to show a price ceiling, and analyse the impacts of a price ceiling on market outcomes.
- Examine the possible consequences of a price ceiling, including shortages, inefficient resource allocation, welfare impacts, underground parallel markets and non-price rationing mechanisms.
- Discuss the consequences of imposing a price ceiling on the stakeholders in a market, including consumers, producers and the government.
- Explain why governments impose price floors, and describe examples of price floors, including price support for agricultural products and minimum wages.
- Draw a diagram of a price floor, and analyse the impacts of a price floor on market outcomes.
- Examine the possible consequences of a price floor, including surpluses and government measures to dispose of the surpluses, inefficient resource allocation and welfare impacts.
- Discuss the consequences of imposing a price floor on the stakeholders in a market, including consumers, producers and the government.

- Explain, using diagrams, how the incidence of indirect taxes on consumers and firms differs, depending on the price elasticity of demand and on the price elasticity of supply.
- Plot demand and supply curves for a product from linear functions and then illustrate and/or calculate the effects of the imposition of a specific tax on the market.
- Plot demand and supply curves for a product from linear functions and then illustrate and/or calculate the effects of the provision of a subsidy on the market.
- Calculate possible effects from the price ceiling diagram, including the resulting shortage and the change in consumer expenditure (which is equal to the change in firm revenue).
1.3 Government Intervention - notes
Introduction
We looked briefly under supply at the impact of a tax and you should be clear now that a tax will shift the supply curve to the left. In fact, it shifts the supply curve vertically upwards by the amount of the tax.
However, we need to look at this in a little more detail as there are different types of taxes:

Specific (or per unit) tax
A specific tax is a fixed amount of tax charged on each unit. A specific tax will shift the supply curve vertically upwards by the amount of the tax. Examples include cigarette, petrol and alcohol taxes.

Ad-valorem tax
A tax that is levied (charged) as a percentage of the selling price. An example of an ad valorem tax would be VAT (Value Added Tax, a sales tax).
The impact of taxation
Ad-valorem and specific taxes will have different effects on the supply curve. First the specific tax. We know that this is a fixed amount which is why Chancellors / Treasury Ministers tend to increase these each year - if they did not they would be losing out. Since it is a fixed amount whatever the price of the good, it will shift the supply curve parallel upwards as shown in Figure 1.
Figure 1 Specific (or unit) tax
However, the ad-valorem tax is a percentage of the selling price. This means that at low prices the tax will be relatively little (10% of $1 is just 10c), but at higher prices the tax levied will be higher (10% of $10 is $1). This means that the supply curve shifts to the left and outwards as price increases. This is shown in Figure 2.
Figure 2 Ad-valorem tax
Tax revenue
If you would prefer to view this interaction in a new web window, then please follow the link below:
Tax incidence

Compare and contrast the two interactions below to see the difference in imposing a tax on a good with inelastic demand and one with elastic demand.
If you would prefer to view this interaction in a new web window, then please follow the link below:
If you would prefer to view this interaction in a new web window, then please follow the link below:

Calculating effects of a specific tax


For higher level, you need to be able to understand how to calculate the impact of indirect taxes on the market equilibrium from demand and supply functions. The presentation below goes through this. Click on the screenshot or link below to open the presentation. It will open in a new web window. You will need a headset or speakers to listen to the explanation.
Indirect taxes

Calculating impact of a tax - example


Assume a linear demand function of the form:
Qd = 120 - 5P
and a linear supply curve of the form:
Qs = -30 + 10P
Using these demand and supply functions, answer the following questions. Once you have had a go at the questions, follow the link below to compare your answers.
- Calculate the quantities demanded and supplied for prices from $3 - $15.
- Plot these figures to give the demand and supply curves for the product.
- Using simultaneous equations, calculate the equilibrium price and output.
- If the government imposes a specific tax per unit of $3, plot the new supply curve on the original supply and demand diagram.
- Use the diagram to find out the new equilibrium price and quantity.
- Calculate the tax revenue received by the government.
- Calculate the revenue received by the firms:
- before the tax
- after the tax
- Calculate consumer expenditure:
- before the tax
- after the tax

The impact of subsidies
If you would prefer to view this interaction in a new web window, then please follow the link below:
Calculating effects of a subsidy

For higher level, you need to be able to understand how to calculate the impact of subsidies on the market equilibrium from demand and supply functions. The presentation below goes through this. Click on the screenshot or link below to open the presentation. It will open in a new web window. You will need a headset or speakers to listen to the explanation.
Subsidies

Calculating effect of a subsidy - example


Assume a linear demand function of the form:
Qd = 120 - 5P
and a linear supply curve of the form:
Qs = -30 + 10P
Using these demand and supply functions, answer the following questions. Once you have had a go at the questions, follow the link below to compare your answers.
- Calculate the quantities demanded and supplied for prices from $3 - $15.
- Plot these figures to give the demand and supply curves for the product.
- Using simultaneous equations, calculate the equilibrium price and output.
- If the government gives a subsidy per unit of $3, plot the new supply curve on the original supply and demand diagram.
- Use the diagram to find out the new equilibrium price and quantity.
- Calculate the amount spent by the government on the subsidy.
- Calculate the revenue received by the firms:
- before the subsidy
- after the subsidy
- Calculate consumer expenditure:
- before the subsidy
- after the subsidy

Price controls
 Price controls are controls that governments (or other authorities) put in place to try to influence the outcome of a market. For example, a government may feel that a price is too high and so set a maximum price for the good or service. An example of this may be rent controls - limits on the maximum rent that a landlord can charge for the use of a property.
Alternatively, a government may feel that the market results in a price that is too low and set a minimum price. An example of this occurs with labour markets where equilibrium wages can be very low and governments set a minimum wage. We look at this case in the section - minimum prices.
Markets can also be very unstable and this may persuade governments to try to intervene to stabilise the markets. This is particularly true with agricultural markets and we look at this situation in the section - intervention in agricultural markets.
Price ceilings
If you would prefer to view this interaction in a new web window, then please follow the link below:
Calculate effects of price ceiling


For higher level, you need to be able to use a price ceiling diagram to be able to calculate changes in consumer expenditure. The presentation below goes through this. Click on the screenshot or link below to open the presentation. It will open in a new web window. You will need a headset or speakers to listen to the explanation.

Price ceiling

Calculating effect of a price ceiling - example


Assume a linear demand function of the form:
Qd = 85 - 5P
and a linear supply curve of the form:
Qs = -20 + 10P
Using these demand and supply functions, answer the following questions. Once you have had a go at the questions, follow the link below to compare your answers.
- Calculate the quantities demanded and supplied for prices from $1 - $15.
- Plot these figures to give the demand and supply curves for the product.
- Using simultaneous equations, calculate the equilibrium price and output.
- The government then imposes a price ceiling of $4 on the market. Show this on the diagram.
- Calculate the excess demand as a result of this price ceiling.
- Calculate the level of consumer expenditure:
- before the price ceiling was imposed
- after the price ceiling was imposed

Price floors
If you would prefer to view this interaction in a new web window, then please follow the link below:
Minimum wage
Many countries have now set a minimum wage. A minimum wage was first enacted in New Zealand in 1894 and there is now legislation setting minimum wages in more than 90% of all countries. The effect of a minimum wage will be very similar to that of a minimum price.
Assuming that the minimum wage is above the equilibrium level, wages will rise to the minimum wage level, but the number of employees will fall (to Qd in Figure 2), at least in the short run.
Figure 2 Impact of a minimum wage
However, the extent of the unemployment will depend on the elasticity of demand for and elasticity of supply of labour. If both are very inelastic then there may be very little unemployment. Don't worry, this will be more fully explained later!
If the substitutability of labour is very low (in other words employers cannot substitute capital (machines) for labour), then this should help minimise the impact on unemployment.
However, unscrupulous employers may well employ workers illegally and pay less than the minimum wage. An informal market is again created. This is often found where countries have a large number of illegal immigrants.

Task
Use the web to find out if there is a minimum wage in your country. If there is, try to answer the following questions.
- What is the level of the minimum wage?
- What age does it start at?
- Are there any exceptions where employers are allowed to pay below the minimum wage?
- How much has it increased in real terms (compared to inflation) in the last five years?
Calculate effects of price floor


For higher level, you need to be able to use a price floor diagram to be able to calculate changes in consumer expenditure, firm's revenue and the cost to the government of buying any surplus. The presentation below goes through this. Click on the screenshot or link below to open the presentation. It will open in a new web window. You will need a headset or speakers to listen to the explanation.

Price floor

Calculating effect of a price ceiling - example


Assume a linear demand function of the form:
Qd = 95 - 5P
and a linear supply curve of the form:
Qs = -40 + 10P
Using these demand and supply functions, answer the following questions. Once you have had a go at the questions, follow the link below to compare your answers.
- Calculate the quantities demanded and supplied for prices from $1 - $15.
- Plot these figures to give the demand and supply curves for the product.
- Using simultaneous equations, calculate the equilibrium price and output.
- The government then imposes a price floor of $4 on the market. Show this on the diagram.
- Calculate the excess supply as a result of this price floor.
- Calculate the level of consumer expenditure:
- before the price floor was imposed
- after the price floor was imposed
- Calculate how much the government would have to spend to purchase the excess supply as a result of the price floor.

Intervention in agricultural markets
 One area where national governments and the EU intervene extensively is in agricultural markets. The aim of this intervention is normally to guarantee farmers a stable and secure income as agricultural markets can fluctuate significantly. One of the largest intervention schemes is the Common Agricultural Policy (CAP) run by the European Union (EU).
Commodity agreements
These may take the form of attempts to stabilise prices, through the operation of a buffer stock scheme or attempts to raise prices by forming a producers' cartel and restricting supply through the use of quotas.
Buffer stock schemes
Firstly, we will consider the operation of buffer stock schemes that have existed on and off since the 1920s for a range of commodities including wheat, tin, rubber, coffee, sugar and cocoa. All of these have eventually failed for one reason or another, so there are no prominent examples to consider.
So, what is a buffer stock scheme?
Buffer stock schemes are operated by a central authority (buffer stock agency) and aim to stabilise prices and protect producers from sudden shifts in demand and supply (often supply in the case of agriculture). This is done by the buffer stock agency intervening in the market. If there is too much supply, forcing the price down, the buffer stock agency will increase demand by buying up stocks and price will be pushed up again. If there is a shortage of supply, forcing the price up, the agency will release stocks onto the market forcing the price down. This can, of course, only occur for products that can be stored.
A buffer stock makes use of a price band. Figure 1 below shows the effect of setting up a buffer stock scheme for coffee. If the market is within the two boundaries set by the agency, no action is taken. However, if the market price moves outside the boundaries, the buffer stock operators will intervene.
Figure 1 Buffer stock for coffee
If there is a very good harvest of coffee, the supply curve will shift to the right and the price would fall below the boundary. The buffer stock operators would then step in to increase demand to keep the price within the boundary. This is shown in Figure 2 below.
Figure 2 Buffer stock - good harvest
The bumper harvest causes the supply curve to shift to S1. This would initially cause the price to fall below the lower boundary to OP1. By buying up stocks, the agency shifts the demand curve to D1 and brings price back within the upper and lower boundaries to OP2.
If there is a poor harvest of coffee, the supply curve will shift to the left and the price would increase above the upper boundary. The buffer stock operators would then step in to increase supply by selling stocks and this would push price down below the upper boundary. This is shown in Figure 3 below:
Figure 3 Buffer stock - poor harvest
Problems of a buffer stock scheme
There are a number of possible problems related to buffer stock schemes and these may include:
- Problems of storage, storage and administration costs and perishability, particularly if there are too many years of bumper harvests.
- Difficulty of setting appropriate floor and ceiling prices. If buffer stock managers have to consistently intervene at the floor price, they will have to keep buying and may run out of finance. If they have to keep intervening at the ceiling price, they will run out of stocks to put on the market.
- Problems of inadequate supplies if there are too many years of bad harvests.
- Problems of financing the buffer stock if there are too many years of good harvest - funds have to be contributed by the members.
- Problems of keeping prices artificially high if there are close substitutes available, e.g. rubber/rubber substitutes
- Difficulties in maintaining the agreement on prices in that some producers may be underproducing and could improve their individual position by cutting price and raising output. This is particularly the case where producers are scattered in different countries.
Cartel arrangements
Such schemes have been attempted in the case of rubber, tin, coffee and sugar, and involve the formation of a single selling organisation, i.e. a cartel, to restrict output of individual members through the issuing of quotas. Thus, when prices need to be increased, members would be ordered to reduce their output in accordance with their quota allocation. This is illustrated in Figure 3 below.
Figure 3 Cartel - use of quotas to restrict output
The supply of primary commodities tends to be perfectly inelastic in the short run, so the cartel requiring a reduction in output would shift the supply curve to the left from S to S1 and raise the price from OP to OP1.
Such schemes have suffered from some of the same problems that have beset buffer stock schemes, i.e. problems of maintaining the cartel and the switch towards substitute goods if prices are kept too high.
Common Agricultural Policy

Common Agricultural Policy (CAP) - subsidies, price floors and buffer stocks
 The Common Agricultural Policy was created by the Treaty of Rome in 1957 and introduced in 1962. It was designed to offer minimum guaranteed prices to European farmers to ensure a consistent and reliable supply of food throughout the European community. The historical context was the 'Cold War' and the Berlin crisis and the desire by European Governments to ensure food supplies were maintained and available in times of war and political crisis. However, as political tensions reduced, the CAP essentially became a mechanism to control the production and price of food within the EU, using subsidies as its main policy instrument.
The CAP was based on the economic principle of a 'price floor'. Farmers were guaranteed a price for each unit of output regardless of amount produced; if farmers could double or treble output, they could double or treble their income. When market prices fell below an agreed level, the community intervened to buy surplus farm output. These buffer stocks were supposed to be used in time of food shortages. The CAP certainly helped reduce Europe's reliance on imported food, but in practice, technological advances soon led to massive over-production and the creation of the now legendary 'mountains' and 'lakes' of surplus food and drink. These became so substantial and politically sensitive, that the EU was forced to introduce the concept of 'set-aside' to reduce these large and costly surpluses by paying farmers not to grow certain crops.
Although the concept of the CAP is simple, its operation is not. The CAP has become one of the most controversial European Union policies. Almost 90% of the European Union (EU) land area is considered to be rural in nature, with 26% of the population living there. At one stage nearly three quarters of the entire EU budget was spent on farming. After several reforms this figure has been cut to approximately one third of the budget, but there is still pressure to lower this further as farming only employs 5% of the EU workforce and contributes less than 3% of the total EU Gross Domestic Product.
Supporters of the CAP argue that it helps to ensure affordable food with the average EU household presently devoting 15% of its expenditure to food compared to 30% in 1960. They also maintain that the policy is crucial to sustaining rural communities claiming many farmers would have gone out of business if it were not for EU support.
CAP generates much hostility across Europe. There are many organisations and individuals that oppose the Common Agricultural Policy both in its operation and in principle.
Critics of the CAP identify significant problems, arguing that:
- surpluses are a waste of scarce resources
- high prices prevent fair trade and make it difficult for farmers in the developing world to compete in EU agricultural markets
- inequalities in agriculture are increased
- high food prices penalise the poorer members of society
- the policy has had damaging effects on the environment as it encourages over-production at the guaranteed price regardless of environmental impacts
- many of the surpluses generated are 'dumped' on world markets, distorting those markets and increasing the divide between rich and poor nations further
How EU farm policy hurts poor countries: Daniel Hannan, MEP
Since 2005, farmers are no longer subsidised to maintain production, but instead receive a lump-sum called the Single Farm Payment (SFP) designed to match supply to consumer demand, with farmers now paid for their role as guardians of the countryside.
In May 2008, following a major review by the European Commission, set-aside was abolished with farmers now subsidised to grow crops for biofuels, which are considered more environmentally friendly than fossil fuels. The CAP is due to be reviewed again in 2013 and there is speculation that reforms could shift spending from the CAP towards innovation, climate and energy.

You may also like to read the following articles:
1.3 Government intervention - questions
In this section are a series of questions on the topic - government intervention. The questions may include various types of questions. For example:
- Self-test questions - on-screen questions that give immediate marking and feedback
- Short-answer questions - a series of short-answer questions to help you check your understanding of the topic
- Numerical - calculation questions
- In the news - questions based around a topical economics news article
Click on the right arrow at the top or bottom of the page to work through the questions.
Markets - essay

Question 1
(a) Explain the role of prices in allocating scarce resources in a market economy.
(b) Discuss the view that that the use of maximum and minimum price controls only serve to distort markets and bring about a misallocation of resources.
Price controls - short answer

Question 1
The table below gives the levels of demand and supply for a good.
| Price (£) | Demand ('000 per month) | Supply ('000 per month) |
|---|---|---|
| 11 | - | 200 |
| 10 | 30 | 180 |
| 9 | 60 | 160 |
| 8 | 90 | 140 |
| 7 | 120 | 120 |
| 6 | 150 | 100 |
| 5 | 180 | 80 |
| 4 | 210 | 60 |
| 3 | 240 | 40 |
| 2 | 270 | 20 |
| 1 | 300 | - |
(a) Draw the demand and supply curves on a graph.
(b) What is the equilibrium price and quantity?
(c) If the government supports a minimum price of £10, by how much does supply exceed demand?
(d) If the government controls the price at a maximum of £3, by how much does demand exceed supply?
(e) If the government placed a subsidy of £5 per unit on this good, what would be the new equilibrium price and quantity?
(f) How much would this subsidy cost the government per month?
Question 2
The diagram below represents the market for olives.
The market for olives
The Italian government decides to protect the production of olives and they agree to set a minimum price. Any olives that are left unsold at the minimum price, the government will buy.
(a) What is the equilibrium price in the absence of any intervention?
(b) If the government set a minimum price of P3, what would be the equilibrium market price?
(c) What would be the level of demand at this price?
(d) If the government set a minimum price of P1, what would be the market price?
(e) What would be the level of olives demanded at this price?
(f) What would be the level of olives supplied at this price?
(g) How many olives would the government have to buy if the minimum price was P1?
(h) Copy the diagram and shade the area that represents the total spending by consumers on olives at a price of P1.
(i) On the same diagram, show the level of government spending on excess olive production.
Price controls - numerical (1)


Question 1
If demand can be shown by a linear demand function of the form Qd = 155 - 10P and supply can be shown by a linear supply function of Qs = -50 + 10P, calculate the quantities demanded and supplied at prices between $1 and $15.
The government puts in place a price ceiling of $8 per unit.
Question 2
What will be the excess demand in the market as a result of the price ceiling?
Question 3
Calculate consumer expenditure:
- Before the price ceiling was imposed.
- After the price ceiling was imposed.
Question 4
Calculate the firm's revenue:
- Before the price ceiling was imposed.
- After the price ceiling was imposed.

Price controls - numerical (2)


Question 1
If demand can be shown by a linear demand function of the form Qd = 35 - 2P and supply can be shown by a linear supply function of Qs = -20 + 4P, calculate the quantities demanded and supplied at prices between $1 and $15.
The government puts in place a price floor of $8 per unit.
Question 2
What will be the excess supply in the market as a result of the price floor?
Question 3
Calculate consumer expenditure:
- Before the price floor was imposed.
- After the price floor was imposed.
Question 4
Calculate the firm's revenue (assuming the government purchases the surplus):
- Before the price floor was imposed.
- After the price floor was imposed.
Question 5
Calculate the amount the government will need to spend to purchase the surplus that arises as a result of the price floor.

Calculating impact of a tax - numerical


Assume a linear demand function of the form:
Qd = 80 - 5P
and a linear supply curve of the form:
Qs = -10 + 5P
Using these demand and supply functions, answer the following questions.
Question 1
Calculate the quantities demanded and supplied for prices from $1 - $15.
Question 2
Plot these figures to give the demand and supply curves for the product.
Question 3
Using simultaneous equations, calculate the equilibrium price and output.
Question 4
If the government imposes a specific tax per unit of $4, plot the new supply curve on the original supply and demand diagram. Use the diagram to find out the new equilibrium price and quantity.
Question 5
Calculate the tax revenue received by the government.
Question 6
Calculate the revenue received by the firms:
- before the tax
- after the tax
Question 7
Calculate consumer expenditure:
- before the tax
- after the tax

Calculating impact of a subsidy - numerical


Assume a linear demand function of the form:
Qd = 160 - 10P
and a linear supply curve of the form:
Qs = -40 + 15P
Using these demand and supply functions, answer the following questions.
Question 1
Calculate the quantities demanded and supplied for prices from $1 - $15.
Question 2
Plot these figures to give the demand and supply curves for the product.
Question 3
Using simultaneous equations, calculate the equilibrium price and output.
Question 4
If the government gives a subsidy per unit of $5, plot the new supply curve on the original supply and demand diagram. Use the diagram to find out the new equilibrium price and quantity.
Question 5
Calculate the amount spent by the government on the subsidy.
Question 6
Calculate the revenue received by the firms:
- before the subsidy
- after the subsidy
Question 7
Calculate consumer expenditure:
- before the subsidy
- after the subsidy

Agricultural markets - essay

Intervention in agricultural markets
Question 1
(a) Agricultural prices tend to fluctuate much more than the price of manufactured goods. Explain how a buffer stock scheme can help overcome this problem.
(b) "Intervention in agricultural markets is always for the good". Do you agree? Justify your answer.
Cheap petrol
Read the article The problem with insanely low petrol prices and then answer the questions below. You can either read the article in the window below or you can follow the previous link to read the article in a separate window.

Question 1
Using diagrams, as appropriate, show how the fuel subsidy in Venezuela affects the market for petrol.
Question 2
Analyse the impact on economic efficiency of the Venezuelan fuel subsidy.
Question 3
Discuss the environmental impact of the Venezuelan fuel subsidy.
World's food system is broken
Read the article World's food system broken, Oxfam warns and then answer the questions below. You can either read the article in the window below or you can follow the previous link to read the article in a separate window.

Question 1
Using diagrams, as appropriate, explain why world food prices have been rising significantly.
Question 2
Examine the likely impact of the increase in food prices on the levels of (a) relative poverty and (b) absolute poverty in the developed and developing world.
Question 3
Analyse the impact of rising food prices on the rate of economic development in the developing world.
Question 4
Discuss two policies that could be adopted by governments and the international community to alleviate the impact of rising food prices.


Extension activity
Is the famine in the Horn of Africa, described in these articles and video, a natural disaster or a consequence of man-made economic and political decisions?
Use the following articles and video as a starting point for your investigation.
- Biofuel demand in US driving higher food prices, says report
- Horn of Africa drought: interactive map
- Somalia's 'children's famine' has been ignored

Somalia suffering famine, declares UN - video
China plans price controls to curb inflation
Read the article China plans price controls to curb inflation and answer the questions below. You can either read the article in the window below or you can follow the previous link to read the article in a separate window.

You may also wish to read the following article to support your answers:

Question 1
Define the following terms:
- inflation rate
- interest rates
Question 2
Using diagrams, as appropriate, illustrate the way in which price controls can be used to control food price rises in China.
Question 3
Analyse the impact on consumers of the imposition of price controls on food markets in China.
Question 4
Discuss the role likely effectiveness of price controls as a tool to reduce the level of inflation.
Bolivian fuel shortages
Read the article Bolivia Restores Subsidies for Fuel and then answer the questions below. You can either read the article in the window below or you can follow the previous link to read the article in a separate window.

You may wish to read the additional following articles to help you answer the questions:

Question 1
Using diagrams, as appropriate, explain the reasons for fuel shortages in Bolivia.
Question 2
Using diagrams, as appropriate, illustrate the impact of Bolivia's fuel subsidies on the market for diesel.
Question 3
Discuss the role of nationalisation in the fuel shortages faced by Bolivia.
Japanese rice subsidies
Read the article Japan rice stockpiles to reach the highest in eight years in 2011 and then answer the questions below. You can either read the article in the window below or you can follow the previous link to read the article in a separate window.

Question 1
Using diagrams, as appropriate, describe the methods used by the Japanese government to protect Japanese rice farmers.
Question 2
Explain the reasons for the decline in demand for rice.
Question 3
Analyse the advantages and disadvantages of these subsidies for (a) consumers, (b) Japanese rice farmers and (c) overseas farmers.
Question 4
Evaluate one other strategy that the Japanese government could use to protect the income levels of their rice farmers.
Coffee shortages in Venezuela
Read the article Venezuelan shoppers face food shortages and then answer the questions below. You can either read the article in the window below or you can follow the previous link to read the article in a separate window.

Question 1
Using supply and demand diagrams, as appropriate, show why there have been coffee shortages in Venezuela.
Question 2
Discuss the effectiveness of price controls as a policy to reduce inflation.
Question 3
Analyse the impact of the price controls on Venezuela's major economic targets.
1.3 Government intervention - simulations and activities
In this section are a series of simulations and activities on the topic - government intervention. These simulations and activities might include:
- Interactive diagrams - diagrams where you can drag curves or sliders to see the impact of the changes on the diagram
- PlotIT - a chance to build diagrams from data
- Step-by-step - diagrams built up step by step to help you see how to draw them and understand the principles behind the diagram
Click on the right arrow at the top or bottom of the page to move on to the next page.
DragIT - Incidence of tax
In this interaction, drag the end of the demand curve up and down to see the impact of a change in the elasticity of demand on the tax revenue received by the government and the incidence of the tax on the firm and on the consumer. The tax revenue is the sum of the two areas - consumer share and firm share.
In this next interaction, drag the end of the supply curve up and down to see the impact of a change in the elasticity of supply on the tax revenue received by the government and the incidence of the tax on the firm and on the consumer. Again, the tax revenue is the sum of the two areas - firm and consumer.

1 |
Incidence of taxThe more elastic the demand curve the lower the consumers share of the tax will be. |
2 |
Incidence of taxThe more inelastic the supply curve the lower the producer share of the tax will be. |
3 |
Incidence of taxThe more inelastic the demand curve the higher the producer share of the tax will be. |
DragIT - Tax revenue
The following interaction illustrates the effects of a change in tax rates on the revenue received by the government. Remember that the effect of a tax is to shift the supply curve upwards by the amount of the tax per unit.
Click on the "S2" label and drag the supply curve S2 to the left and back to see the impact of a change in the level of taxation on the tax revenue.

1 |
Tax revenueAs the tax per unit rises the equilibrium quantity will fall. |
DragIT Maximum prices
Government may set a ceiling for prices below the market equilibrium in order to benefit consumers. This is referred to as a 'maximum' price because suppliers are not allowed to charge a higher price. In the UK, the price of a standard loaf of bread was set by the government right up to the early 1970s. Low maximum prices are often used in developing countries as a means of helping the large numbers of urban poor.
Assume that the domestic market price for wheat is £5 (which is also the world price of wheat). In the diagram below drag the 'low maximum price' line to a level that reduces this country's market price of wheat by 20 per cent.

1 |
Maximum pricesIn the above situation which of the following will be true? (Select all those statements which are true) |
2 |
Maximum pricesIn the above situation, which of the following will be true? (Select all those statements which are true) |
DragIT - Intervention in agricultural markets
Added to the problems of price fluctuations and relative declining income that they have faced, most European farmers have also suffered from growing competition from other food-exporting nations around the world (e.g. USA, Canada, Australia and parts of Africa). One solution to this specific problem would be to set a tariff on all imported products that compete directly with domestic producers.
The following diagram shows the domestic demand and supply for wheat in a given country. The world price of wheat is £3 per tonne (shown by the horizontal red line).

1 |
Import tariffWhat will be the level of domestic production at a world price of £3 per tonne? |
2 |
Import tariffWhat will be the level of imports at a world price of £3 per tonne? |
3 |
Import tariffWhat will be the level of imports at a world price of £4 per tonne? |
DragIT - Intervention in agricultural markets (2)
The Common Agricultural Policy (CAP) has traditionally used high minimum prices as the means of supporting the European farming community.
The following diagram is the same as the one we had before. It shows the demand and supply for wheat in a given country. The world price of wheat is £3 per tonne (shown by the horizontal red line). Given this low price for wheat, domestic production is 15,000 tonnes per annum, yet demand is 35,000 tonnes per annum. As a result this country imports 20,000 tonnes of wheat per annum.
Drag the horizontal red line upwards to represent the setting of a high minimum price that would result in the country now having a surplus of 10,000 tonnes of wheat per annum (a surplus that is then exported).

1 |
Import tariffWhat will be the revenue of domestic wheat farmers before the policy change? |
2 |
Import tariffWhat will be the price charged after the policy change? |
3 |
Import tariffWhat will be the revenue of domestic wheat farmers after the policy change? |
4 |
Import tariffHow much has consumer expenditure on wheat risen by? |
5 |
Import tariffAssume that as a result of the policy, the world price of wheat has fallen to £2 per tonne, and that the government buys any surplus and then exports it at the world price. What will be the taxpayers contribution to this policy? |
1.4 Market failure
In the previous sections we explained markets, the rules of supply and demand, market equilibrium, the price mechanism and market efficiency and how demand and supply are used to calculate market price and plot market equilibrium. We then explained the concepts of elasticity and considered the role and effects of government intervention in the economy. In this section we examine the concept of market failure.
By the end of this section you should be able to:

- Analyse the concept of market failure as a failure of the market to achieve allocative efficiency, resulting in an overallocation of resources (overprovision of a good) or an under-allocation of resources (under-provision of a good).
- Describe the concepts of marginal private benefits (MPB), marginal social benefits (MSB), marginal private costs (MPC) and marginal social costs (MSC).
- Describe the meaning of externalities as the failure of the market to achieve a social optimum where MSB = MSC.
- Explain, using diagrams and examples, the concepts of negative externalities of production and consumption, and the welfare loss associated with the production or consumption of a good or service.
- Explain that demerit goods are goods whose consumption creates external costs.
- Evaluate, using diagrams, the use of policy responses, including market-based policies (taxation and tradable permits), and government regulations, to the problem of negative externalities of production and consumption.
- Explain, using diagrams and examples, the concepts of positive externalities of production and consumption, and the welfare loss associated with the production or consumption of a good or service.
- Explain that merit goods are goods whose consumption creates external benefits.
- Evaluate, using diagrams, the use of government responses, including subsidies, legislation, advertising to influence behaviour, and direct provision of goods and services.
- Using the concepts of rivalry and excludability, and providing examples, distinguish between public goods (non-rivalrous and nonexcludable) and private goods (rivalrous and excludable).
- Explain, with reference to the free rider problem, how the lack of public goods indicates market failure.
- Discuss the implications of the direct provision of public goods by government.
- Describe, using examples, common access resources and sustainability.
- Explain that the lack of a pricing mechanism for common access resources means that these goods may be overused/depleted/degraded as a result of activities of producers and consumers who do not pay for the resources that they use, and that this poses a threat to sustainability.
- Explain, using negative externalities diagrams, that economic activity requiring the use of fossil fuels to satisfy demand poses a threat to sustainability.
- Explain that the existence of poverty in economically less developed countries creates negative externalities through over-exploitation of land for agriculture, and that this poses a threat to sustainability.
- Evaluate, using diagrams, possible government responses to threats to sustainability, including legislation, carbon taxes, cap and trade schemes, and funding for clean technologies.
- Explain, using examples, that government responses to threats to sustainability are limited by the global nature of the problems and the lack of ownership of common access resources, and that effective responses require international cooperation.

- Explain, using examples, that market failure may occur when one party in an economic transaction (either the buyer or the seller) possesses more information than the other party.
- Evaluate possible government responses, including legislation, regulation and provision of information.
- Explain how monopoly power can create a welfare loss and is therefore a type of market failure.
- Discuss possible government responses, including legislation, regulation, nationalization and trade liberalization.
1.4 Market failure - notes
 Market failure is a situation in which the free market leads to a misallocation of society's scarce resources in the sense that either overproduction or underproduction of a particular good occurs, leading to a less than optimal outcome.
Reasons for market failure
The reasons for market failure include:
- Positive and negative externalities
- Lack of public goods
- Under-provision of merit goods
- Over-provision of demerit goods
- Abuse of monopoly power
- Inequality
In this section we consider the following topics in detail:
- Positive and negative externalities
- How do externalities affect allocative efficiency?
- Possible government responses
- Public goods
- Merit goods
- Demerit goods
- Abuse of monopoly power
- Inequality
The meaning of externalities
What are externalities?

Externalities
Externalities are costs (negative externalities) or benefits (positive externalities), which are not reflected in free market prices. Externalities are sometimes referred to as 'by-products', 'spillover effects', 'neighbourhood effects' 'third-party effects' or 'side-effects', as the generator of the externality, either producers or consumers, or both, impose costs or benefits on others who are not responsible for initiating the effect.
 The key feature of an externality is that it is initiated and experienced, not through the operation of the price system, but outside the market.
Proponents of laissez-faire would argue that externalities particularly arise because of the absence of markets - as no markets exist for such things as clean air and seas, beautiful views or tranquillity, economic agents are not obliged to take them into account when formulating their production and consumption decisions, which are based on private costs and benefits i.e. those which are internal to themselves. Another way of putting this is to say individuals have no private property rights over such resources as the air, sea and rivers, and thus ignore them in making their production and consumption decisions.
Property rights refer to those laws and rules that establish rights relating to:
- ownership of property;
- access to property;
- protection of property ownership;
- the transfer of property.
Thus a firm may feel free to dump effluent into a river as the spoiling of the environment and the killing of fish is not a cost that it would directly have to bear. Those on the political left would be more likely to argue that such an externality would arise because of the market system which is based upon the private ownership of resources, with individuals acting in their own self interest and therefore not having to consider what is in the public interest i.e. the problem is due to an absence of communal property rights and of a system of planned production.
Types of externalities
Pollution is an example of an externality which is commonly cited, but it is important to establish at this stage that there are various types of externalities and that they can be classified in different ways: they can arise from acts of consumption or production, and can thus be production, consumption or mixed externalities, and, as previously mentioned they can be experienced as external costs (negative externalities) or as external benefits (positive externalities).
Figure 1 below summarises the different possibilities and provides some examples. It can be seen from this table that there are in fact four different varieties of externality:
A) a production externality: initiated in production and received in production;
B) a mixed externality: initiated in production, but received in consumption;
C) a consumption externality: initiated in consumption and received in consumption;
D) a mixed externality: initiated in consumption, but received in production.
Each of these are sub-divided into two, according to whether they are experienced as an external cost or as an external benefit, giving a total of eight varieties.
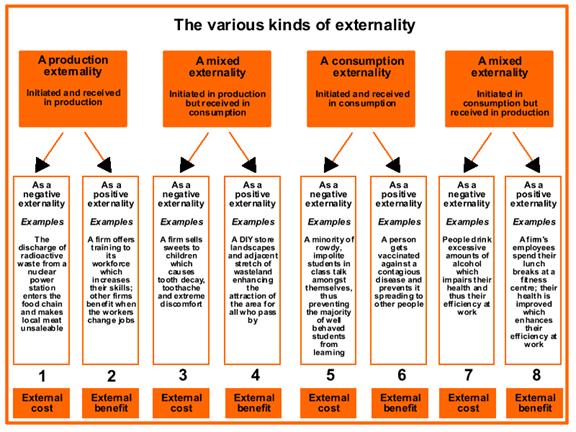
Figure 1 The various kinds of externality
In practice, the most important externalities are those which affect the environment, and it is these which have received widespread adverse publicity in recent years, and which have prompted the rise of 'green' pressure groups and political parties. Indeed, so great has been the impact of environmental pollution, that in addition to the externalities identified in figure 1, we can also, in a global context, identify externalities which are transmitted from one country to another, and that may be mutually damaging; for example, the Chernobyl nuclear disaster in 1986 in Russia, not only contaminated the local area, but also polluted other parts of Europe; emissions of acid rain from West European nations not only harm the environment in the initiating countries, but also wreak havoc on the forests, lakes and rivers of the Scandinavian countries. The recent earthquake in Japan and the dangerously high levels of radiation is another example of such externalities.
Task 1
Try adding a further example of your own to each of the eight types of externality given in figure 1.
Task 2
Try matching the following examples of externalities to each type of externality in figure 1 (Hint - there is one example of each). Once you have had a go, have a look at our answer to see how you got on.
- A person smoking a pipe at a football match causes the person sitting behind to passively smoke.
- A large retail organisation attracts numerous extra customers to its store, some of whom spend money in other shops in the vicinity (maybe a shopping mall).
- Children are taken to school by car instead of walking or using public transport. This worsens congestion and raises the production costs of firms.
- Owner occupiers (people who own their own houses/apartments) in a particular area take measures to increase the value of their properties. Estate agents benefits from the extra commission earned when the houses are sold.
- Juggernauts (large trucks/lorries) travel through inner city areas, causing traffic congestion for other commercial road users that raises their production costs.
- A power station emits black fumes into the air that discolours the paintwork of nearby houses.
- Farmers provide pathways in the countryside that benefit walkers.
- A private gardener plants an assortment of beautiful plants in her front garden and enhances the environment for her neighbours and passers-by.
Task 2 - suggested answers
How do externalities affect allocative efficiency?
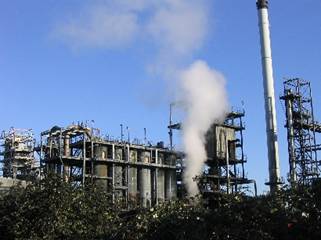 Given the existence of perfect competition, allocative efficiency would automatically occur where price equals marginal cost in all markets, assuming that neither negative nor positive externalities are present.
So, how do externalities affect our condition for efficiency? Let's consider case of a firm which discharges its waste products into a river. Such a firm would be treating the environment as a free resource, and would be imposing a cost on society as a whole, rather than just on the consumers of the good. The price charged to consumers would not therefore, in this instance, reflect the true cost of the product; if the firm were compelled to install equipment which could treat its effluent and render it harmless to the environment, its production costs and prices would rise and consumers would, as a consequence, reduce their demand for the product in question. Resources would then be reallocated to other lines of production.
In this case there is a divergence between private and social cost.
- The private cost is the internal money cost of production incurred by the firm i.e. costs such as wages, raw materials, heating and lighting that must be paid to carry out production, and which would appear in the firm's accounts.
- The social cost, on the other hand, is the real cost to society as a whole; it is the private, internal costs plus the value of the negative externalities (external costs).
Similarly, if the firm's production decisions were to generate positive externalities, such as the beneficial effects arising from the provision of employment, then there would be a divergence between private and social benefit.
- The private benefit is the money value of the benefits accruing internally to the firm from production activity e.g. in the form of sales revenues.
- The social benefit, on the other hand, is the private benefit plus the value of positive externalities (external benefits).

Social cost
Social cost is the private, internal cost plus the value of negative externalities.

Social benefit
Social benefit is the private, internal benefits plus the value of positive externalities.
Now, the significance of this analysis is that allocative inefficiency will occur if private cost or benefit diverges from social cost or benefit. Where externalities exist the condition for allocative efficiency is that price = social marginal cost = social marginal benefit i.e. the price must equal the true marginal cost of production to society as a whole, rather than just the private marginal cost.
We will now illustrate the above in relation to the firm discharging waste into the river.
Hence externalities cause market failure:
- when a negative production externality is initiated, the firm will not be made to pay for the cost imposed on others, and will therefore have no market incentive to produce less; from society's standpoint it will therefore overproduce;
- when a positive externality arises, the firm will lack any incentive to increase its output to the socially desirable level, as it does not receive any payment for the generation of the external benefit; underproduction therefore occurs.
Negative externalities of production
If you would prefer to view this interaction in a new web window, then please follow the link below:
Negative externalities of consumption
If you would prefer to view this interaction in a new web window, then please follow the link below:
The economic theory of traffic congestion
Figure 1 below shows how the analysis of externalities that we looked at in the previous section can be applied to the problems of traffic congestion.
Figure 1 Road transport, congestion and economic theory
Economic theory can be used to analyse the issues involved in traffic congestion as shown here. Figure 1 indicates the relationship between the cost of travel and the flow of traffic along a particular route. The essence of this theory is based on the fact that, when making a journey by car, a motorist only considers the marginal private cost (MPC). This is the cost directly attributable to him/herself, such as time, fuel and the maintenance of the vehicle, rather than the full cost of the journey, which may include costs imposed on society such as pollution, noise and time lost due to congestion. When added to the private costs, these are termed the marginal social costs (MSC), the difference between the two representing the externality imposed by the motorist.
 In outlining the theory, it is assumed that, when making a journey, congestion is the only externality. The graph represents the demand for travel along a particular stretch of road over a period of time. Up to a flow of traffic F0, there is no congestion, thus there is no divergence between MPC and MSC, although in reality, such a situation only applies to extremely low volumes of traffic.
As the flow of traffic increases above F0, congestion is apparent and there is a divergence between MSC and MPC. Note that the MSC is equal to the MPC, plus the social cost of congestion.
If the demand for travel on this particular route is of the normal shape (represented by D on the graph) and is a measure of the marginal benefit, then the flow of traffic will be determined by the intersection of the demand curve and the MPC curve at F1 and the private cost to the motorist will be b. At a flow of F1, the external cost, not taken into account by the motorist, is ab (the difference between the MPC and MSC). This means that resources are not being allocated efficiently and that individuals are making more journeys than they would if they were aware of the full social costs.

To get some up to date examples on traffic congestion, try searching the Biz/ed In the News archive. You can do this in the window below.
Try searching on terms like:
- Congestion
- Traffic
- Externalities
Demerit goods
 What are demerit goods?
Demerit goods are goods which are deemed to be socially undesirable, and which are likely to be over-produced and over-consumed through the market mechanism. Examples of demerit goods are cigarettes, alcohol and all other addictive drugs such as heroine and cocaine.
The problem arises from the fact that so long as an effective demand is present, such goods are, in all probability, going to be extremely profitable to produce, and this is all that a price system takes into account - the market neither possesses a 'heart' to enable it to help those in need, nor is it inherently able to make value judgements about which commodities are good or bad for society as a whole: it is prices and profits which act as the 'guiding light' to resource allocation.
However, the consumption of demerit goods imposes considerable negative externalities on society as a whole, such that the private costs incurred by the individual consumer are less than the social costs experienced by society in general; for example, cigarette smokers not only damage their own health, but also impose a cost on society in terms of those who involuntarily passively smoke and the additional cost to the National Health Service in dealing with smoking-related diseases. Thus, the price that consumers pay for a packet of cigarettes is not related to the social costs to which they give rise i.e. the marginal social cost will exceed the market price and overproduction and over-consumption will occur, causing a misallocation of society's scarce resources. This is illustrated in figure 1 below.
Figure 1 Over-consumption of a demerit good
The diagram illustrates how the market fails in the case of demerit goods. At a market price of OP, OQ quantity of the demerit good is consumed, where demand (private marginal benefit) equals supply (private marginal cost). However, at OQ the social marginal cost exceeds the price by the vertical distance XY, the value of the marginal external cost. Social optimality would require a smaller level of consumption at OQ1, where price = social marginal cost = social marginal benefit.
Government responses - demerit goods
Possible government responses to correct market failure arising from demerit goods
- The government may attempt to reduce the consumption of demerit goods such as cigarettes, alcohol and addictive drugs through persuasion; this is most likely to be achieved through negative advertising campaigns, which emphasise the dangers of drink-driving, drug abuse etc. The aim here is the opposite of normal commercial advertising, namely to shift the demand curve for demerit goods to the left.
- A contraction of demand (movement along the demand curve for a demerit good) could be achieved by the imposition of a tax on the demerit good. This would have the effect of shifting the supply curve to the left, raising the price and reducing the amount consumed. If the government could accurately assess the value of the marginal external cost caused by the consumption of the demerit good e.g. in figure 1, it is the vertical distance XY, a tax equivalent to this could be imposed, and a socially optimum outcome could be achieved. However, in practice, ascribing an accurate monetary value to negative externalities is extremely difficult to do, and the demand for such goods as cigarettes and alcohol is often highly inelastic, so that any increase in price resulting from additional taxation causes a less than proportionate decrease in demand.
- The government may use various forms of regulation. In its most extreme form, regulation could be used to impose a complete ban on a demerit good, such that its consumption is made illegal; for example, the Prohition Laws in the USA in the 1930s criminalised the sale and consumption of alcohol, as does the law at the moment in Saudi Arabia; also in the UK and many other countries today anyone found guilty of selling or consuming heroine can be imprisoned. However, the effect of such regulation is rarely to completely eliminate the market for the demerit good; rather, it is usually driven underground in the form of an unofficial or hidden market.
Less severe regulatory controls might take the form of spatial restrictions e.g. people may be disbarred from smoking in their place of work, on public transport and in cinemas and restaurants; there may be time restrictions in that it may be illegal to sell alcohol during certain periods of the day, or there may be age restrictions in terms of a minimum age being stipulated at which young people are permitted to buy cigarettes and alcohol.
Possible government responses to externalities
 The outstanding characteristic of a market economy is that production does not occur as a result of some grand, master plan; rather, it is the result of the pulls and pushes of supply and demand, of the numerous uncoordinated decisions of individuals and firms. As individuals are assumed to seek to maximise their own satisfaction, and firms their own profits, decisions made are likely to be strictly on the basis of private costs and benefits, and, as previously explained, herein lies the problem: unless the full social costs and benefits of production and consumption decisions are taken into account, so that MSC is equated to MSB, social inefficiency and a misallocation of society's scarce resources will result.
So, what measures can a government take to rectify such inefficiency, and how successful is it likely to be? As is the case with most important questions in economics, a range of answers is possible, depending largely on the political perspective of the respondent. At one end of the spectrum, governments could 'leave well alone', essentially not interfering with markets but trying to gently persuade firms and individuals to modify their behaviour. At the other extreme, the market could be completely replaced by direct government provision, and in between various policy options are possible. We now turn to an examination of some of these options.
In practice it is the problem of production externalities, particularly environmental ones, which most occupy the attention of governments, and our discussion will mainly, but not exclusively, focus on these.
The main measures that governments can take will be considered in the next few sections and include:
- Direct provision of goods and services - this means the government providing the good or service themselves, perhaps through state-owned or nationalised industries.
- The extension of property rights - this means giving people more right of ownership over their immediate environment, so that they can enforce environmental and other standards.
- Taxes and subsidies - where an activity causes negative externalities it could be taxed and where there are positive externalities, it could be subsidised.
- Tradeable pollution rights - this involves allowing companies to pollute a certain amount (a 'permit to pollute') but then creating a market for the permits, so that if they pollute more than the allowance they have to buy extra permits. However, if they pollute less, then they can sell their surplus permits.
- Regulation, legislation and direct controls - this involves setting legal limits or regulations to prevent negative externalities or perhaps to reduce their impact.
Perhaps there is one more alternative - the use of 'nudge theory', rather than coercion, to persuade people to change their behaviour.

Changing behaviour with a gentle nudge
Can a nudge replace a congestion tax?
Direct government provision
Direct provision of goods and services by the government
 The existence of externalities provides an important argument for the common ownership, or nationalisation of a number of key industries.
The argument is that privately owned firms, in order to survive in a competitive world, necessarily have to put their own interests before those of society at large, for to do otherwise might be inconsistent with the goal of long run profit maximisation, or even survival. This harsh reality of the market is likely to manifest itself in the generation of negative externalities such as pollution, as the control of these externalities would involve higher costs and an adverse impact on profits; conversely, production activity which conferred net positive externalities on society might not be undertaken in sufficient quantities if the criterion of private profitability could not be met.
Nationalised industries, on the other hand, which, on account of being commonly owned, could be operated according to broad social criteria, rather than the narrow commercial one of private profitability, and this allows for the possibility of externalities to be fully incorporated into production decisions. Thus, for example, questions of workers' safety standards and atmospheric pollution could be accorded priority status, rather than being ignored on the grounds that to do otherwise would adversely affect profits and competitiveness; and activities such as the keeping open of 'uneconomic' coal mines and the provision of postal and transport services to remote outlying areas, could all be maintained on the grounds that they provide substantial positive externalities to society at large, although not necessarily being profitable in the sense that the private revenues from such activities exceed the private costs.
Similarly, an important argument for merit goods such as education and health being directly provided by the government rather than through the market, is that they not only confer private benefits on individuals but also significant positive externalities on society as a whole which individuals would tend to ignore when making their consumption decisions. As a result, left to the market, under-provision is likely to occur; for example, individuals would be prepared to buy education through the market if they had to, as substantial private benefits, such as higher life-time earnings, are likely to result. However, a case for a higher level of government provision can be made on the grounds that not all the benefits accrue solely to the individual - society gains from a more efficient and adaptable labour force and perhaps a more tolerant and more aware population. The topic of such merit goods will be considered in more detail.
The above arguments for direct government provision would of course be strongly contested by free market economists who would argue the case for privatisation, the desirability of using markets to provide merit goods and the extremely poor record of pollution control of the formerly centrally planned economies of Eastern Europe.
Extension of property rights
 Property rights concern the legal entitlement to property and the right to use or sell the property, as well as the rights that other people have, or do not have, over the property. It is argued that negative externalities in particular arise because of the existence of incomplete property rights over natural resources such as air, land, rivers and seas i.e. as property rights are not fully allocated to these areas as nobody really owns them, individuals and firms are free to impose external costs from their production and consumption activities without having to pay any compensation. The dumping of toxic wastes into the sea and the riding of a noisy motorbike provide two examples.
Thus by extending property rights individuals would be able to stop others imposing costs on them or to claim compensation if they did so. A person purchasing a house, for example, could also acquire a set of 'amenity' rights that would entitle the owner to peace and quiet in the vicinity of the property as well as a supply of water and air of a reasonable quality. Any infringement of such rights e.g. by neighbours playing music unduly loudly, or trucks emitting excessive exhaust fumes into the air, would give the owner of the amenity rights entitlement to compensation. In this case the externality would be internalised as the initiators of the external costs would be forced to pay for them, and adjust their production/consumption decisions to more socially efficient levels.
However, there may be a number of problems with this solution in practice:
- for compensation to be paid, it must be possible to establish the nature and extent of external costs being imposed; in the case of most types of pollution, for example, this tends to be an extremely difficult thing to do, and so appropriate compensation levels become almost impossible to establish.
- where there are many firms or individuals imposing negative externalities, it would be exceedingly difficult to claim compensation from them all; for instance, if many juggernauts, low-flying helicopters and joy-riding teenagers passed a property, making great noise in the process, it would be somewhat impractical for the property owner to try to claim compensation from them all.
- even if those generating the external costs are few in numbers, the time and cost involved of pursuing the offenders through the courts may be prohibitive for all but the very rich; what chance would an ordinary person have, for instance, in claiming compensation from a large, multinational burger chain, which had permitted the neighbourhood to become unduly littered with burger wrappings?
- the extension of property rights has equity implications; extending private property rights is likely to favour those who already possess property at the expense of those who do not: so, Gypsies and travellers may be prevented from setting up camp, peace campaigners and other protestors could be prevented from holding their demonstrations and ramblers' rights of way in the country-side might be infringed; thus those on the political left tend to favour an extension of communal property rights and a society based more on public ownership and a set of co-operative values which, they would argue, are less likely to cause the problem of negative externalities in the first place.
Buying the rainforest

The following is a trailer for a series called 'I bought a rainforest'.
More extracts for this series can be found on YouTube.

Can you find successful examples where extending property rights has resulted in a reduction of negative externalities?
Taxes and subsidies
The use of taxes and subsidies to tackle the problem of externalities is a market-based method of control as it works through the price system, i.e. through the impact of changes in prices.
If negative externalities exist, and there is allocative inefficiency at the free market price because SMC is greater than price and overproduction is occurring, then the appropriate solution would be to tax the good; if, on the other hand, the market is under-producing because positive externalities are not being taken into account, it would be appropriate for the government to grant a subsidy.
Taxes
 There are two types of tax which may be applied to address the problem of negative externalities: a tax set equal to each firm's marginal external costs and an environmental or 'green' tax.
The policy of taxing firms according to the marginal external costs that they impose on society can be illustrated using figure 1 below. In this example we assumed that a firm was dumping waste products into a river. The government would have to assess the cost to society of such an action, and impose a tax on the offending firm equal to the value of the marginal external cost (or negative externality); in this case the tax would internalise the externality by making the polluter pay. The levying of such a tax would shift the supply curve from S to S1,which would increase the market price to OP1, and cause the level of output to fall to OQ1, where P = SMC and allocative efficiency is achieved.
Figure 1 Negative externalities - dumping of waste
An environmental tax could be imposed either on a product responsible for creating pollution, or on the inputs to an industry which have caused environmental damage e.g. carbon producing fuels, which are believed to play the major role in the process of global warming. The aim of a carbon tax on each unit of carbon in fossil fuels would be to: raise the price of those sources of power with high carbon contents, thus encouraging a switching to power sources causing lower CO2 emissions; encourage greater conservation of energy in general; and stimulate the search for more environmentally-friendly technologies.
Issues arising from the tax/subsidy approach
Advocates of this approach would argue that it permits the forces of demand and supply to operate. At the same time generators of negative externalities are induced to 'clean-up their act' because the less pollution they create, the less their tax liability; and conversely, grants and subsidies encourage greater output and consumption of those goods involving net social benefits.
In practice various difficulties are likely to arise:
- for the tax solution to work in the way indicated in figure 1 above, the exact value of the marginal external cost must be established so that taxes, of exactly the right size can be applied; in reality it is not only extremely difficult to identify external costs, but it also an extremely arbitrary matter trying to ascribe a monetary value to them e.g. how should the emission of black fumes into the air from an industrial chimney be assessed?
- from an environmental point of view a tax on pollution does not solve the problem, as pollution is still allowed to continue; the tax merely provides a market-led inducement to firms to find cleaner ways of producing so as to reduce their costs; moreover, the unwilling third parties who receive pollution as a negative externality are not in any way compensated.
- taxation of pollution would require regular monitoring of pollution emissions and as offending firms are likely to be generating different quantities and types of pollution, such monitoring is likely to be administratively complex and very costly.
- distortions and inefficiencies might arise in terms of the cost of collecting a pollution tax, the inevitable temptation by the less scrupulous to evade paying it altogether and the possibility of an inflationary impact on the price level.
Tradeable pollution rights
Like the use of taxes and subsidies, tradeable pollution rights (otherwise known as tradeable emission allowances or permits), represent another market-based solution to the problem of negative externalities, in particular pollution. They were first introduced in the USA in 1990 under the Clean Air Act in which the Environmental Protection Agency set a target rate of reduction for power stations' emissions of sulphur dioxide. Initially, power stations were issued with emission permits in proportion to their current pollution levels and were allowed to discharge pollution into the air up to a specified limit. Thereafter, those power stations for whom the cost of reducing pollution was low, could sell their spare pollution permits to generators for whom the cost of pollution abatement, through the installation of appropriate equipment, would be very high. Thus, a market in tradeable pollution rights is created, stimulating pollution reduction through the possibility of making money out of selling surplus permits.

Tradeable pollution rights
Tradeable pollution rights are emission allowances or permits which can be traded between organisations whose operations generate pollution.
 The main argument in favour of such a scheme is that it operates through the market via the price system: firms are given a profit incentive, i.e. through the right to sell spare permits, to find cheap ways of reducing their pollution levels; and such a system should be administratively cheap and simple to implement , as the regulatory agency need have no information regarding firms' costs - it simply has to issue the permits and arrange for their sale; in addition, consumers may benefit if the extra profits made by low pollution power stations, arising from the sale of their spare permits to other companies, are passed on in the form of lower prices.
The main argument against the use of tradeable emission permits is that they do not actually stop firms from polluting the environment; they only provide an incentive to so - where a degree of monopoly power and relatively inelastic demand exist, the extra cost of purchasing additional permits so as to further pollute the atmosphere, could easily be offset by the possibility of charging consumers higher prices; moreover, the system of allocating permits in accordance to existing emission levels could be seen as a reward for the greatest polluters!

To get some up to date examples on tradeable permits, try searching the Biz/ed In the News archive. You can do this in the window below.
Regulation, legislation and direct controls
 In practice the use of direct controls represents the most common approach to pollution abatement. Such controls can be applied both to individuals and firms and can take a number of forms; for example, restrictions can be imposed on smoke emissions from private homes and firms; restrictions may be placed on all forms of building in designated green-belt areas; minimum environmental standards may be stipulated for air and water quality; laws may be passed to prevent drinking and driving and the sale of alcohol and tobacco to people under a certain age.
Apart from restriction, direct controls can also be used more severely: activities generating negative externalities could be banned completely; for instance, the dumping of waste into rivers or the sea; or an activity which conferred net positive externalities on society could be made compulsory; for example, all children under the age of 16 in the country could be made by law to receive some form of education, whether it be in a state school, a private school or at home.
The main advantage of regulation is that it is the most direct way of tackling the problem of externalities; for example, market-based solutions such as taxes and tradeable emission permits provide incentives to firms to reduce their pollution levels but do not compel them to do so; as such problems as global warming and the depletion of the ozone layer are thought by many to threaten the very survival of our planet, it is argued that we cannot afford to trust our futures with policies which allow for the possibility of non-compliance. Providing legal restrictions are backed by inspections that are sufficiently regular and rigorous, they should be effective.
Against this, it is argued that in reality the policing of regulations can present great difficulties as the less environmentally conscious firms may attempt to circumvent the controls e.g. through the generation of pollution during the night. Thus an extremely large number of inspectors might have to be employed to ensure compliance.
It is also claimed that regulation can be a rather blunt, indiscriminate instrument of control; for example the setting of maximum emission limits does not take into account the fact that the cost of reducing pollution would vary considerably as between different firms, some facing high costs with others facing low costs. Thus a uniform limit applied to all firms would be an inefficient way of reducing pollution, implying as it would a high resource cost. Also it may be the case that once emission targets have been achieved, there would be no further incentive to continue to reduce pollution, as would be the case with a pollution tax.
Regulation may also give rise to the problem of regulatory capture - those being regulated may be successful in manipulating the regulatory body to act in accordance with the private interests of the firms concerned, rather than in the interests of society as a whole.
Positive externalities of production
If you would prefer to view this interaction in a new web window, then please follow the link below:
Positive externalities of consumption
If you would prefer to view this interaction in a new web window, then please follow the link below:
Merit goods
 What are merit goods?
Merit goods are the opposite of demerit goods - they are goods which are deemed to be socially desirable, and which are likely to be under-produced and under-consumed through the market mechanism. Examples of merit goods include education, health care, welfare services, housing, fire protection, refuse collection and public parks.
In contrast to pure public goods, merit goods could be, and indeed are, provided through the market, but not necessarily in sufficient quantities to maximise social welfare. Thus goods such as education and health care are provided by the state, but there is also a parallel, thriving private sector provision. Indeed, there is considerable disagreement between economists on the right and left of the political spectrum over the extent to which such goods should be provided by the state or the private sector. We consider these arguments later in this section.

Before we proceed with our discussion of merit goods, and in particular the question of why merit goods tend to be underprovided by the market, it would be useful at this stage to summarise the main differences between public goods, private goods and merit goods. Have a go at filling in the blank table below (we have put in a few entries to help you along). Once you have had a go, follow the link under the table to compare your answers with ours.
| Main features | Public goods | Merit goods | Private goods |
|---|---|---|---|
| Diminishability (non-rivalry) | Non-diminishable (non-rivalry) | ||
| Excludability | Excludable | ||
| Benefits | Individual and communal (strong positive externalities) | ||
| Provider | Usually private enterprise | ||
| Financed by | Usually taxation | ||
| Examples |
Main features of public, merit and private goods - full table
Why might merit goods be underprovided by the market?
If you would prefer to view this interaction in a new web window, then please follow the link below:
Government responses - merit goods
Possible government responses to the under-provision of merit goods
 One solution would be for the government to play no role whatsoever and to allow the provision of merit goods to be decided completely through the free interaction of market forces. However, for all the reasons previously mentioned, this would lead to extreme under-provision of these goods and a misallocation of resources from the standpoint of society as a whole. Thus, in practice, governments play a substantial role in the provision of merit goods such as health and education, even where they are ideologically committed, as the present Conservative government is, to the market system. However, the exact form that such government involvement should take is a subject of much dispute, and we shall consider each of the following in turn:
- direct government provision
- regulation
- subsidies
- a combination of government provision and market forces
Direct government provision
Traditionally in Western Europe the overwhelming majority of health care and education is still paid for out of general taxation and provided free at the point of contact by the government - for most people, when they visit their doctor, go to hospital, school or college, no direct charge is levied upon them; the private sector still only accounts for a relatively small proportion of all health and education provision. Apart from generating substantial positive externalities and overcoming the problems arising from unequal income distribution, lack of current and future information and potential private monopoly power, direct government provision may also give rise to large economies of scale, and may thus be productively efficient; for example, when a service such as health care is provided to the population as a whole, greater scale economies are likely to arise in terms of capital and labour costs than could be expected to accrue to the private health care sector, whose scale of operations is necessarily much smaller than that of the NHS.
However, the idea of universal provision for all on the basis of need, with prices and profits playing no role, is one which sits very uneasily with the philosophy of market economics, and has thus in recent years come under fierce attack from right-wing, market-oriented economists. They have argued that government provision of health and education has led to an undesirable situation of state monopoly power in these areas and that to increase consumer choice, lower costs and raise the level of efficiency, greater competition is required.
Regulation
The government may also use a range of regulatory devices both to increase the consumption of merit goods and to ensure their quality. In the case of education, it may be compulsory that all children between the ages of 5-16 receive some form of schooling, be it in the private or public sector, and quality is controlled in such ways as school teachers being required to have stipulated qualifications before they are allowed to teach. In the case of health care, vaccinations against various contagious diseases could be made compulsory and medical practitioners such as doctors, dentists, opticians and nurses could be required to obtain certain qualifications before they can practice. The government could also use regulation to enforce the consumption of a good provided by the private sector which is deemed to be a merit good by virtue of the positive externalities that it generates: the compulsory consumption of seat-belts by motorists provides one such example.
In the case of housing, the use of rent controls on private sector rented accommodation are a means by which the market can be regulated so as to protect tenants from having to pay high rents.
Rent controls represent a form of price fixing. More specifically, they represent an attempt to fix a maximum price below the equilibrium i.e. a maximum rent that a private landlord may charge for rented accommodation; and, to be effective, rent controls may also have to be accompanied by further regulation preventing the landlord from ousting the tenant once the rent has been fixed. Figure 1 below illustrates the fixing of such a maximum, and the possible longer term problems
Figure 1 The use of rent controls
The diagram shows that, with a relatively inelastic supply of rented accommodation, the free market rent would be established at a price of OP, with the quantity demanded and supplied equal at OQ. However, if the government impose a ceiling of OP1 on the price that landlords can charge, an initial shortage of Q1Q2 develops as the short term profitability of renting-out accommodation declines. In the longer term , if landlords' rate of return falls below what they could receive from alternative investments, such as government bonds, then existing landlords could be expected to leave the housing market with little new rented accommodation coming onto it. As a consequence, the supply of rented accommodation would shift from S to S1, and the shortage would increase to Q3Q2. Thus, unless the government could shift the supply curve to the right, for example by building more publicly owned council houses, the long term shortage would worsen, with the existing rent-controlled stock descending into an ever greater state of disrepair, as a result of landlords seeking to reduce their costs by postponing or cancelling repair and maintenance work.
The use of taxes and subsidies to tackle the problem of externalities is a market-based method of control as it works through the price system, i.e. through the impact of changes in prices.
If negative externalities exist, and there is allocative inefficiency at the free market price because SMC is greater than price and overproduction is occurring, then the appropriate solution would be to tax the good; if, on the other hand, the market is under-producing because positive externalities are not being taken into account, it would be appropriate for the government to grant a subsidy. We shall consider each in turn:
Subsidies
Subsidies may be used to increase the output of merit goods, provided both by the private and public sectors, to the socially optimum level.
For example, the theatre is usually provided by the private sector, and is often regarded as a merit good on account of the educative and civilising benefits that it confers on society. The government might take the view that without state assistance to the arts, there would be an unacceptably small number of theatres able to survive. Figure 2 illustrates how the subsidy would operate.
Figure 2 The effect of subsidising a merit good
In the diagram, the free market price of theatre tickets is established by the intersection of the curves D and S at OP, with the equilibrium quantity at OQ. A government subsidy, equivalent to the vertical distance XY, would have the effect of shifting the supply curve to the right, causing the market price to fall to OP1 and the quantity of theatre tickets demanded and supplied to increase to OQ1. Consumers' expenditure on the theatre increases from OPZQ to OP1YQ1 and the area P1RXY represents the total amount that the government spends on the subsidy.
In the case of health care in several West European countries, the majority of it is provided free to the user out of general taxation, although charges may be levied for prescriptions and optical and dental treatment. In these cases the prices charged have been made cheaper than they would otherwise be, with patients only paying part of the cost of treatment and the government making up the difference through the payment of subsidies to suppliers. In the case of housing, owner occupiers receive a subsidy through the receipt of tax relief on mortgage interest repayments, which is not available to those people who rent their accommodation. State education like health care, may be provided without direct charges being made, although education vouchers represent an alternative form of market-based, subsidised provision which has been proposed.
For a subsidy to work, the government would have to assess the value of the marginal external benefit (i.e. the positive externality) to society and give a subsidy equivalent to this amount.

If the good in question were loft insulation which confers benefits on society in terms of energy conservation, households prepared to lag their lofts could be given a grant, and this would shift the demand curve D=PMB to the right to D1=SMB. Allocative efficiency is achieved as SMB = SMC at OQ1. A similar result could be achieved by subsidising the output of loft insulation which would cause the supply curve to shift to the right until the socially optimum level of production is reached.
Figure 3 Positive externalities - loft insulation
Public goods
What are public goods?
 Pure public goods are ones that when consumed by one person can be consumed in equal amounts by the remainder of society, and where the possibility of excluding others from consumption is impossible.
Examples of public goods are:
- national defence;
- the police service;
- street lighting;
- lighthouses;
- flood-control dams;
- pavements;
- public drainage.
It is likely that the market, left to itself, will seriously under-produce such goods, or possibly not produce them at all. This is because the market will only provide goods for which a profit can be made, and pure public goods possess two important properties that together make their production on the basis of private profitability extremely difficult. These features are:
- non-rivalry (or non-diminishability);
- non-excludabilty.
Firstly, consider the characteristic of non-rivalry: this means that one person's use of the public good does not deprive any other person of such use or does not diminish the amount available to others; for example, if one person enjoys the benefits of being protected by the police-force, a flood control dam or the national defence system, it does not prevent everyone else doing the same; similarly, if one person benefits from walking along a street at night-time which is paved, free of pot-holes, and well-lit, the benefits and the availability to others would not be diminished.
Secondly, consider the characteristic of non-excludability: this means that when the public good is provided to one person, it is not possible to prevent others from enjoying its consumption - sometimes summarised as: provision at all means provision for all. For example, if a police force, a flood-control dam or a national defence system is successful in offering protection to citizens of a country, once it has been provided it is impossible to exclude anyone within the country from consuming and benefiting from them. Similarly, for a paved and well-lit public street, nobody can be prevented from enjoying its benefits.
The concept of a 'public good' can perhaps best be understood by comparing it with its opposite, a private good.
A private good possesses two features, excludability and rivalry, and when consumed by one person, it is not available to others; thus, a person buying a new washing machine can exercise private property rights over it and exclude others from enjoying its cleaning abilities, whilst, at the same time, diminishing the total stock of washing machines available for sale to others.
Thus, in the case of public goods,the market fails because the private sector would be unwilling to supply them - their non-excludabilty makes them non-marketable, because non-payers cannot be prevented from enjoying the benefits of consumption, and therefore prices cannot be attributed to particular consumers. This involves the free-rider problem, which arises when it is impossible to provide a good or service to some without it automatically and freely being available to others who do not contribute to its cost. For example, imagine a situation in which you shared an island with five other inhabitants; if you paid privately for an army to defend the island against violent invaders, your five co-inhabitants could 'free-ride' off you by enjoying the benefits of the defence, without having to pay anything towards it; there would probably come a point when you would withdraw your payments and, like the others, leave it to someone else to foot the bill; eventually, the army would not be provided at all.

Free riders
Free riders are those who enjoy the benefits of a public good without having to pay, because it is impossible to exclude them.
Hence, in a free market, a whole range of pure public goods may not be provided, and the only answer is for the state to provide them, financed out of general taxation. Moreover, the non-rivalry aspect of public goods means that the cost of supplying one more user i.e. the marginal cost, is zero; for example, once paving stones have been laid, it makes no difference how many people walk along them as there is no additional cost involved. As the condition for the achievement of allocative efficiency is that price should be set equal to marginal cost, it would therefore follow that to achieve an optimum level of output and consumption of public goods the state should provide them at zero prices.
Non-pure public goods (quasi-public goods)
 In practice, various ways may be devised for excluding free riders from the consumption of public goods, as the characteristics of non-excludabilty and non-rivalry may not be completely present. In such cases, the goods would be referred to as non-pure or quasi-public goods; for example, in the case of a motorway, various methods could be used, such as electronic tagging or toll-gates, to make users pay (an impossibility with a pure public good), so excludabilty would be possible; and, if the motorway were to become sufficiently congested, non-rivalry would not be present i.e. as the road reaches its full vehicle capacity, as often happens in the rush-hour periods on urban motorways, each extra road user does reduce the availability of the motorway to other motorists and raises the marginal supply cost above zero. (The marginal cost would of course be zero, or near to zero, on an entirely uncongested motorway.)
Thus a non-pure public good is an example of a mixed good, which is one which has both a public and a private good content. A motorway provides an example of a public good with a private good component, and conversely it is possible to identify private goods, with a public good component e.g. driving a car is an act of private consumption, but when public transport is not available, perhaps because transport workers are on strike, car owners may offer lifts to stranded travellers creating some publicness. Hence, in practice, many public and private goods contain some mix of both.
Common access resources & sustainability
Common access resources
Common access, or common pool resources (CAR/CPR), are natural resources including forests and pastures, fisheries, oil and gas fields, national parks, grazing lands and irrigation systems, which are characterised by the difficulty of excluding people from using them. As a result of the inability to charge a price for their use, over-consumption, degradation and depletion of these resources is a likely outcome. Indeed, the use by one individual or group of the resource will mean that less of that resource is available for use by others. This distinguishes common access resources from pure public goods, which exhibit both non-excludability andnon-rivalry in consumption.
It is argued that the lack of a price mechanism for common access resources results in their overuse, depletion and degradation. The consequence of the actions of producers and consumers, who do not pay for the resources they use, creates a threat to sustainability and, therefore, the availability of common access resources for future generations.
The origin of the study of common access resources dates back to medieval land tenure in Europe, where herders were entitled to graze their cows on common parcels of land for free. The result was over-grazing and the degradation of the land. The problem was described and analysed by Garrett Hardin in his article 'The Tragedy of the Commons', which appeared in the Science journal in 1968. Hardin explained that it was in each herder's interest to put any additional cows he acquired onto the grazing land, even if the quality of the common was damaged for the whole community. This was considered to be a rational economic decision by the individual herder, because each additional cow added to the individual's 'marginal utility', while the damage to the common land was shared by the entire group. However, the consequence of these individual rational economic decisions was market failure because these actions resulted in the degradation, depletion or even destruction of the resource to the detriment of all users and, therefore, society in general.
The tragedy of the Commons

The overgrazing cost shown in Hardin's analogy is an example of a negative externality of consumption, where the private utility is diminished by the negative utility suffered by third parties; in this case the other herders. The grazing land is over-consumed and so there is a welfare loss.
To reduce these negative externalities, Hardin suggests potential management solutions for common goods including privatisation, environmental taxation, government regulation and stricter management by the state. The nature of this regulation depends on whether the resources are within national boundaries or global in nature. Where national resources are concerned; rules on their use can be imposed by national governments. Global common access resources, such as fishing grounds, will require the creation of international regulatory organisations to control their use. Hardin also suggests the transfer of common access resources to private ownership. In keeping with his original pasture analogy, he categorises this as the enclosure of the commons.
The 'Tragedy of the Commons' is an analogy. The major theme running through Hardin's work is, in fact, the growth of human populations with the Earth's resources being a general 'common'. He focuses on the allocation and exploitation of larger resources, such as the Earth's atmosphere and oceans, and the 'negative commons' of pollution.

Garrett Hardin on the Tragedy of the Commons and Resources
In this video, Garrett Hardin is interviewed on the Tragedy of the Commons and Resource Allocation: As Hardin says:

The Tragedy of the Commons is concerned with the allocation of resources...The unmanaged commons cannot possibly work once the population gets about a certain size.
Common access resources in practice
In practice neither the state nor the market has been uniformly successful in solving common access resource problems.
 Indeed, Hardin's Common's Theory has been criticised by a number of economists, not least by Elinor Ostrom the political economist and the 2009 Nobel Memorial Prize winner in Economic Sciences. Together with colleague Oliver E. Williams, Ostrom's analysed economic governance, especially those related to common access resources or 'the commons'.
Ostrom simulated conflicts concerning the allocation of the commons and derived a complex theoretical framework that went beyond the simple analysis of private costs and benefits. She focused on additional variables, such as community, leadership, trust and collaboration in resource sustainability and claimed it is not necessary to have a 'top-down' management system regulated by the state.
Ostrom's extensive research includes analysis of complex fishing systems in Nova Scotia, irrigation systems in the Philippines and Sri Lanka and groundwater usage in California. Her research results suggest that sustainability is possible if the users of resources collaborate to create democratically agreed, and adaptable, rules for the exploitation of common access resources, with community sanctions if these rules are broken. She argues that local communities make better decision about the use of community resources than governments or private organisations, because they have access to more information about the local context and are directly affected. Her conclusions are supported by empirical data showing that local-level monitoring of resources and community self-determination is effective in ensuring resource sustainability.
The following videos explain Ostrom's beliefs and report on her Nobel Prize award:

Sustainable Development and the Tragedy of Commons
First woman to receive Nobel prize in economics
Other critics of Hardin's 'Tragedy of the Commons' analysis, focus on his proposal to transfer common goods into the hands of private owners. Professor Heller of the Columbia Law School, for example, coined the term 'Tragedy of the Anticommons' to describe a situation in which rational individuals, acting separately, collectively waste a common resource by under-utilising it. Heller believes that the existence of numerous private rights holders may frustrate the achievement of socially desirable outcomes. Supporters of this theory claim that too many property rights, such as patents, leads to reduced innovation. Competing patents in biomedical research illustrates a situation where useful and affordable products are prevented from reaching the market and adding to social welfare.
Sustainability
A universally accepted definition of sustainability remains elusive, because they focus on the many contexts in which the term is used. Most relevant to the study of market failure are those definitions that relate to natural resources and their usage.

Sustainability and sustainable development
Sustainability encompasses the simple principle of taking from the earth only what it can provide indefinitely, thus leaving future generations no less than we have access to ourselves.
Friends of the Earth, Scotland
Sustainability may be described as our responsibility to proceed in a way that will sustain life and allow our children, grandchildren and great-grandchildren to live comfortably in a friendly, clean, and healthy world.
Thomas Jefferson Sustainability Council
Sustainable Development is positive change which does not undermine the environmental or social systems on which we depend. It requires a coordinated approach to planning and policy making that involves public participation. Its success depends on widespread understanding of the critical relationship between people and their environment and the will to make necessary changes.
All these definitions concern the need for humans to:
- live within the limits of the Earth's resources
- examine the distribution of resources and opportunities
- meet the needs of the present without compromising the ability of future generations to meet their needs
Sustainable development was defined at the 2005 World Summit as development requiring an understanding and reconciliation of the 'three pillars' of sustainability, that of environmental, social and economic demands.

The Millennium Development Goals (MDGs) are international development goals that all 193 United Nations member states agreed to achieve by the year 2015 following the Millennium Summit in 2000. There are eight goals with 21 targets. Goal 7 is to ensure environmental sustainability with the target of integrating the principles of sustainable development into country policies and programmes to reverse the loss of environmental resources. Each year the United Nations reports on progress towards achieving the MDGs. The following articles provide details on achievements and failures to meet the MDGs and, in particular, progress towards environmental sustainability.
Threats to Sustainability
 The threat to sustainability comes from the unplanned and often unfettered exploitation of the world's natural resources. The increase in globalisation, the drive for economic growth, population growth and developments in technology has made the need for management of global common access resources more acute, whether this is by governments or by local communities.
Clearly, there are already many examples of threats to sustainability from the depletion and destruction of common access resources, such as deforestation, soil erosion and the overfishing of oceans. These are compounded by the pursuit of economic growth by newly developing countries, and in less economically developed countries where high levels of poverty and poor regulation creates negative externalities through over-exploitation of land for agriculture.
The depletion of natural resources, such as fossil fuels and fishing resources, creates individual hardship and political instability and potentially threatens world peace. Resource depletion is accelerating and the economic growth of countries that ignore this trend will be eroded by higher commodity prices.

The Earth Summit 2012 on Sustainable Development - 'Rio+20'
Read the article Big summit seeks big idea. You can either read the article in the window below or you can follow the link above to read the article in a separate window.
The threat to sustainability from the use of fossil fuels
 Market failure exists when the production or use of a good or service results in an externalities and welfare loss, because the market does not direct an efficient amount of resources into the production, distribution, or consumption of a good.
Fossil fuels are non-renewable resources as they take millions of years to form and accelerating overuse is leading to their rapid depletion. The principles of supply and demand mean that as fossil fuel supplies diminish, prices rise. However, since the producers and consumers of fossil fuels do not have to account to later generations for their overexploitation of resources, fossil fuels are over-produced, and over-consumed despite their increase in price.
The over-production and overuse of fossil fuels raises environmental as well as economic concerns, since coal, petroleum, and natural gas contain high percentages of carbon; the burning of which generates greenhouse gasses (GHGs), such as Carbon Dioxide (CO2 ) contributing to the process of global warming. Although there is much argument about the extent to which the human activity contributes to climate change, the effects of climate change are undisputed, leading to increases in average temperature, altered habitats, extreme weather conditions, sea-level changes and flooding.
There are huge external costs linked to these environmental changes. As temperatures increase and rainfall patterns change, crop yields are expected to drop significantly in Africa, the Middle East and India. Water availability for irrigation and drinking will be less predictable, because rain will be more variable and droughts more frequent, creating pressure on agricultural production and diversity. Up to three billion people could suffer increased water shortages by 2080. Air and water pollution resulting from the extraction and use of fossil fuels can lead to significant health and environmental problems.
The economic consequences are significant. All businesses need resources - both raw materials and energy. As reserves of both are under strain, world prices are increasingly volatile. National and international commitments to reduce carbon emissions, are forcing governments to examining the balance of their energy production and consumption, exploring ways to reduce the use of fossil fuels if possible, to be replaced by alternative cleaner technologies. With the rapid economic growth in the emerging BRICS economies (Brazil, Russia, India, China and South Africa), demand for raw materials and energy is outstripping supply and countries around the world are beginning to position themselves to protect their strategic interests.

The state of oil and natural gas production, in particular, is causing alarm. Oil production peaked during 2006 with global oil production from mature oil fields now declining at a rate of between 6-7% per year. Oil is becoming more difficult, expensive and energy intensive to extract. The Peak Oil Crisis website has real time clocks of global oil consumption and graphics illustrating the impending crisis as well as articles, graphics and links to industry articles. Countries reliant on oil imports are desperately seeking new oil and gas sources with global oil companies seeking out previously untapped reserves in the remotest of regions.
The Artic is one of the regions that likely to become an economic and realpolitik battleground, almost certainly pushing ethical, environmental and moral considerations aside in the drive to its natural resources. It has been stated by industry experts that another 5 million barrels of new oil per day must come on line per year to meet global demand. A 2008 United States Geological Survey estimated that areas north of the Arctic Circle have 90 billion barrels of undiscovered, technically recoverable oil representing 13% of the undiscovered oil in the world. In addition to the size of the untapped resources, environmental factors are driving moves to develop the Arctic region. In the past, the Northwest Passage connecting the Atlantic and Pacific Oceans through the Canadian Arctic Archipelago, has been virtually impassable, because it was covered by thick, year-round sea ice. However, satellite and other monitoring confirm a progressive, year-by-year decline in the thickness and extent of Arctic sea ice.
There is general insecurity about oil supplies in many regions. Asia, for example, only holds about 1% of the world's proven reserves of oil and gas. Oil prices are predicted to rise abruptly with apocalyptic predictions about a collapse in oil production by 2015. Asian countries, such as Japan, South Korea and India, are buying and storing crude oil in unprecedented quantities. China is planning to increase its reserves to 90 days consumption by 2020 and Singapore, preparing for the looming oil crunch, is racing to complete a series of vast man-made caverns beneath the seabed of Banyan Basin, which will include a vast oil storage complex. The first two caverns providing 480,000 cubic metres (m³) of oil storage will be constructed by 2013. Three more caves are planned, which would store enough oil to last Singapore a month.
The threat to sustainability from poverty
Population increases are both a consequence, and cause, of increasing poverty and low standards of living around the world, especially in Asia and Africa. As populations increase the demand on common access resources intensifies resulting in extensive negative externalities which threatens sustainability.
With the world's population surpassing 7 billion people in 2011, the global impact is huge.

Read the following article and reflect on the implications for sustainable development resulting from population growth.

 The World Bank periodically prepares poverty assessments of countries in which it has an active programme, in close collaboration with national institutions and other development agencies. The data it records is presented in a series of datasets on its website.
Examine the following datasets and featured indicators and identify the major links between poverty and reliance on agriculture.
For the 70% of the world's poor who live in rural areas, agriculture is the main source of income and employment. The depletion and degradation of natural resources poses serious challenges to producing enough food and other agricultural products to sustain local livelihoods, but also to meet the needs of urban populations which rely on this supply.
Where low-income rural populations rely on subsistence agriculture, the likelihood is that common access resources will become depleted, unless there is some form of community collaboration along the lines suggested by Elinor Ostrom. Sustainability of resources may be lost if poor communities are forced to sell land and resources, such as forests, to external private corporations who do not have the interests of the local community as a priority, but need to satisfy their shareholders. Logging companies, for example, will wish to maximise their utilisation of timber resources taking only their private costs into consideration, ignoring the external costs to the local population. As a consequence, there will be overexploitation of timber and deforestation creating negative externalities such soil erosion, landslides, flooding and loss of bio-diversity.
The World Bank is one of the key promoters and financiers of environmental upgrading in the developing world. The following dataset covers forests, biodiversity, emissions, and pollution.
Government responses to threats to sustainability
Market failure in production occurs when the production of a good or service creates external costs that are harmful to third parties, e.g. when a factory pollutes a river with waste or the atmosphere with greenhouse gasses. The total costs to society of these activities are the private costs of the firm plus the external costs that the firm creates, but does not pay for. Since the producer does not pay the total cost, the good or service is over-produced, which results in a welfare loss.
 National governments can respond to negative externalities of production and to resource depletion and CO2 pollution using a number of mechanisms designed to reduce emissions of global greenhouse gasses and promote sustainability. These include:
- environmental taxation, such as carbon taxes, to recover the external costs of pollution
- legislation setting environmental standards and banning firms which fail to meet these standards
- adoption of cap and trade schemes for carbon trading
- funding for cleaner technologies
Taxation and financial penalties increase the market price of carbon. This provides strong incentives to reduce carbon emissions by sending signals:
- to consumers about what goods and services produce high carbon emissions and which should be used more sparingly.
- to producers about which inputs emit more carbon, and which emit less, so encouraging them to move to lower-carbon technologies.
- to inventors and innovators to develop and introduce lower-carbon products and processes.
Cap and Trade Schemes

Cap and trade scheme
A cap and trade scheme is a market-based approach to reduce carbon emissions via financial incentives that allows corporations or national governments to trade emissions allowances under an overall cap, or limit, on those emissions. Fines are imposed for producers exceeding those limits, while producers operating below their carbon limits can sell or "trade" their offsets to companies that are operating above the limits.
Cap and trade schemes set specific limits on GHG emissions for countries and organisations. They promote the trading of emissions allowances between emitters, who can meet the cap efficiently and those who face more of a challenge in reducing emissions.
The choice between environmental taxation and cap and trade schemes to address climate change has generated considerable discussion with impassioned arguments on both sides.
Taxation has the advantage that it can be implemented by individual governments without international agreement, but, environmental taxes have dead-weight losses in addition to their beneficial effects in addressing externalities. It is also argued that establishing a price for GHGs through cap and trade schemes has the advantage of providing some certainty about reductions in quantities of emissions and creates a market to achieve the climate change mitigation target at the lowest cost.

The following article outlines the advantages and disadvantages of cap and trade schemes compared to environmental taxes as a means of reducing emissions.
Cap and trade schemes vs. Carbon tax
You can read the article Cap and trade vs. Carbon tax in the window below, or you can follow the link to read the article in a separate window.

Carbon pricing has a double climate effect - it's a huge source for revenue, but also gives the right incentives for reducing emissions by making it expensive to pollute.
Norwegian Prime Minister Jens Stoltenberg
Promoting Clean Technologies

Clean technologies
Clean technologies are designed to minimise pollution and the emissions of greenhouse gasses, by creating electricity and fuels with a smaller environmental and carbon footprint. These technologies include recycling, renewable energies (wind and solar power, biomass and biofuels and hydropower), green transportation, waste water recycling and energy efficient lighting, homes, buildings, electric motors and commercial and domestic appliances.
The World Bank is the trustee of the Clean Technology Fund (CTF), focused on making renewable energy cost-competitive with coal-fired power. Since its launch in 2008, $US6.5 billion has been allocated to climate change projects in 45 developing countries. These payments represent a subsidy on the development and use of clean technologies.
If government or World Bank subsidies are particularly focused on the generation of electricity using renewable energy sources, such as wind and solar power, then firms generating electricity using cleaner technologies will face lower costs of production. This will encourage energy producers to produce more wind and solar power, shifting the supply curve to the right and lowering prices for consumers.
Subsidies or tax credits should also encourage increased investment in clean technologies. However, UN research showed 'green' investment in Europe dropped by one-fifth in 2010, while that in developing countries surge ahead.

Read the following articles and then produce a 750 word report comparing and contrasting Europe's commitment to renewable energies and cleaner technologies to that of some developing countries. Use appropriate data to support your analysis.
The 'dirty side' of cleaner technologies
Cleaner technologies are not always welcomed by local and national communities. 'Wind farms', for example, may consist of hundreds of wind turbines and are frequently criticised by some local communities for their negative environmental impacts. They are often seen as a 'blot on the landscape' as well as posing a danger for birds and bats, whose migratory and flight paths may take them into collision with wind turbines and towers.
Other alternative energy sources have created similar controversies. The production of biofuels has resulted in food price inflation worldwide, with land previously used for growing food for human consumption being transferred to the production of crops used to produce biofuels.
A 2011 report from the Nuffield Council on the Bioethics examined the ethical issues of biofuels and the serious negative impacts on the livelihoods of some of those who cultivate the land, on the sustainability of cultivation systems and on biodiversity.
The following videos discuss the role of science in addressing some of the problems associated with finding, and commercialising, alternatives to fossil fuels:

Improving alternative energy sources

Why are subsidies for alternative energies still lagging behind those for nuclear oil or coal?
International responses to threats to sustainability
Government responses to threats to sustainability are limited by the global nature of the problems and the lack of ownership of common access resources. Therefore, effective responses require international cooperation.
The United Nations Framework Convention on Climate Change (UNFCCC or FCCC)
The UNFCCC is an international environmental treaty resulting from the 1992 United Nations Conference on Environment and Development (the 'Earth Summit'), held in Rio de Janeiro. The objective of the treaty was to stabilise greenhouse gas concentrations in the atmosphere, although it was considered legally non-binding as it set no mandatory limits on greenhouse gas emissions for individual countries. However, the treaty provided for future 'protocols' or updates that would set these enforceable limits.
The 1997 Kyoto Protocol
The Kyoto Protocol established legally binding obligations for developed countries to reduce their greenhouse gas emissions. Industrialised countries agreed to reduce their combined emissions to 5.2% below 1990 levels during the five-year period 2008-2012. The protocol came into force in 2005.
Parties to the UNFCCC are classified as:
- Annex I countries: industrialised countries and economies in transition
- Annex II countries: developed countries which pay for the costs of developing countries
- Non-Annex I countries: developing countries
Under the Kyoto Protocol, Annex I countries must limit their emissions, while non-Annex I countries have a variety of non-binding commitments.
However, it is commonly agreed that developed countries cannot reduce carbon emission enough to stabilise GHG concentrations to a level where the risk of global temperature exceeding 2 degrees centigrade is minimised, without the participation of developing countries, especially China and India. Developing countries may volunteer to become Annex I countries when they are sufficiently developed.
A 2010 World Bank report says a climate smart world is achievable for developing countries, but only with financial and technical support from the developed world. The World Development Report 2010: Development and Climate Change also says high income countries must lead global action on climate change by reducing their own heavy carbon footprints.

Asymmetric information
For markets to function perfectly, all parties to an economic transaction should have perfect knowledge about the terms of the contract, the products and services that form the subject of the agreement and the prices in the market. In practice, the real commercial world rarely confirms to this ideal, and it is common for one of the parties to have better and/or more knowledge than the other, leading to imperfect competition and market failure. This situation is called asymmetric or imperfect information.

Asymmetric information
Asymmetric information or imperfect information, occurs where access to information by one party (or parties) to an economic transaction is better than access by another party.
Properly functioning markets provide a valuable service to society, because consumers are able to purchase the goods and services that best match their preferences. However, asymmetric information can be used as a source of power in determining the outcome of the transaction. As a consequence, the market will not achieve allocative efficiency, because one of the parties - in this case normally the consumer, pays a higher price for a product than they would have done if they had perfect knowledge. In a perfect market, consumer and producer surplus should both be maximised at the market price, i.e. the conditions are in place for a Pareto optimum allocation of resources.
A common example of where the buyer pays more for a good than is socially efficient is where the seller knows much more about the characteristics of that good than the buyer. For example where:
- the seller of a product knows it is faulty
- commercial ideas with technical aspects are hard to describe contractually, but privately known by innovators
- labelling of food products use alternative terms for ingredients consumers would normally avoid, e.g. various names for sugars such as glucose, sucrose and fructose
- firms may have no incentive to provide consumers with information in markets with a public good aspect
It is also possible that the consumer has more information than the seller. For example, purchasers with specialist knowledge of antiques may be able to buy a antique for a price less than its true market value from a private seller, who does not have this expert knowledge.
The government has a number of policy tools at its disposal to correct asymmetric information and to control externalities. These include taxes, education programmes and production regulation intended to increase the flow of information to consumers. Government may decide to intervene in the market to require producers to disclose critical information, such as mandatory product labelling. The objective of this government intervention may not be to alter consumption behaviour in particular, but to increase informed consumption. However, these measures can be expensive and ineffective and perceived as government interference in the free market.
The growth of computer ownership with access to the internet has reduced the opportunities for asymmetric information, as consumers are able to access greater details on products, prices and customer reviews.

Read the following article and discuss whether the marketing and sale of Sunny Delight in 2003 was an example of asymmetric information in practice.
Abuse of monopoly power
 A most important assumption of the ideal free market economy is that markets within it are competitive, so that a large number of competing firms passively take the price that is set in the market as a whole and either increase or decrease their output in response to shifts in consumer demand.
However, as we saw in the section on monopoly, markets may be dominated by a single producer of the good or service, in which case a situation of monopoly exists, or by a few producers, in which case an oligopoly exists. In either situation, producers may not be content to take a price set in the market. Having significant control over supply, firms in pursuit of maximum profits may attempt to make the market price higher than it would otherwise have been by restricting output. The outcome for consumers may therefore be that they are paying a higher price for a smaller output. This would represent market failure and a misallocation of society's scarce resources, as the economy would be deprived of some of the output which would be valued more highly than that currently being consumed.
Also, in a situation of monopoly or oligopoly, profits may not perform the function that they are supposed to in the 'ideal' free market situation. Here, the making of profit is deemed to be a sign of efficiency; that is, the goods that are being produced are precisely those that consumers want and of a suitably high quality, and because firms cannot influence price, the profit has been achieved by operating efficiently, with costs being kept below the ruling price. However, given the power of firms in monopoly and oligopoly to restrict output to keep price artificially high, the making of profits may reflect market power and dominance rather than efficiency. Monopoly may involve both allocative and technical inefficiency. Refer back to the section on monopoly and re-read the course notes if you are not sure about this.
Inequality
 Advocates of a freely operating price system often liken it to a political democracy where all voters can cast their votes for the candidates of their choice, with everyone who is eligible having an equal say: the price system, according to this line of reasoning, is a consumers', economic democracy; every time we go out and buy a particular good, we are affecting the demand for that good, and hence also its profitability and supply. Hence, the simple act of buying a good is akin to casting a 'vote' in favour of the production of that good, and is the way in which consumers determine how scarce resources should be allocated.
Unlike the political democracy however, in which each person has equal voting rights, the consumer democracy described above, given the unequal distribution of income that exists in most capitalist economies, is unlikely to be one in which all have an equal say _ clearly voting power is directly related to income so that the rich would have many more votes, and thus a much greater pull on resources, than the poor. Consequently, the resulting pattern of resource allocation may overlook the pressing, often life and death needs of the poor, and reflect instead the more trivial wants of the rich. In the economics of the market place, human wants are those that are supported by effective demand i.e. demand backed by the ability and willingness to pay the market price. Human needs, however, if unaccompanied by the wherewithal to pay, are simply ignored. This is the overriding reason for the existence of mal-nutrition and starvation in the world today: it is not that there is an overall shortage of food - there is more than enough in total terms to feed everyone; the problem, quite simply, is that those who need the food lack the money to pay for it.
Hence the 'free' market, given the degree of inequality which typically exists, is likely to be one in which many people are severely disadvantaged in terms of their market power. 'Electoral successes' will be the fast cars, exquisite jewellery and luxury hotels etc. for those who can pay, with basic health care, education, safe drinking water and nutritious food for the poor almost certainly 'losing their deposits'. Clearly, some consumers are a lot more 'sovereign' than others!
Section 1.4 Market failure - questions
In this section are a series of questions on the topic - market failure. The questions may include various types of questions. For example:
- Self-test questions - on-screen questions that give immediate marking and feedback
- Short-answer questions - a series of short-answer questions to help you check your understanding of the topic
- Numerical - calculation questions
- In the news - questions based around a topical economics news article
Click on the right arrow at the top or bottom of the page to work through the questions.
Market failure - short answer

Market failure - introduction
Question 1
Explain the term market failure.
Question 2
What is short-termism, and what is its role in market failure?
Question 3
(a) Explain why environmental pollution is regarded as a source of market failure.
(b) Evaluate two different policies that a government might implement to reduce pollution.
Question 4
Assess the arguments for and against subsidising public transport.
Question 5
Friedman
"The existence of a free market does not of course eliminate the need for government. On the contrary, government is essential both as a forum for determining the rules of the game and as an umpire to enforce the rules decided on.
What the market does is to reduce greatly the range of issues that must be decided through political means, and thereby to minimise the extent to which government need participate directly in the game. The characteristic feature of action through political channels is that it tends to require or enforce substantial conformity. The great advantage of the market, on the other hand, is that it permits wide diversity. It is, in political terms, a system of proportional representation. Each man can vote, as it were, for the colour of tie he wants and get it: he does not have to see what colour the majority wants and then, if he is in the minority, submit."
Source: Milton Friedman, Capitalism and Freedom (Chicago University Press, 1962)
Thatcher
"Freedom is indivisible. Once the state controls the means of production, distribution and exchange, all of us would become dependent on it." (1986)
Gray
"Hayek's insight is that against a background of stable laws, human individuals, left to their own devices, will produce an order spontaneously which is more complex and more stable than any which could be designed by the human mind. It's also an order ... which embodies their purposes and their goals. The moral defence of the market is that it protects freedom and voluntary exchange: whereas the moral hazard of economic planning is that it subordinates the purposes of some to those of the rulers."
John Gray (Oxford University, 1989)
Part (a)
All three quotes equate "freedom" with a market system. Explain the reasons that the authors would be likely to give for this.
Part (b)
In what ways might a market system not lead to greater "freedom" for all?
Externalities - short answer

Positive and negative externalities
Question 1
Distinguish between private costs and social costs using examples to illustrate your answers.
Question 2
Explain the difference between (i) a social cost and a negative externality and (ii) a social benefit and a positive externality.
Question 3
Re-write and fill in the gaps in the text below:
The existence of negative externalities will lead to a misallocation of resources and over-production at the free market price. The existence of positive externalities will cause a misallocation of resources at the free market price as there will be .........................................................................
Negative externalities cause a divergence between private and social cost.
The private cost is the internal money cost of production incurred by the firm i.e. costs such as ................................................................... Which must be paid to carry out production, and which would appear in the firm's accounts.
The social cost, on the other hand, is the real cost to society; it is the private internal costs plus ....................................
Similarly, if the firm's production decisions were to generate positive externalities, such as the beneficial effects arising from the provision of employment, then there would be a divergence between private and social benefit.
The private benefit is the money value of the benefits accruing internally to the firm from production activity e.g. in the form of sales revenues.
The social benefit, on the other hand, is the private benefit plus ..............................
So, social cost = ...................... + ...................... and social benefit = ...................... + ......................
The difference between the private and social cost is therefore the value of the ...................... and the difference between the private and social benefit is therefore the value of ......................
Externalities & allocative efficiency - short answer

Question 1
Explain in your own words how traffic congestion leads to allocative inefficiency.
Externalities - self-test questions

1 |
Externalities
What type of externality is evident from the picture below?
|

2 |
Externalities
What type of externality is evident from the picture below?
|

3 |
Externalities
What type of externality is evident from the picture below?
|

4 |
Externalities
What type of externality is evident from the picture below?
|

5 |
Externalities
What type of externality is evident from the picture below?
|

6 |
Externalities
The image below shows syringes used for vaccination. What type of externality is evident from this?
|

Public goods - short answer

Question 1
Explain, with the aid of examples, the main characteristics of public goods.
Question 2
To what extent is it desirable that the government should provide public goods?
Question 3
Identify goods that are non-pure public goods, and explain in each case why some excludability and diminishability are possible.
Question 4
Why are health and education not pure public goods?
Question 5
Classify the following goods as either public (P), merit (M) or demerit goods.
| Good | Public (P), merit (M) or demerit (D)? |
|---|---|
| Dentistry | |
| Museums | |
| Birth control | |
| Radio transmissions | |
| Marijuana | |
| Sea defences | |
| Seat belts | |
| Public parks | |
| Nursery education (pre-school) | |
| Loft insulation | |
| Theatres | |
| Lighthouses | |
| Motorways | |
| Cocaine | |
| Vaccinations | |
| Milk | |
| Cigarettes | |
| Alcohol |
Merit goods - short answer

Question 1
Explain, with the aid of examples, the main characteristics of merit goods.
Question 2
To what extent is it desirable that the government should provide merit goods?
Question 3
Discuss the case for and against doctors charging patients for their services
Question 4
Why might housing be described as a merit good?
Question 5
Discuss the arguments for and against the state reducing its role in the direct provision of housing.
Question 6
Classify the following goods as either public (P), merit (M) or demerit goods.
| Good | Public (P), merit (M) or demerit (D)? |
|---|---|
| Health care (free) | |
| Museums | |
| Birth control | |
| Radio transmissions | |
| Marijuana | |
| Sea defences | |
| Seat belts | |
| Public parks | |
| Nursery education (pre-school) | |
| Theatres | |
| Lighthouses | |
| Motorways | |
| Cocaine | |
| Vaccinations | |
| Milk | |
| Cigarettes | |
| Alcohol |
Question 7
The effect of subsidising theatre tickets will, to a large extent, depend on the elasticity of demand for theatre tickets. Draw two diagrams, one with a relatively inelastic demand curve and one with a relatively elastic demand curve. Explain the different effects on price and quantity.
Question 8
"Education, health care and housing are best provided through the market." Discuss.
Demerit goods - short answer

Question 1
Discuss the possible economic arguments for and against the legalisation of cannabis in a country where it is currently illegal.
Question 2
Evaluate the introduction of a government policy to ban smoking in all work places and public places.
Types of goods - self-test questions

1 |
Types of goods
How would you classify the type of good shown in the image below?
|

2 |
Types of goods
How would you classify the type of good shown in the image below?
|

3 |
Types of goods
How would you classify the type of good represented by the image below?
|

4 |
Types of goods
How would you classify the type of good shown in the image below?
|

Government responses - short answer

Question 1
Explain the functions that prices perform in a market economy
Question 2
Assess the case for and against using the price mechanism to relieve the problem of traffic congestion.
Question 3
Discuss the importance of the distinction between private costs and social costs for a government considering whether or not to help finance the construction of a new railway line.
Question 4
What remedies could the government take to remedy the allocative inefficiency arising from traffic congestion?
Common access resources - activities

Read the article A solution can never manifest itself if it comes at the cost of other party and answer the following questions.

Question 1
Define the term 'common pool resources'
Question 2
Outline two reasons why the fishing resources in the Palk Straits and the Gulf of Mannaw can be described as a common pool resource.
Question 3
Explain, how the governments of Sri Lanka and India are limited in their responses to the threat to sustainability of their fishing stocks, by the global nature of the fishing resources.
Question 4
Using diagrams and information from the article and your knowledge of economics, evaluate the extent to which the government of Sri Lanka can address the issue of conservation and management of its fish stocks through cooperation with the Indian government.
Overexploitation - questions
Overexploitation occurs when a water resource, such as the Ogallala Aquifer, is extracted at a higher rate than is sustainable.

Read the article Governor Brownback and the Ogallala Aquifer in Kansas and consider the following questions:

Question 1
Explain why the Ogallala Aquifer is considered an 'engine of economic growth'
Question 2
Explain why the Ogallala Aquifer is prone to exploitation and over-consumption and why policy changes aimed toward sustainability require collective action.
Question 3
Outline the policy solutions available to protect degradation of water resources in Kansas and discuss to what extent these are easier to implement than the policies designed to conserve and manage fishing stocks in Sri Lanka.
Sustainability - report
PwC is one of the world's largest providers of assurance, tax, and business consulting services.

Read extracts from the Pwc climate change and sustainability blog on 2010 United Nations Climate Change Conference held in Cancún, Mexico.

Produce a 500 -750 word article for an environmental journal on the purpose and scope of the Cancún conference, and its achievements, compromises and disappointments.
You may wish to read this Wikipedia article and conduct additional Internet research to provide the background for your article, possibly using the footnotes to the Wikipedia article to find the original sources.
Plastic bags - carrying the weight of the environment?
Read the article Plastic bag bans around the world and then consider answers to the questions below. You can either read the article in the window below or you can follow the previous link to read the article in a separate window.

You may also wish to read the following article to support your answer:
- New York mayor signs plastic bag recycling bill
- Pay for your bag AND help good causes: Simple plan to cut plastic and raise £50m

Once you have read this article then listen to the following podcast:

Question 1
Identify the external costs and external benefits that result from the use of single-use plastic bags.
Question 2
Using diagrams, as appropriate, show how the use of single-use plastic bags results in the socially optimal equilibrium differing from the market equilibrium.
Question 3
Analyse the effectiveness of banning the use of plastic bags as a policy to reduce the environmental impact of carrying goods from shops.
Question 4
Evaluate two policies, other than bans, that governments could use to reduce the environmental impact of the use of plastic bags.
Running cars on biofuels can be unethical
Read the article Running cars on biofuels can be unethical and then answer the questions below. You can either read the article in the window below or you can follow the previous link to read the article in a separate window.

You may wish to read the following articles to help you answer the questions:

Question 1
Identify the external costs and external benefits that result from the use of biofuels as a partial source of fuel for drivers in the developed world.
Question 2
Analyse the impact on the market for petrol of the increased use of biofuels.
Question 3
With reference to the article, discuss whether the growing use of biofuels increases or reduces the external costs of driving in the developed world.
Question 4
Discuss the extent to which governments in the developed world need to adopt policies to reduce demand for driving as opposed to introducing biofuels to reduce the overall environmental impact.
Cement - the hidden polluter?
Read the article The unheralded polluter: cement industry comes clean on its impact and then consider answers to the questions below. You can either read the article in the window below or you can follow the previous link to read the article in a separate window.

Question 1
Define the terms:
- External costs
- Social costs.
Question 2
With reference to the article, identify the main external costs resulting from the production of cement.
Question 3
Analyse the extent to which there is a "trade-off between development and sustainability" as identified by Dimitri Paplexopoulos, managing director of Titan Cement.
Question 4
Discuss policies that governments could adopt to try to move the market for cement to a more socially optimal equilibrium.
African roses - a sign of change
Read the article Flowers are sign of economic change in Ethiopia and then answer the questions below. You can either read the article in the window below or you can follow the previous link to read the article in a separate window.

You may also like to read the following article relating to African flowers:

Question 1
Define the terms:
- social costs
- social benefits
Question 2
Draw a diagram to show the social optimum in the market for roses.
Question 3
Compare and contrast the social costs and social benefits (including both private and external costs) of buying roses produced in Europe and those produced in Africa.
Congestion charging
Read the article Leafy Kensington shows its anger and then consider answers to the questions below. You can either read the article in the window below or you can follow the previous link to read the article in a separate window.

Question 1
Identify two external costs resulting from traffic congestion in London.
Question 2
Using diagrams, as appropriate, explain the impact of the extended congestion zone on traffic levels in London.
Question 3
Discuss whether the implementation of a larger congestion zone will help move closer to a socially optimal position in this market.
Question 4
Choose one other measure that the Mayor of London could introduce to meet emissions targets for the city and evaluate its likely success.
Putting a price on carbon
Read the article China plans carbon trading pilot scheme and then answer the questions below. You can either read the article in the window below or you can follow the previous link to read the article in a separate window.

You may also like to read the following articles relating to carbon trading schemes:

Question 1
Define the terms:
- tradable permit
- carbon trading scheme
Question 2
Explain how the use of cap and trade schemes is intended to reduce emissions of CO2.
Question 3
Explain the scope and objectives of the Kyoto Protocol.
Question 4
Discuss the relative merits of using carbon taxation as a policy to help meet emissions targets in comparison to cap and trade schemes.
Question 5
According to the Stern Review ".... the second ingredient necessary to tackle climate change [i]s a range of policies to support the development of low-carbon and high-efficiency technologies." Identify two policies that would help achieve this and evaluate their likely success.
Extension activity:

Reducing Carbon emissions
Investigate the success of recent schemes and agreements to reduce carbon emissions. Prepare a 500 - 1000 word report on your findings, including some of the following:
- An explanation of the focus and/or success of Kyoto Protocol, the UN Framework Convention on Climate Change and the Copenhagen and Cancún Summits on climate change.
- A comparison of the relative merits of a cap-and-trade system and carbon taxes.
- An analysis of whether the total number of permits allocated should be reduced.
- An evaluation of alternative policy approaches to encouraging green investment.
Power bills to soar in 'green reforms'
Read the articles Power bills to soar by 30% in 'green' reforms and Three solutions in one to a string of problems the free market could not deal with then answer the questions below. You can either read the articles in the window below or you can follow the previous link to read the articles in a separate window.

Question 1
Define the following terms:
- Central planning
- Privatisation
Question 2
Explain the operations of the electricity market reforms (EMR).
Question 3
Analyse the costs and benefits of the proposed electricity market reforms.
Question 4
Discuss the view that government needs to regulate the energy, because the free market cannot address the issue of energy shortages without creating unacceptable negative externalities.
Extension Activity:

European Green Capital 2010
What lessons can be learned from Stockholm's approach to their urban environment and in particular their urban policies on traffic congestion, waste management, pollution and the emission of greenhouse gasses? Could these be applied in the areas where you live?

Identify and explain 5 key environmental approaches used in Stockholm that could be applied to other global cities.
Beyond Kyoto
 Kyoto is the only international agreement with binding targets for curbing greenhouse gas emissions, but China and the United States, the world's biggest polluters, are not subject to its constraints. Under Kyoto, developed countries are allowed to establish domestic and internationally linked emissions trading schemes and purchase emissions reductions in developing countries and count them as their own. But on December 31 2012, Kyoto will expire without a successor agreement.
Since the 2007 Bali summit countries have been in a negotiating deadlock over different paths for a post-Kyoto agreement. Developing countries want a second Kyoto emissions reduction period because it puts the entire onus on developed countries.
Non-European developed countries want a new non-binding agreement that brings all the leading emitters into the tent. European countries want a mix of both. The failure to agree over what was being negotiated, let alone the detail, led to the eruption at the 2009 Copenhagen summit.
The absence of a global framework undermines the political and policy case for prioritising emissions cuts. Any knowledge of international relations - or human nature - should tell us that a non-binding treaty on climate change is about as effective as a peace vigil in a bombing raid. Staying with a non-binding treaty model means we are all unhappy and the planet is doomed. Good diplomacy is, as always, about taking what you can get.


You have been asked by a student run economics website to write a blog post on the theme of climate change. The editor has asked that the post summarises the recent history of international summits on climate change and then comments on the possibility of reaching a further international agreement on emissions following the expiry of the Kyoto agreement. You have decided to entitle your post 'Beyond Kyoto'.
Use the following links as a starting point for your research:

- Cancun climate change summit seeks new emissions deal
- Climate change 'Dragons' Den': What are the options?
- Post-Copenhagen, a Cancun compromise?

You may also like to read the following articles relating to climate change:
Economic growth cannot continue
Read the article Economic growth 'cannot continue' and then answer the questions below. You can either read the article in the window below or you can follow the previous link to read the article in a separate window.
 Question 1
Define the terms:
- Economic growth
- Natural resources
Question 2
Examine the economic costs that are likely to result from climate change.
Question 3
Choose one policy that a government could adopt to reduce climate change and evaluate its likely success.
Question 4
To what extent can the following views of the NEF and the Adam Smith Institute be reconciled?
We urgently need to change our economy to live within its environmental budget. A new macroeconomic model is needed, that allows the human population as a whole to thrive without having to relying on ultimately impossible, endless increases in consumption.
National Economic Foundation. (NEF)
It is precisely economic growth which will lift the poor out of poverty and improve the environmental standards that really matter to people - like clean air and water - in the process, as it has done throughout human history. There's only one good thing I can say for the Nef's report, and that's that it is honest. Its authors admit that they want us to be poorer and to lead more restricted lives for the sake of their faddish beliefs.
Adam Smith Institute
The rush to find Jade
Read the article China's new jade rush as prices soar and then answer the questions below. You can either read the article in the window below or you can follow the previous link to read the article in a separate window.

Question 1
Identify two external costs and two external benefits that may result from the 'jade rush' taking place on the Kashgar River
Question 2
Identify the factors that have caused the price of Hotan Jade to increase so dramatically.
Question 3
Using diagrams, as appropriate, show the socially optimal level of jade output and price.
Question 4
Evaluate possible policies that the Chinese authorities could adopt to minimise the external impact of prospecting for jade on the Kashgar River.
Chopstick tax
Read the article Chopsticks: The cutlery conundrum and then consider answers to the questions below. You can either read the article in the window below or you can follow the previous link to read the article in a separate window.

Question 1
Identify and explain the external costs and external benefits resulting from the use of disposable wooden chopsticks in China.
Question 2
Discuss the likely effectiveness of the 5% chopsticks tax on reducing the demand for chopsticks. You should consider the likely value of the price elasticity of demand in your answer.
Question 3
With the use of appropriate diagrams, assess the likely impact of the chopsticks tax on the equilibrium level of price and output in the market for disposable chopsticks.
Taxing light bulbs - that's a bright idea
Read the article Bright idea and then answer the questions below. You can either read the article in the window below or you can follow the previous link to read the article in a separate window.


Question 1
Explain, with reference to external costs and external benefits, why campaigners argue for a tax on incandescent light bulbs.
Question 2
Using diagrams, as appropriate, show the impact of a tax on incandescent light bulbs on (a) the market for incandescent light bulbs and (b) the market for energy efficient bulbs.
Question 3
Evaluate two further policies that governments could adopt to reduce carbon emissions resulting from energy use.
Trading pig excrement
Trading pig excrement - a particularly smelly form of market failure
Pig meat accounts for nearly 40% of global meat consumption. Pigs emit methane from their nether regions (excrement) and these are a contributory factor to global warming. Under EU rules for emissions, this increases farmer's costs. So what's the solution? Well agricultural firms can capture the methane and then use it as a bio-fuel rather than allowing it to be emitted into the atmosphere. Farmer's will then be able to claim carbon credits under EU emissions trading market.
No, this really isn't an April Fool! Read the following articles: Pig manure means big bucks and Where there's muck, there's brass and answer the questions below. You can read these in the windows below, or follow the previous link to read the article in a separate window. Then answer the questions below questions below.

You may also like to read the following articles relating to recycling methane from pigs:

Question 1
Explain why methane emissions are considered a form of market failure.
Question 2
Using diagrams, as appropriate, show how methane emissions from pig waste may result in a misallocation of resources.
Question 3
Using the diagrams from question 2, show the impact of using technology to collect the methane from pigs and sell it or use it to gain carbon credits.
Question 4
Examine how the EU carbon emissions trading system help to reduce emissions of greenhouse gases.
Question 5
Evaluate two policies that the government could implement to encourage the use of alternative fuels like the new pig fat bio-diesel.
Congestion pricing
Urban road transportation creates several externalities, the most important of which are congestion (time delay and extra fuel consumption), accidents, pollution, and greenhouse gas emissions. Road pricing is widely promoted as a tool to reduce these externalities.
Read the article In London, a charge to drive eases up the roads and then answer the questions below. You can either read the article in the window below or you can follow the previous link to read the article in a separate window.


You may also like to read the following articles and watch the embedded video relating to congestion pricing:

Question 1
Define the terms:
- Sustainability
- External costs
Question 2
Explain the reasons for charging drivers for the use of roads.
Question 3
In the light of the report quoted in the article, discuss the likely success of road charging as a policy to reduce congestion on the roads.
Question 4
Evaluate two further policies that a government could use to reduce the level of traffic congestion.

Extension activity: New York Congestion Pricing
New York congestion pricing was proposed in 2006 by New York City Mayor Michael Bloomberg's for vehicles travelling into, or within, the Manhattan central business district. The congestion pricing charge was one component of PlaNYC 2030; a policy to improve the city's future environmental sustainability, while planning for population growth.
However, the opposition to the scheme was so overwhelming, that the proposal was never put to a vote.

Using the web links and video below, write a 500 - 1000 word report:
- explaining the nature and operations of a congestion charge
- outlining the cases for and against congestion pricing in Manhattan
- identifying the stakeholders involved in New York City, explaining why they support or oppose congestion charging
- identifying and evaluating alternatives to congestion pricing as a way of reducing traffic problems in New York city

Congestion Pricing

You may also like to read the following articles relating to New York's proposed congestion charge:
Packaging tax
Read the article A tax on packaging would hurt Irish business and hit the poor and then answer the questions below. You can either read the article in the window below or you can follow the previous link to read the article in a separate window.

Question 1
Explain why Ireland is proposing a tax on packaging waste.
Question 2
Discuss the likely effectiveness of this tax in increasing the level of packaging waste.
Question 3
Suggest two further strategies for the government to adopt to increase the level of recycling and evaluate the likely success of one of these.

Check your sources...
Note that the article, 'A tax on packaging would hurt Irish business and hit the poor', represents the views of the packaging industry. Can you find 'other voices' which support taxation on packaging in Ireland and/or other countries?
Airport expansion plans
Read the article To Expand, Airports May Need Radical Alterations, Report Says and then answer the questions below.


You may also like to read the following additional articles and watch the associated video to support your answers:

Question 1
Define the terms:
- negative externalities of production/external costs
- demerit good
Question 2
Explain how aeroplane flights may create either a negative externality of consumption or a negative externality of production.
Question 3
With the use of diagrams evaluate the arguments for and against the expansion of Kennedy airport.
Section 1.4 Market failure - simulations and activities
In this section are a series of simulations and activities on the topic - market failure. These simulations and activities might include:
- Interactive diagrams - diagrams where you can drag curves or sliders to see the impact of the changes on the diagram
- PlotIT - a chance to build diagrams from data
- Step-by-step - diagrams built up step by step to help you see how to draw them and understand the principles behind the diagram
Click on the right arrow at the top or bottom of the page to move on to the next page.
Step-by-step - negative consumption externalities
In this section we look at step by step versions of the externalities diagrams. It is worth going through these to see how the different externalities affect the market.
If you would prefer to view this interaction in a new web window, then please follow the link below:
Step-by-step - positive consumption externalities
If you would prefer to view this interaction in a new web window, then please follow the link below:
Step-by-step - negative production externalities
If you would prefer to view this interaction in a new web window, then please follow the link below:
Step-by-step - positive production externalities
If you would prefer to view this interaction in a new web window, then please follow the link below:
1.5 Theory of the firm
In the previous sections we explained markets, the rules of supply and demand, market equilibrium, the price mechanism and market efficiency and how demand and supply are used to calculate market price and plot market equilibrium. We then explained the concepts of elasticity, considered the role and effects of government intervention in the economy and examined the concept of market failure. In this section we examine the theory of the firm.
By the end of this section you should be able to:

- Distinguish between the short run and long run in the context of production.
- Define total product, average product and marginal product, and construct diagrams to show their relationship.
- Explain the law of diminishing returns.
- Calculate total, average and marginal product from a set of data and/or diagrams.
- Explain the meaning of economic costs as the opportunity cost of all resources employed by the firm (including entrepreneurship).
- Distinguish between explicit costs and implicit costs as the two components of economic costs.
- Explain the distinction between the short run and the long run, with reference to fixed costs and variable costs.
- Distinguish between total costs, marginal costs and average costs.
- Draw diagrams illustrating the relationship between marginal costs and average costs, and explain the connection with production in the short run.
- Explain the relationship between the product curves (average product and marginal product) and the cost curves (average variable cost and marginal cost), with reference to the law of diminishing returns.
- Calculate total fixed costs, total variable costs, total costs, average fixed costs, average variable costs, average total costs and marginal costs from a set of data and/or diagrams.
- Distinguish between increasing returns to scale, decreasing returns to scale and constant returns to scale.
- Outline the relationship between short-run average costs and long-run average costs.
- Explain, using a diagram, the reason for the shape of the long-run average total cost curve.
- Describe factors giving rise to economies of scale, including specialization, efficiency, marketing and indivisibilities.
- Describe factors giving rise to diseconomies of scale, including problems of coordination and communication.
1.5 Theory of the firm - notes (HL only)

 In this section of the module, we start to look at the basis of supply. We know that consumers create demand and that firms create supply, but we need to look at the behaviour of firms in more detail if we are to understand supply fully.
The first stage of this is to look at the costs of production. This may seem an odd place to start, but costs are fundamental to supply. Firms exist to make a profit - that is their key objective. If their costs rise, then they will be more reluctant to supply and so we need to understand the costs they face.
In this section we consider the following topics in detail:
- Cost theory
- Short-run
- Long-run
- Revenues
- Profit maximisation
- Perfect competition
- Monopoly and oligopoly - introduction
- Monopolistic competition
- Oligopoly
- Price discrimination
Cost theory
If you would prefer to view this interaction in a new web window, then please follow the link below:
If you would prefer to view this interaction in a new web window, then please follow the link below:
Calculating costs
You also need to be able to calculate a firm's costs from given data, be able to draw cost curves and then interpret what they mean. We come to that skill later.
You will also need to identify and explain short-run and long-run cost curves. Look carefully at the following examples.
Figure 3 Short-run average cost curve
Figure 4 Long-run average cost curve
In the short-run, at least one factor input is fixed. In the long-run all inputs are variable. This means that short-run curves are models of what is happening. Long-run curves are planning data. A firm cannot operate with all inputs variable. Having decided what it wants from an examination of the long-run curves, the firm makes a decision to fix a factor, usually capital, and this gives rise to a new short-run situation.
Now, the calculations and the drawing!
You could be presented with data in the form of a table, like the one below
| Output (units | 0 | 1 | 2 | 3 | 4 | 5 | 6 | 7 | 8 | 9 | 10 |
|---|---|---|---|---|---|---|---|---|---|---|---|
| Total cost ($k) | 100 | 110 | 125 | 145 | 170 | 200 | 235 | 275 | 320 | 370 | 425 |
Plot this with output on the horizontal axis and total cost on the vertical axis and look at it.
There is also a static version of this graph available.
What do you know now?
- The firm has fixed costs of $100,000, the cost of 'output zero'.
- The total variable cost is increasing with increasing output

Now, some more sums. Work out the average cost (TC / output), the total variable cost (TC - FC), the variable cost (TVC / output), the average fixed cost (FC / Output) and the marginal cost (TC (Qx) - TC (Qx-1)).
Once you have had a go at calculating all these, follow the answer link below to compare how you got on.
Answer - cost calculations
Now plot this data on two separate graphs as follows, and see what it shows.
Graph 1 - Total cost, total variable costs and total fixed costs
Graph 2 - Marginal cost, average cost, average fixed cost and average variable cost
You should get the following:
Graph 1 Total cost, total variable costs and total fixed costs
There is also a static version of this graph available.
Graph 2 - Marginal cost, average cost, average fixed cost and average variable cost
There is also a static version of this graph available.
- Average cost (AC) falls initially, then turns and starts to rise.
- AFC + AVC = AC.
- MC follows the same pattern, but at a more exaggerated rate.
- Marginal cost and average cost cross at the minimum average cost.
See Figure 6 below for the standard representation of these curves.
Why do average and marginal cost cross at the minimum point of average cost?
Well think of this in terms of cricket scores. Your last innings is your 'marginal' innings, whereas your batting average is your 'average'. Say your average is 50 and in your next innings you get 20 runs. What happens to your average? It will fall. However, if in your next innings you get 80 runs. In this case your average will rise.
So, if the marginal is below the average, the average will fall and if the marginal is above the average, the average will rise.
There are many questions for you to work on in the questions section (click on the questions - module 2 link in the left hand navigation bar). It may also be worth having a look at the Diggin' diagrams sections (accessible from the course homepage) to check how well you understand your diagrams.
Summary
Remember, a standard marginal and average cost curve diagram should look like this:
Figure 5 Marginal and average cost
Add in the average fixed and average variable cost curves and it should look like this:
Figure 6 Marginal cost, average cost, average fixed cost and average variable cost
Short-run
It is important to know the difference between the short run and the long run. The law of diminishing returns is a short run law. Economies and diseconomies of scale occur in the long run.

Short run
The short run is the period of time in which at least one factor of production is fixed. Over this time period the firm can only expand production by using more of the variable factor.

Long run
The long run is the period of time when all factor inputs, including capital, can be changed.
You need to remember these as the time period makes a big difference to how the firm can react to changes in circumstances. In the short-run their capacity is fixed and so all they can do is employ more variable factors. They cannot expand the scale or size of the firm. In the long-run though they can. We put the word scale in bold just now because it is important - economies of scale will only arise in the long-run. In the short-run we get diminishing returns to a factor (because the firm can only change the variable factor).
If you would prefer to view this interaction in a new web window, then please follow the link below:
This theory supports the shape of the marginal and average cost curves. Both of these curves will be u-shaped as eventually diminishing returns will lead to costs increasing. Initially increasing returns mean that both AC and MC will fall, but once diminishing returns set in both curves start to rise again. The MC and AC curves are shown in Figures 2 and 3, although we will return to these in more detail in the next section.
Figure 2 Marginal cost curve
Figure 3 Average cost curve
The marginal cost curve will intersect the average cost curve at its minimum point.
The actual position of the AC curve will vary with a number of factors.
- Costs of factor inputs (labour, materials, services etc). The cheaper the inputs the lower the average cost will be at any given output.
- Productivity - productivity can be defined as output per unit input. The more productive the firm, the more output it gets from its inputs and the lower the average cost at any output.
Productivity is measured in a number of ways:
- Marginal product (MP) - the change in total output resulting from the adding of one extra unit of a variable factor, often labour.
- Average product (AP) - total output / units of variable factor being used.
The choice of factor inputs will be driven by their costs, productivity and effect on product cost. An efficient firm will make its choices so as to minimise its average cost at the production rate being worked. Look at the following example.

Example
Student Computers make DVD drives. Its average cost curve is shown in figure 4 below.
Figure 4 Average cost curve for Student Computers on 1st May 2002
The following then takes place:
Business rates increase (fixed costs (FC))
Insurance premiums rise (FC)
Wage rates (variable costs (VC)) and salaries (FC) increase
This will change the cost curves. The curve will move upwards due to the increase in fixed costs. The average cost of production at the present output will rise from C1 to C2. Unless something is done about it, the profits will fall.
Figure 5 Average cost curves for Student Computers on date 1
In response to these changes the research and development department introduces new materials that are cheaper to buy than the old ones. They also introduce new working practices and procedures that increase productivity considerably. The savings are shared between the firm and its employees. This all reduces variable costs and the AC curve falls again. Now the production average cost, at C3, is lower than before.
Figure 6 Average cost curves for Student Computers on date 2
The firm has responded to rises in certain costs by taking steps to reduce others.
Long-run
First let's remind ourselves of the definitions and what type of economies of scale there are. It is important to remember that economies/diseconomies of scale occur in the long run, with all factors variable.

Economies of scale
Economies of scale are the advantages that an organisation gains due to an increase in size. These will lead to a decrease in the average costs of production.

Diseconomies of scale
Diseconomies of scale are the disadvantages that an organisation experiences due to an increase in size. They will increase the average costs per unit.
If you would prefer to view this interaction in a new web window, then please follow the link below:
Internal economies of scale
If you would prefer to view this interaction in a new web window, then please follow the link below:
External economies of scale
If you would prefer to view this interaction in a new web window, then please follow the link below:
Diseconomies of scale
If you would prefer to view this interaction in a new web window, then please follow the link below:
Long run cost curves
The long run cost curve of a firm is sometimes called an 'envelope' curve as it envelopes all the short run average cost curves. Consider the different ways that capital intensive and labour intensive industries develop. First, some definitions:
- Capital-intensive firm - firm where its cost structure is dominated by fixed costs.
- Labour intensive firm - firm where its cost structure is dominated by variable costs (this may be, but does not have to be labour).
- Cost structure - the relationship between fixed and variable costs for a firm.
Capital-intensive activities have long, deep long-run average cost curves. Small firms cannot compete against large ones; the difference in average cost is too great. A few large firms, with perhaps a few small but very specialist businesses, will dominate industries. Examples here would include the petro-chemical industries. Look at Figure 2.
Figure 2 Long-run AC curve for capital-intensive business
Labour intensive activities have short and relatively flat long-run average cost curves. There is little advantage in being large, so the industry develops with many small firms. Examples would include the fishing industry in Asian countries where the industry comprises many family-run firms using basic fishing equipment and small boats. Look at Figure 3.
Figure 3 Long-run AC curve for labour intensive business
This means that it is very expensive to try to enter a capital-intensive industry. The minimum scale of operation will be high and will require a large investment of capital. The risk will be high, and the capital will be hard to raise. The cost becomes a real barrier to entry. The potential reward, however, will be large.
On the other hand, it is much easier to enter a labour intensive industry. The minimum scale of operation will be low, as will be the initial capital investment. The risk will be low, and not much capital will need to be raised. Cost will not be a barrier to entry, but the potential rewards are also smaller.

1 |
Economies of scaleMatch the following examples of economies of scale with their classification. |
2 |
Capital and labour intensiveWhich of the following industries would you expect to be capital intensive? (Select all appropriate answers) |
The very long run
So far we have looked at the short-run and the long-run. We now meet the very long run.

Very long run
Where changes in technology make major changes in costs possible.
Invention, innovation and technological change gives some firms a huge cost advantage in some industries, and brings into existence new industries in their own right.
A new invention, protected by patent, obviously gives its inventor a huge advantage. This is the way that the pharmaceutical industry works.

Patent
A document granting monopoly powers to the inventor of something for a period of time (up to 20 years) to allow it to recover its investment and make a reasonable return on it.
Within existing industries a smallish firm making a technological breakthrough can gain a cost advantage and become dominant. Look at the diagram below.
Figure 1 Effect of technical breakthrough on competitive position of a firm
Innovation and invention has to be paid for, and research and development is an expensive exercise with no guarantee of success. Investing firms aim to protect and exploit their inventions, whilst others aim to obtain and use this research.
Major breakthroughs are few and far between, but yield big gains. They are costly.
Revenues
By the end of this section you should be able to:

- Distinguish between total revenue, average revenue and marginal revenue.
- Illustrate, using diagrams, the relationship between total revenue, average revenue and marginal revenue.
- Calculate total revenue, average revenue and marginal revenue from a set of data and/or diagrams.
Revenues - notes
Revenue is the income a firm obtains from the sales of its goods or services. Three terms must be understood:

- Total revenue (TR) - all the revenue earned by the business. Total revenue = price x quantity demanded.
- Average revenue (AR) - total revenue divided by number sold.
- Marginal revenue (MR) - the increase in total revenue as the result of one more sale. This is not necessarily the same as the price. It is only the same as price, if price remains constant.
Revenue curves vary depending on whether price is constant at all levels of output (as in the case of a firm which is a price-taker), or falls as output increases (as in the case of a firm who is a price-setter). Look at Figures 1 and 2 below to see the difference this makes to the shape of the average / marginal revenue and total revenue curves:
Figure 1 Revenue curves - constant price (price-taker)
Figure 2 Revenue curves - falling price (price-setter)
You have to be able to calculate revenue, in any form, from data, then draw and interpret curves. Time for an example, and for you to do some work again!
| Output (units) | 0 | 1 | 2 | 3 | 4 | 5 | 6 | 7 | 8 | 9 | 10 |
|---|---|---|---|---|---|---|---|---|---|---|---|
| Total revenue ($ 000) | 0 | 100 | 180 | 240 | 280 | 300 | 300 | 280 | 240 | 180 | 100 |
Plot this with output on the horizontal axis and revenue on the vertical axis. Look at it and then we will do some more calculations.
There is also a static version of this graph available.
Total revenue rose at first, reached a maximum, and then declined.

From the total revenue curve data above, now calculate the figures for marginal revenue and average revenue. Once you have had a go, click on the answer link below to check your calculations.
Answer - revenue calculations
Now, plot the marginal and average revenue curves from this data as well. Examine it. What does it tell you?
There is also a static version of this graph available.
Observation of the graph shows:
- Both AR and MR fall as output increases.
- AR and MR start at the same point on the Y-axis, at the same level of revenue.
- MR can and does become negative.
- Using the first graph as well, when MR is zero, TR is at its maximum. Output is 5.5 units.
Profit
By the end of this section you should be able to:

- Describe economic profit as the case where total revenue exceeds economic cost.
- Describe normal profit as the amount of revenue needed to cover the costs of employing self-owned resources (implicit costs, including entrepreneurship) or the amount of revenue needed to just keep the firm in business.
- Explain that economic profit is profit over and above normal profit, and that the firm earns normal profit when economic profit is zero.
- Explain why a firm will continue to operate even when it earns zero economic profit.
- Explain the meaning of loss as negative economic profit arising when total revenue is less than total cost.
- Calculate different profit levels from a set of data and/or diagrams.
- Explain the goal of profit maximization where the difference between total revenue and total cost is maximized or where marginal revenue equals marginal cost.
- Describe alternative goals of firms, including revenue maximization, growth maximization, satisficing and corporate social responsibility.
Profit - notes
Within economics you will meet:

- Normal profit - is that level of profit which is just sufficient to keep the firm in its present use. Normal profit is assumed to be an element of the ATC curve.
- Supernormal profit (or abnormal profit)- this is any profit made in excess of normal profit.
The definitions of supernormal and normal profit mean that profit on a diagram drawn by an economist shows supernormal profit only. Normal profit is included as an element of the ATC curve and arises where ATC = AR. Examine the following diagrams (we'll look at how to build these diagrams in more detail later on):
Figure 3 Firm in perfect competition - supernormal profit
Figure 4 Monopoly - supernormal profit
This has to be compared with the accountant's definition of profit.
Accounting profit
The difference between revenue from sales and the costs incurred in making these sales, regardless of any credits given or taken.
Accountants deal in facts. They do not get involved with concepts such as normal profit. Governments tax accounting profit, not normal profit.
Why do firms try to make a profit?
Profit has many uses:
- It is the return to the entrepreneur.
- It is a source of funds for development
- It is a motivator.
Profit is a driving force within business. It is an incentive for investors to invest. It lies behind all cost reduction exercises, as the aim of cost reduction is profit maximisation.
Combining revenue and cost curves
Now, some diagrammatical work. Let's combine the two examples developed in this section and the figures from the previous notes on costs. This gives us the data below.
| Output (units) | 0 | 1 | 2 | 3 | 4 | 5 | 6 | 7 | 8 | 9 | 10 |
|---|---|---|---|---|---|---|---|---|---|---|---|
| Total cost ($ 000) | 100 | 110 | 125 | 145 | 170 | 200 | 235 | 275 | 320 | 370 | 425 |
| Total revenue ($ 000) | 0 | 100 | 180 | 240 | 280 | 300 | 300 | 280 | 240 | 180 | 100 |
| Profit ($ 000) | -100 | -10 | 55 | 90 | 110 | 100 | 65 | 15 | -80 | -190 | -325 |
| Marginal revenue ($ 000) | 100 | 80 | 60 | 40 | 20 | 0 | -20 | -40 | -60 | -80 | |
| Marginal cost ($ 000) | 10 | 15 | 20 | 25 | 30 | 35 | 40 | 45 | 50 | 55 |
Now let's plot yet another graph. From the table above plot the marginal cost, marginal revenue and profit figures. You should get a graph looking like the figure below.
There is also a static version of the graph available.
See clearly that the profit is maximised when MC = MR. You can see this from the graph, but can confirm from the data that this is the case as well.
Profit maximisation - price taker
If you would prefer to view this interaction in a new web window, then please follow the link below:
Profit maximisation - price setter
If you would prefer to view this interaction in a new web window, then please follow the link below:
Alternative aims of firms
If you would prefer to view this interaction in a new web window, then please follow the link below:
Profit, sales and revenue maximisation
If you would prefer to view this interaction in a new web window, then please follow the link below:
State owned companies
State owned (nationalised) companies or corporations are often thought to be 'good' because they are not profit maximisers. It is argued that they act 'in the public interest', avoid externalities, and minimise wasteful activities. However, this may not always be seen on examination of real nationalised corporations since many operate inefficiently and rely on government subsidies to survive, thus costing the taxpayer money.

Identify some state-owned companies in your own country. Quite often companies providing postal services, telecommunications and nuclear energy might feature in such a list. Since the collapse of many banks, resulting from a lack of adequate regulation in the banking sector, in the USA and across Europe, many are wholly or part-owned by their government who bailed them out financially. Research the background to some of the companies you have identified. You may find it most interesting, especially when you see how much of the tax payers money has been used!
Perfect competition
By the end of this section you should be able to:

- Describe, using examples, the assumed characteristics of perfect competition: a large number of firms; a homogeneous product; freedom of entry and exit; perfect information; perfect resource mobility.
- Explain, using a diagram, the shape of the perfectly competitive firm's average revenue and marginal revenue curves, indicating that the assumptions of perfect competition imply that each firm is a price taker.
- Explain, using a diagram, that the perfectly competitive firm's average revenue and marginal revenue curves are derived from market equilibrium for the industry.
- Explain, using diagrams, that it is possible for a perfectly competitive firm to make economic profit (supernormal profit), normal profit or negative economic profit in the short run based on the marginal cost and marginal revenue profit maximization rule.
- Explain, using a diagram, why, in the long run, a perfectly competitive firm will make normal profit.
- Explain, using a diagram, how a perfectly competitive market will move from short-run equilibrium to long-run equilibrium.
- Distinguish between the short run shut-down price and the break-even price.
- Explain, using a diagram, when a loss-making firm would shut down in the short run.
- Explain, using a diagram, when a loss-making firm would shut down and exit the market in the long run.
- Calculate the short run shutdown price and the breakeven price from a set of data
- Explain the meaning of the term allocative efficiency.
- Explain that the condition for allocative efficiency is P = MC (or, with externalities,
- MSB = MSC).
- Explain, using a diagram, why a perfectly competitive market leads to allocative efficiency in both the short run and the long run.
- Explain the meaning of the term productive/technical efficiency.
- Explain that the condition for productive efficiency is that production takes place at minimum average total cost.
- Explain, using a diagram, why a perfectly competitive firm will be productively efficient in the long run, though not necessarily in the short run.
Perfect competition - notes
Assumptions of the model
 Perfect competition is considered as the ideal or the standard against which everything is judged. Perfect competition is characterised as having:
- Many buyers and sellers. Nobody has power over the market.
- Perfect knowledge by all parties. Customers are aware of all the products on offer and their prices.
- Firms can sell as much as they want, but only at the ruling price. Thus sellers have no control over market price. They are price takers, not price makers.
- All firms produce the same product, and all products are perfect substitutes for each other, i.e. goods produced are homogenous.
- There is no advertising.
- There is freedom of entry and exit from the market. Sunk costs are few, if any. Firms can, and will come and go as they wish. There are no barriers to entry such as licenses.
- Companies in perfect competition in the long-run are both productively and allocatively efficient.
Equilibrium under perfect competition
In perfect competition, the market is the sum of all of the individual firms. The market is modelled by the standard market diagram (demand and supply) and the firm is modelled by the cost model (standard average and marginal cost curves). The firm as a price taker simply 'takes' and charges the market price (P* in Figure 1 below). This price represents their average and marginal revenue curve. Onto this we superimpose the marginal and average cost curves and this gives us the equilibrium of the firm.
Figure 1 Equilibrium of the firm and industry in perfect competition
Firms in equilibrium in perfect competition will make just normal profit. This level of profit is just enough to keep them in the industry and since profits are adequate they have no incentive to leave.

Normal profits
Normal profit is the level of profit that is required for a firm to keep the resources they are using in their current use. In other words it is enough profit to keep them in the industry. Anything in excess of normal profits is called abnormal or supernormal profits.
Any profit above normal profit is a 'bonus' for the firms, as it is more than they need to keep them in the industry. We call this supernormal (or abnormal) profit. However, this supernormal profit will be a signal to other firms and will attract more firms into the industry. If firms are making consistently below normal profits then they will choose to leave the industry.
Short-run to long-run - profits
If you would prefer to view this interaction in a new web window, then please follow the link below:
Short-run to long-run - losses
If you would prefer to view this interaction in a new web window, then please follow the link below:
Shut down price, break-even price
The break-even price in perfect competition is where normal profits are made and AR = P = ATC = MC = MR. This is shown in Figure 1 below.

Figure 1 Perfect competition - break-even price
If you would prefer to view this interaction in a new web window, then please follow the link below:
Do perfectly competitively industries exist?
No 'perfect' perfectly competitive industries exist. Ironically, one of the closest today is probably the market for shares. However, as we mentioned before, it is still an important model as it provides a benchmark against which other markets can be judged. It can help in formulating appropriate policies to improve uncompetitive markets.
Efficient allocation of resources
Economists are concerned about the efficiency of markets, and ensuring that resources are allocated efficiently.
Perfect competition is considered to be efficient because:
- Supernormal profits are not made by any firm in perfect competition in the long-run.
- MC = price, so both parties, suppliers and customers, get exactly what they want.
- No wasteful advertising.
- Firms are allocatively and productively efficient.
The major assumption behind this analysis and evaluation is that firms cannot produce products cheaper if they were bigger. It assumes that there are no economies of scale available in the market.

Allocative efficiency
Allocative efficiency occurs when the value consumers put on the good or service equals the cost of producing the product or service. In other words, when price = marginal cost.

Productive efficiency
Productive efficiency occurs when output is achieved at the minimum average cost.
We can see from Figure 1 below that when it is in long-run equilibrium, perfect competition achieves allocative and productive efficiency as MC = MR = AC = AR. This means that they are maximising profits (MC = MR) but only making normal profit (AC = AR).
Figure 1 Long-run equilibrium - perfect competition
So, perfect competition looks good, but is it always so? Problems with perfect competition are:
- There are no reasons to do anything better, or research new products. As soon as you do, everybody else would step in and copy. Wait and let somebody else do it.
- Consumer has no choice. There is just one unbranded product on the market.
- Some economies of scale always exist.
- Perfect competition is not competitive in the fullest sense of the word!
- Barriers to entry will always exist. Even street traders will usually be required to apply for and, usually, buy a trading licence.
Look at economies of scale. Some are always likely to exist. Financial economies apply - the better your reputation the cheaper the loans, bulk-buying economies are there as well. Economies of scale are there, like gravity. It is up to the firm to take advantage of them. Competition encourages their application and exploitation.
Perfect competition may well operate efficiently, as far as economists are concerned. The consumer, however, may get an ordinary product or service at a high price. Is it worth it?

1 |
Productive efficiencyAt what point will the firm be productively efficient? |
2 |
Allocative efficiencyAt what point will the firm be allocatively efficient? |
Monopoly and oligopoly
By the end of this section you should be able to:

- Describe, using examples, the assumed characteristics of a monopoly: a single or dominant firm in the market; no close substitutes; significant barriers to entry.
- Describe, using examples, barriers to entry, including economies of scale, branding and legal barriers.
- Describe, using examples, barriers to entry, including economies of scale, branding and legal barriers.
- Explain, using a diagram, the short- and long-run equilibrium output and pricing decision of a profit maximizing (loss minimizing) monopolist, identifying the firm's economic profit (or losses).
- Explain the role of barriers to entry in permitting the firm to earn economic profit.
- Explain, using a diagram, the output and pricing decision of a revenue maximizing monopoly firm.
- Compare and contrast, using a diagram, the equilibrium positions of a profit maximizing monopoly firm and a revenue maximizing monopoly firm.
- Calculate from a set of data and/or diagrams the revenue maximizing level of output.
- With reference to economies of scale, and using examples, explain the meaning of the term "natural monopoly".
- Draw a diagram illustrating a natural monopoly.
- Explain, using diagrams, why the profit maximizing choices of a monopoly firm lead to allocative inefficiency (welfare loss) and productive inefficiency.
- Explain why, despite inefficiencies, a monopoly may be considered desirable for a variety of reasons, including the ability to finance research and development (R&D) from economic profits, the need to innovate to maintain economic profit, and the possibility of economies of scale.
- Evaluate the role of legislation and regulation in reducing monopoly power.
- Draw diagrams and use them to compare and contrast a monopoly market with a perfectly competitive market, with reference to factors including efficiency, price and output, research and development R&D) and economies of scale.
Monopoly and oligopoly - introduction
Concentrated markets, ones where there are only a limited number of suppliers, behave differently to competitive markets. You are required to know about monopoly and oligopoly.

Monopoly
One or occasionally a few firms dominate the market. The others have to accept the market as established by the others. A perfect monopoly is when there is a single supplier. However, a firm gets monopoly powers as its market share edges above 25% (UK legal definition). Some industries are natural monopolies, such as water supply and basic power generation.

Oligopoly
Oligopoly is when a few suppliers who provide the same product dominate a market. Petrol companies and the soap and detergent industry are good examples. Each firm has to be concerned about what the others in the industry will do.
Governments are concerned about both of these types of competition. Economic theory suggests that as markets become more concentrated (the number of firms in the industry falls) they become controlled by the suppliers at the expense of the consumer. As we shall see, this is not always the case. Governments try to regulate (control) these industries.
As was seen earlier, the very size of the firms makes it difficult for others to enter the industry (the size of the firms acts as a barrier to entry). Sunk costs are high so potential losses are high. There is no great encouragement to enter the market however good a product the firm has.
Why do some markets become concentrated and others do not?
The simple answer is growth and economies of scale. Some firms are more efficient than others, and in some industries there are much greater economies of scale than others. This has led to the formation of a number of highly concentrated industries. Examples are the oil and petrochemical industry, the aircraft manufacturing industry, airlines, soft drinks and banking to name just a few. Follow the links below to see how each industry fits the characteristics of monopoly and oligopoly.
Oil and petrochemicals
Aircraft manufacture
Airlines
Soft drinks
Banking
All the above are examples of oligopoly. Examples of monopoly are few and far between. Many natural monopolies, often state owned, have been broken up (privatised) and artificial competition (usually with regulators to control the market) introduced. Examples are electrical power, gas and the telephone service.

More examples - web links
It is worth being aware of recent examples of monopoly and oligopoly and government policy towards them. You should also investigate monopoly and oligopoly situations in the country of your study. This can easily be done by doing an internet search using a search engine such as google. Most national newspapers across the world are also available on-line and have a key word search facility enabling you to explore with relative ease!
In the UK, the best bet is probably to do a search in the Biz/ed In the News archive. You can do this in the window below:
Try searching on terms like:
- Monopoly
- Oligopoly
- Competition
In many countries the definition of a monopoly may be broader than the view we take as economic theorists where we state that the firm is the industry! In the UK, for example, any firm that has 25+% share of the market would be subject to investigation as a monopoly.
N.B. When you are searching on more than one word, it is best to check the 'match exact phrase' box.
Growth and power
Why do firms want to grow?
As they get larger they get stronger. They start to eliminate competition, and start to gain control of the market. They move from being a 'price taker' in a situation of perfect competition towards being a 'price setter' (or price maker) in a monopoly situation.

Price taker
A price taker is a firm which cannot influence the price of the product on the market. If it puts its price above the one ruling in the market it sells little or none. Firms in perfect competition are price takers.

Price setter
A price setter (or price maker) is a firm that can determine or fix the price of the product on the market. It sets the price, but the quantity sold is determined by the demand curve.
Firms start to develop monopoly power as they grow and increase their market share.

Monopoly power
The power, or ability to influence a market, influence the survival of others, and establish the price. It enables it to increase profits.
If you would prefer to view this interaction in a new web window, then please follow the link below:
The model of monopoly
 Monopoly, as a market form, is at the opposite end of the spectrum to perfect competition. In the literal sense, a monopoly exists when one single firm or a small group of firms acting together controls the entire market supply of a good or service for which there are no close substitutes. This is a situation of pure monopoly, which like the case of perfect competition, is rarely easy to identify in reality. Moreover, whether an industry can be classed as a monopoly will depend on how narrowly the industry is defined; for example, a city underground system (metro/subway) often has a monopoly on the supply of underground travel within the city, but does not have a monopoly on all forms of public transport within the city: people can also travel by bus, tram or overground trains.
Thus, in practice, less stringent definitions than 'single producer' tend to be used and economists focus instead on the degree of monopoly power which exists rather than absolute monopoly power. A firm, in the UK, may be regarded as being a monopolist if it controls 25 per cent or more of the total market supply of a particular good or service.
A market concentration ratio is used to measure the degree of concentration within a particular industry or group of industries. A commonly used ratio is the five firm concentration ratio that indicates the proportion of the industry's output produced by the five largest firms.
Theory of monopoly
The monopolist's demand curve
In our analysis of perfect competition, we showed how there is a distinction between the demand curve of the individual firm and that of the market as a whole - the existence of many firms each competing against each other means that each one has no influence over price, and has to take the price that is determined in the market through the intersection of the demand and supply curves. The demand curve for each firm is therefore horizontal: an infinite amount is demanded at one price, with nothing at all being demanded at a higher price and with the charging of a lower price being inconsistent with the goal of profit maximisation.
However, under monopoly there is only one firm in the industry; thus there is no difference between the demand curve for the industryand the demand curve for the firm. As the monopolist is subject to the normal law of demand, the monopolist's demand curve will be downward sloping so that to sell more, price would have to be lowered (see figure 1). In comparison to other types of market, the monopolist's demand curve is likely to be relatively inelastic as close substitutes may not be available if price is raised. Indeed, the availability or non-availability of close substitutes is one of the key factors determining the monopolist's power in the market.
Figure 1 Monopolist's demand curve
The demand curve shown in Figure 1 presents the monopolist with a choice. The monopolist can either choose to make the price or the quantity, but cannot do both; for example, if the monopolist chooses to set a price of OP1, the market dictates that only a quantity of OQ1 could be sold; however, if the monopolist chooses to set a quantity of OQ2 to be sold, clearly the demand curve tells us that this could only be achieved at a price of OP2.
Marginal revenue and average revenue under monopoly

The table below assumes that the monopolist faces a normal demand schedule, and from this the revenue curves are derived. Try calculating the figures for total, average and marginal revenue and once you have had a go, follow the link to check your answers.
| Output | Price | Total revenue | Marginal revenue | Average revenue |
|---|---|---|---|---|
| 1 | 20 | |||
| 2 | 18 | |||
| 3 | 16 | |||
| 4 | 14 |
Total, average and marginal revenue answers
From the table two points can be seen:
a) As price has to be lowered to increase sales, marginal revenue is not equal to price as in perfect competition: the additional revenue gained from each extra sale is always less than price or average revenue, and thus the MR curve will always be below the AR curve in monopoly.
b) As price is identical to average revenue, the demand curve is also the curve relating average revenue to the quantity produced.
The information in this table can now be shown in diagrammatic form to show the relationship between the average and marginal revenue curves (figure 2).
Figure 2 Marginal and average revenue curves
Monopoly - profit maximisation
If you would prefer to view this interaction in a new web window, then please follow the link below:
Monopoly equilibrium
If you would prefer to view this interaction in a new web window, then please follow the link below:
Monopoly v. perfect competition
If you would prefer to view this interaction in a new web window, then please follow the link below:
Consumer and producer sovereignty
Because of the conditions of perfect competition - many buyers and sellers, perfect knowledge and freedom of entry - firms would be forced to produce those goods and services which consumers most wanted. Any firm or even group of firms not behaving in this way would be unable to survive for very long as the competitive pressures from those firms who were responding to consumers' wishes would soon drive them into extinction. From this point of view it could be argued that consumers are sovereign in as much that it is they who 'call all the shots'. However, as described previously, monopoly producers may well decide on which types of goods they are going to supply and at what prices, and then set about manipulating and moulding consumers' tastes, via their marketing activities, to match their pre-determined output plans - a situation in which the producer and not the consumer is sovereign.

1 |
Output levels - Monopoly
At which output level in the diagram below will the monopolist produce to ensure productive efficiency?
|
2 |
Output levels - Monopoly
At which output level in the diagram below will the firm produce to ensure allocative efficiency?
|

3 |
Monopolist - productive and allocative efficiencyA monopolist will be productively and allocatively efficient in long run equilibrium. |
4 |
Perfect competition - productive and allocative efficiencyA firm in perfect competition will be both productively and allocatively efficient in long-run equilibrium. |
Economic efficiency in perfect competition
If you would prefer to view this interaction in a new web window, then please follow the link below:
Economic efficiency in perfect competition and monopoly
If you would prefer to view this interaction in a new web window, then please follow the link below:
So can you now summarise the advantages and disadvantages of monopoly? Have a think about them, jot them down and then follow the link to compare your notes with ours.
Efficiency and market structure
We are concerned here with concentrated (monopoly and oligopoly) and competitive markets.
Competitive markets are considered to be statically efficient - both allocatively and productively. Dynamic efficiency is another matter. Because firms are all small, no one firm can afford research and development (R&D); it would have to be done on a collective or industrial basis. This has been done, but a number of problems arise over funding levies and charges.
Concentrated markets, on the other hand, are considered to be inefficient in the short-run. They are statically inefficient, even though their AC may be significantly lower than their smaller 'perfectly competitive' equivalent. The profit motive makes them strive to be more efficient, so they may invest in R&D and may be dynamically efficient

1 |
Monopoly vs perfect competition
In the diagram below, which area represents the level of consumer surplus under perfect competition?
|

2 |
Monopoly vs perfect competition
In the diagram below, which area represents the level of consumer surplus under monopoly?
|

3 |
Monopoly vs perfect competition
In the diagram below, which area represents the welfare loss if a monopolist takes over a perfectly competitive industry?
|
Monopolistic competition
By the end of this section you should be able to:

- Describe, using examples, the assumed characteristics of a monopolistic competition: a large number of firms; differentiated products; absence of barriers to entry and exit.
- Explain that product differentiation leads to a small degree of monopoly power and therefore to a negatively sloping demand curve for the product.
- Explain, using a diagram, the short-run equilibrium output and pricing decisions of a profit maximizing (loss minimizing) firm in monopolistic competition, identifying the firm's economic profit (or loss).
- Explain, using diagrams, why in the long run a firm in monopolistic competition will make normal profit.
- Distinguish between price competition and non-price competition.
- Describe examples of non-price competition, including advertising, packaging, product development and quality of service.
- Explain, using a diagram, why neither allocative efficiency nor productive efficiency are achieved by monopolistically competitive firms.
- Compare and contrast, using diagrams, monopolistic competition with perfect competition, and monopolistic competition with monopoly, with reference to factors including short run, long run, market power, allocative and productive efficiency, number of producers, economies of scale, ease of entry and exit, size of firms and product differentiation.
Monopolistic competition - notes
If you would prefer to view this interaction in a new web window, then please follow the link below:
Monopolistic competition in the short-run
If you would prefer to view this interaction in a new web window, then please follow the link below:
Monopolistic competition in the long run
If you would prefer to view this interaction in a new web window, then please follow the link below:
Oligopoly
By the end of this section you should be able to:

- Describe, using examples, the assumed characteristics of an oligopoly: the dominance of the industry by a small number of firms; the importance of interdependence; differentiated or homogeneous products; high barriers to entry.
- Explain why interdependence is responsible for the dilemma faced by oligopolistic firms - whether to compete or to collude.
- Explain how a concentration ratio may be used to identify an oligopoly.
- Explain how game theory (the simple prisoner's dilemma) can illustrate strategic interdependence and the options available to oligopolies.
- Explain the term "collusion", give examples, and state that it is usually (in most countries) illegal.
- Explain the term "cartel".
- Explain that the primary goal of a cartel is to limit competition between member firms and to maximize joint profits as if the firms were collectively a monopoly.
- Explain the incentive of cartel members to cheat.
- Analyse the conditions that make cartel structures difficult to maintain.
- Describe the term "tacit collusion", including reference to price leadership by a dominant firm.
- Explain that the behaviour of firms in a non-collusive oligopoly is strategic in order to take account of possible actions by rivals.
- Explain, using a diagram, the existence of price rigidities, with reference to the kinked demand curve.
- Explain why non-price competition is common in oligopolistic markets, with reference to the risk of price wars.
- Describe, using examples, types of non-price competition.
- Describe price discrimination as the practice of charging different prices to different consumer groups for the same product, where the price difference is not justified by differences in cost.
- Explain that price discrimination may only take place if all of the following conditions exist: the firm must possess some degree of market power; there must be groups of consumers with differing price elasticities of demand for the product; the firm must be able to separate groups to ensure that no resale of the product occurs.
- Draw a diagram to illustrate how a firm maximizes profit in third degree price discrimination, explaining why the higher price is set in the market with the relatively more inelastic demand.
Oligopoly - notes
The nature of oligopoly / assumptions of the model

Oligopoly is a market form in which there are only a few firms in the industry with many buyers; so market supply will be concentrated in the hands of relatively few producers, although an industry might still be said to be oligopolistic where several smaller firms existed alongside the few large firms that dominate; the wholesale petrol market provides a suitable example of the latter. The markets for cigarettes, ice cream, confectionery (candy), fizzy drinks (soda), high street banks, airline carriers, domestic appliances, soap powders and supermarket chains all provide good examples of oligopoly in many countries across the world.
Where the few firms produce an identical product, this is known as perfect oligopoly, and where, more commonly, the products are differentiated, this is referred to as imperfect oligopoly. The case of duopoly, where there are only two firms in the industry, is a special case of oligopoly.
However, the absolute number of firms in the market is less significant than the way in which they behave and the relationship between the firms that comprise the industry. In the case of the monopolist, for example, independent price and output decisions can be made, with the only consideration being the customer's reaction to the change in price. However, in oligopoly, where there is competition amongst the relatively few, each firm has to also try to assess the reaction of its rivals to a change in price, as each firm will occupy a sufficiently important position within the industry for its particular price and output decisions to have a significant impact on its competitors. If a firm in oligopoly is thinking of raising the price of its product, it has to assess whether its rivals will do likewise or keep price down in order to gain more custom. Oligopoly is characterised by interdependence between the firms that comprise the industry, and by reactive market behaviour.
Oligopoly has emerged as the most prevalent market form in the industrialised world. This can partly be explained by the existence of economies of scale, especially in manufacturing, encouraging the growth of large scale production; inevitably, as firms grow in size, the number of firms supplying the market falls, and hence the tendency towards oligopoly power. Moreover, once established, this power may be sustained by various barriers to entry, similar to those that exist under monopoly.
The importance of non-price competition
As we shall see from our discussion of oligopoly, an important feature of oligopolistic markets, i.e. ones dominated by a few large firms, is the tendency towards relative price stability. Lack of price movement will occur most obviously where firms collude with each other to collectively fix their prices, but it may also occur in a situation of what is known as non-collusive oligopoly, where no such price agreements exist; inderdependent firms may well come to the conclusion that there is no point in 'cutting each others throats' by engaging in price warfare in the longer term as this could be disastrous for all the combatants, although there may be a tendency towards occasional short bursts of price cutting. However, this absence of price competition does not necessarily mean an absence of competition: oligopolistic firms are likely to compete in a variety of non-price forms.
Non- price competition occurs where firms attempt to win a competitive advantage over their rivals by strategies other than reducing prices. Non-price competition inevitably involves product differentiation. Here, oligopolistic competitors try to create separate markets in which they can command consumer loyalty through the creation of actual or imagined differences in the goods or services they offer, which are essentially the same as their rivals. This is in contrast to perfect competition where the good on offer, perhaps an agricultural one, is homogeneous, and product differentiation is difficult e.g. one carrot is pretty much the same as another.
Product differentiation is extremely widespread amongst the whole variety of consumer goods and services that we buy e.g. washing machines, television sets, home computers, motor cars, washing powders, soft drinks, packaged holidays and financial services. These are all differentiated one from another in a variety of ways, including shape, size, quality and image.
Non-price competition may take a variety of forms, including:
- Advertising
- Branding
- Product innovation
- Packaging
- The provision of after sales services e.g. product guarantees
- Free samples and gift offers.
Advertising and branding
 The creation of consumer loyalty to particular brands is mainly achieved through advertising, and it is in oligopolistic markets where branding, backed by extensive product promotion, is most prevalent. The markets for soap-powders, cereals, cars, confectionery and cosmetics provide a few notable examples.
The main aim of branding is to make particular goods, produced by particular firms, appear as if they have unique features which the products of competing firms do not possess. On occasions these features may be real, e.g. the distinctive quality of a BMW car or an Apple i-Pod. However, often the 'uniqueness' may only exist in consumers' minds, but a difference, real or imagined, in how consumers perceive branded products, may be sufficient to allow goods to be sold at very different prices e.g. well-known brands of soft drinks, sports-wear, bars of soap and shaving creams are all sold at higher prices than their 'own brand', or lesser-known, equivalents.
Thus, if successful, branding will reduce the degree of substitutability for the good, make its demand more inelastic, allow for higher prices and profits to be earned and enable the brand to become unassailable.
Moreover, the practice of multiple branding serves as a very effective barrier to entry of new firms e.g. go to any supermarket in the UK and you will see several brands of soap powders on the shelves, but these are mainly produced by just two firms, Unilever and Procter and Gamble - the costs of breaking into such a market would be formidable as any new entrant would have to compete against numerous brands of soap powder, requiring an enormous outlay on advertising; obviously if Unilever and Procter and Gamble only produced one brand each, the task of contesting the market would be made considerably easier.
Product innovation
 Non-price competition in oligopoly may also take the form of product innovation whereby rival firms attempt to gain a larger slice of the market by constantly seeking to improve the quality and/or style of their existing products, or by developing entirely new products. This innovation usually has to be backed by extensive research and development (R&D), and has the effect of causing rapid obsolescence of consumer durable goods, a renewable source of demand and certain decline for those firms unwilling or unable to engage in such innovation. Most car manufacturers, for example, are constantly in the process of changing the design and other features of particular models so as to generate new demand, and the few large firms that dominate the pharmaceuticals industry are locked into a perpetual struggle to develop new and better drugs. An interesting market to study in this respect is that of mobile phones, I-pods and I-phones!
Theories of oligopoly - non-collusive
 The various models of oligopoly can be classified under two main headings: non-collusive or competitive oligopoly and collusive oligopoly. We shall consider each in turn:
Non-collusive or competitive oligopoly
In this case, each firm will embark upon a particular strategy without colluding with its rivals, although there will of course still exist a state of interdependence, as possible reactions of rivals will have to be considered.
There are three broad approaches that might be adopted by firms in a situation of competitive oligopoly:
- Observe the behaviour of rival firms but make no attempt to predict their possible strategies on the basis that they will not develop counter strategies. This was the essence of the earliest model of oligopoly developed by Cournot as far back as 1838: each firm acts independently on the assumption that its decision will not provoke any response from rivals; this is not generally accepted nowadays as providing a useful framework in which to analyse contemporary oligopoly behaviour.
- Make the assumption that a given strategy will provoke a response from competitor firms, and assess the nature of the response using past experience. This is the basis of the kinked demand curve model, described below, in which it is assumed that any price cut by one oligopolist will induce all others to do likewise, whilst a similar price increase would not be matched.
- Formulate a strategy and try to anticipate how rivals are most likely to react, and be prepared with suitable counter measures.
This is the basis of game theory in which competition under oligopoly is seen as being similar to a game of chess in which every potential move must be regarded as a strategy, and possible reactive moves by opponents and subsequent counter-moves must all be carefully considered. The application of the theory of games to economics was first introduced in 1944 by J. von Neuman and O. Morgenstern. Game theory involves the study of optimal strategies to maximise payoffs, taking into account the risks involved in estimating reactions of opponents, and also the conditions under which there is a unique solution, such that an optimum strategy for two opponents is feasible and not inconsistent. A zero-sum game is one in which one player's gain is another's loss, and a non-zero-sum game is one in which a decision adopted by one player may be to the benefit of all. Look up 'The Prisoner's Dilemma'!

For some further resources on the Prisoner's dilemma, why not have a look at:
- Serendip - a prisoner's dilemma game/simulation
- Prisoner's dilemma - an online simulation
- Prisoner's dilemma - Wikipedia
The kinked demand curve theory
In the discussion of non-collusive oligopoly, we shall focus our attention on the second of the three broad approaches identified on the previous page.
If you would prefer to view this interaction in a new web window, then please follow the link below:
Kinked demand curve - change in cost
In the discussion of non-collusive oligopoly, we shall focus our attention on the second of the three broad approaches identified on the previous page.
If you would prefer to view this interaction in a new web window, then please follow the link below:
Criticisms of the kinked demand curve theory
- The theory assumes that oligoplists perceive a kink at the current market price i.e. at point X, but it does not explain how or why the original price was chosen. As a theory, it is therefore incomplete as it does not deal with price determination.
- Price stickiness or rigidity in oligopolistic markets might, in practice, be more apparent than real; for example, in the market for new cars, published catalogue prices may remain constant over relatively long periods, but the common practices of offering discounts, and items such as free insurance, cash- back deals and interest -free credit all amount to ways of reducing price. In fact, the theory takes no account of the various forms of non-price competition which characterise most oligopolistic markets.
- There is little empirical evidence from firms operating in oligopolistic markets to substantiate the kinked demand curve hypothesis that a change in price by one firm will always evoke a predictable and uniform response from its rivals. In practice, a very wide range of possible reactions is probable.
- Any perceived stability in prices in oligopolistic markets may not be due to the existence of a kinked demand curve, but may occur for other reasons such as the administrative expense and inconvenience of altering prices too regularly.
Cut-price competition (predatory pricing)
 Although oligopolistic markets tend to be characterised by relative price stability in the longer term, occasionally short bursts of price warfare break out. This typically occurs when the dominant players attempt to defend and/or raise their market shares because the total level of demand in the market is insufficient to enable all to achieve their intended level of sales, and overcapacity results. Price cutting has the effect of reducing the profits of all the combatants in the short run, with consumers gaining the temporary benefit of lower prices.
However, the likely outcome is that the weakest firms, i.e. those with the highest costs, will be driven into bankruptcy, with a new era of relative price stability eventually emerging. If too many casualties are caused, consumers are likely to face greater monopoly power and possibly higher prices. Price wars have been experienced between supermarket chains in many countries. In the UK such wars have also featured in petrol station forecourts.
Theories of oligopoly - collusive
We saw in competitive oligopoly that firms can never be entirely sure as to how their competitors will react to any given marketing strategy. To overcome this uncertainty, firms may adopt a policy of reducing, or even eliminating, it by some form of central co-ordination, co-operation or collusion. Such collusion may occur where firms attempt to maximise their joint profits, by reaching agreement on their price, output and other policies, or where firms seek to prevent the entry of new firms into the industry so as to protect their longer run profits.
Forms of collusion
Formal collusion
The most common type of formal collusion is through the cartel; where a small number of rival firms, selling a similar product, come to the conclusion that it is in their joint interests to formally collude rather than compete, they may establish a cartel arrangement in which they agree to set an industry price and output which enables them to achieve a common objective. This is likely to involve the setting of agreed output quotas for each member in order to maintain the agreed price.
A successful cartel arrangement, from the point of view of the participating firms, would be one in which the cartel acts like a single monopolist to maximise profits of individual members. This is illustrated in figure 1 below.
Figure 1 Profit maximisation for the cartel
This is the familiar monopoly diagram, with each curve representing the aggregated situation for all the firms in the cartel. In order to maximise profits, MC is equated with MR and a price of OP is set, with an output of OQ, which represents the potential level of sales. The allocation of this market quota between members could be decided by such criteria as geography, productive capacity or pre-cartel market share, or cartel members, having set a price of OP, could engage in non-price competition to each gain as large a slice of OQ as they can.
In practice, cartels may tend to be rather fragile and may not last for very long. This is because individual members may have an incentive to renege on the agreement by secretly undercutting the cartel price. The almost inevitable necessity to limit output to keep price high will tend to leave individual firms with spare productive capacity, and provide the temptation to increase profits by expanding output. Such an expansion would not only generate profit on the additional sales, but would also increase the profits on existing sales, as average fixed costs would fall as output expanded.
As the end result of successful collusion will be to create a situation similar to monopoly, with its consequent drawbacks and loss of economic efficiency, cartels are illegal in many countries, including the UK and the USA. Various cartels do, however, operate internationally, the most famous of which is OPEC, referred to earlier in your studies. Another example of an international cartel is IATA (The International Air Transport Association) which has sought to set prices for international airline routes. However, the experience of both these cartels has been one of price cutting amongst its members, particularly during periods of declining product demand and competition from non-members.
Informal or tacit collusion
The most usual method of tacit collusion is priceleadership. This occurs where one firm sets a price that is subsequently accepted as the market price by the other producers. There need be no formal or written agreement for this to happen; it is sufficient that firms believe this to be the best way of maintaining or increasing their profits. An example of price leadership is provided by the Ford Motor Company who has often been the first to raise prices in the car industry.

Activity
Choose a particular market to study, e.g. the market for soap powders, chocolate bars, computers, ice cream or any other of your choice.
Investigate the degree and nature of competition in your chosen market and the implications of this for producers and consumers.
Price discrimination
If you would prefer to view this interaction in a new web window, then please follow the link below:
Equilibrium of the discriminating monopolist
Figure 1 Equilibrium of the discriminating monopolist
The profit gain from price discrimination is (x + y) - z
In figure 1 there are two distinct markets, Market A and Market B. A third market, Market C, which is the combined market, is obtained by the horizontal summation of the individual AR and MR curves from A and B. Market A has an inelastic demand curve, whilst Market B has a more elastic demand curve. The gradient of the combined market demand curve will lie between that of A and B.
In the combined market, MC is equated with MR to give a single profit maximising price of OPc with an output of OQc, and a total profit equal to the shaded area z is earned. With a single price, this is the maximum profit that could be earned as the charging of a higher price would reduce demand and the area of profit, z.
However, total profits can be increased through price discrimination, with the total output OQc being sold at different prices in markets A and B. Price will always be higher in the market with a more inelastic demand as consumers will be less responsive to price changes.
As price discrimination only occurs where the differences in price are not associated with any cost differences, the combined market MC curve will also apply to markets A and B, and the output of each sub-market is therefore determined by equating MR in each market with the marginal cost of producing OQc units of output. Thus in figure 1, it can be seen that the marginal cost of production, OM, is projected back from the combined market as a horizontal line to enable the monopolist to find the equilibrium points Ea and Eb where MC = MR in each of the individual markets, A and B. Similarly the average cost of production, OC, is projected back from the combined market to determine the area of profit in markets A and B. As the level of profit is denoted by the amount by which AR exceeds AC, the areas x and y will represent the total profit for A and B respectively.
From the producer's standpoint, price discrimination will be a success if total profits increase as a result. In the diagram, it can be seen that Area x + Area y is greater than Area z, so the producer has succeeded.
Section 1.5 Theory of the firm - questions

In this section are a series of questions on the topic - theory of the firm. The questions may include various types of questions. For example:
- Self-test questions - on-screen questions that give immediate marking and feedback
- Short-answer questions - a series of short-answer questions to help you check your understanding of the topic
- Numerical - calculation questions
- In the news - questions based around a topical economics news article
Click on the right arrow at the top or bottom of the page to work through the questions.
Short-run - numerical

Question 1
A firm uses two variable factors of production in the manufacture of its product, labour and capital. It combines these with a fixed factor, land, to produce different quantities of output.
a) Is this firm operating in the short or long run?
The following data is available
| Units of labour | 1 | 2 | 3 | 4 | 5 | 6 | 7 |
|---|---|---|---|---|---|---|---|
| Output | 10 | 25 | 30 | 25 | 20 | 15 | 10 |
b) When does the law of diminishing returns click in?
Question 2
A firm is planning to expand production by 300 units per hour. To do this it will have to either employ more labour, or bring in more special equipment. It has the following data available. Using this data only, advise the firm what it should do.
Cost of labour - £30 per hour
Productivity - 60 units per hour
Cost of equipment (hire charge) - £100 per hour
Productivity - 350 units per hour.
Question 3
You have asked the question, and the firm has supplied you with the following information:
| Number of extra workers | 1 | 2 | 3 | 4 | 5 | 6 | 7 |
|---|---|---|---|---|---|---|---|
| Expected total output | 60 | 150 | 300 | 420 | 500 | 480 | 420 |
If more than 5 workers are employed, cost per worker will have to rise to £35 per worker. How does this information influence your case?
Question 4
The following information has been provided by the firm.
Anticipated cumulative increase in production requirements for next 6 periods
| Period | 1 | 2 | 3 | 4 | 5 | 6 |
|---|---|---|---|---|---|---|
| Extra sales expected | 300 | 400 | 550 | 700 | 1000 | 2000 |
How does this affect your advice?
Short-run - short-answer

Question 1
What is productivity and how is it affected by changes in the prices of factors of production?
Question 2
Explain the law of diminishing returns.
Question 3
All other things being equal, how would a firm decide what factors of production to use in its factory?
Question 4
Explain the term 'short-run'.
Question 5
Distinguish between diseconomies of scale and the law of diminishing returns.
Long-run - short answer

Question 1
Explain why all the firms in an industry within a single economy are not all the same size.
Question 2
Explain why firms are bigger in some industries than others.
Question 3
Explain how full exploitation of the benefits of economies of scale and the division of labour can result in a firm having to become international/multinational.
Question 4
An industry has 12 firms that operate within it. The market shares of the top 6 firms in 2002 are given below.
| Firm | A | B | C | D | E | F |
|---|---|---|---|---|---|---|
| Market share (%) | 24 | 21 | 16 | 12 | 8 | 6 |
Calculate the 3, 5 and 6 firm concentration ratios (the percentage market share accounted for by the top 3, top 5 and top 6 firms) for this industry.
Question 5
An industry has 24 firms that operate within it. The sales value of the top 6 firms in 2002 is given below.
| Firm | A | B | C | D | E | F |
|---|---|---|---|---|---|---|
| Sales value ($m per year) | 12.5 | 2.5 | 2.3 | 1.7 | 0.9 | 0.8 |
The industry is worth $24 million per year
Calculate the 3, 5 and 6 firm concentration ratios for this industry.
Question 6
Explain three economies and three diseconomies of scale that may affect a firm.
Question 7
Explain the term 'capital intensive' firm.
Question 8
Why do capital-intensive firms tend to be large in relation to the size of the market they are in?
Question 9
Explain the term 'minimum efficient scale of production'.
Cost theory - numerical

Question 1
Given the following table of costs:
| Output | 0 | 1 | 2 | 3 | 4 | 5 |
|---|---|---|---|---|---|---|
| Total cost | 50 | 80 | 100 | 150 | 250 | 750 |
Calculate the following:
(i) Fixed cost
(ii) Average cost of production
(iii) Variable cost per unit
(iv) Marginal cost
Plot all the cost curves on a single graph, and determine where diminishing returns sets in.
Question 2
A firm manufactures cars at its plant in Swindon. At a capacity of 100 cars per week it knows that it has an assembly cost of £5,000 per car. It needs to expand production and does a series of design and cost exercises. The results are summarised below.
| Output (cars per week) | 200 | 400 | 600 | 800 | 1,000 | 1,200 | 1,400 | 1,600 |
|---|---|---|---|---|---|---|---|---|
| Assembly cost (£ per car) | 3,000 | 2,500 | 2,300 | 2,200 | 2,000 | 2,400 | 2,800 | 4,000 |
(i) Plot the cost curve for the possible factory extensions.
(ii) Is this a short run or long run cost curve?
(iii) Explain why this curve is U shaped.
Cost theory - short-answer

Question 1
Why can fixed costs be considered as an entry fee?
Question 2
Distinguish between the very short-run, the short-run, the long run and the very long run.
Question 3
Explain the term marginal cost.
Question 4
How would you decide, looking at a firm's average cost curve, if it was capital or labour intensive?
Question 5
How and why do cost curves change with time?
Question 6
Explain how a firm's short run average total cost curve and marginal cost curve are related.
Question 7
Use diagrams to distinguish between the law of diminishing returns and economies of scale.
Interactive questions
The following table of data describes the operation of a firm over a limited output range, and is used for the next 5 questions.
| Output | 0 | 1 | 2 | 3 | 4 | 5 | 6 | 7 | 8 | 9 | 10 |
|---|---|---|---|---|---|---|---|---|---|---|---|
| Total cost | 100 | 120 | 140 | 160 | 220 | 300 | 450 | 600 | 1,000 | 2,500 | 5,000 |
1 |
Fixed costsThe fixed costs for the firm are: |
2 |
Average costThe average cost of production when 5 items were made is: |
3 |
Marginal costThe marginal cost of the 7th unit is: |
4 |
Diminishing returnsThe firm exhibits diminishing returns to the variable factor from the: |
5 |
Variable cost per unitThe variable cost per unit when 4 units are made is: |
Costs and cost curves - self-test questions

1 |
Cost calculationA firm produces 200 units and the total cost of production is $4000. When they increase output to 220, the cost rises to $4200. What is the marginal cost? |
2 |
Cost calculationA firm produces 200 units and the total cost of production is $4000. When they increase output to 220, the cost rises to $4200. What is the average cost of producing 220 units? |
3 |
Cost calculationA firm producing in the short run produces 200 units and the total cost of production is $4000. When they increase output to 220, the cost rises to $4200. When output rises to 240, the cost rises to $4100. The firm is experiencing: |
4 |
Cost calculationA firm produces 200 units and the total cost of production is $4000. When they increase output to 220, the cost rises to $4200. When the firm produces zero output, the cost is $1000. What is the fixed cost per unit when they produce 200 units? |
5 |
Cost calculationA firm produces 200 units and the total cost of production is $4000. When they increase output to 220, the cost rises to $4200. When the firm produces zero output, the cost is $1000. What is the variable cost per unit when they produce 200 units? |
6 |
Types of costsMatch the following cost definitions to their type. |
Revenues - numerical

Question 1
The following table of data represents a business in operation.
| Output/sales | 0 | 1 | 2 | 3 | 4 | 5 | 6 | 7 | 8 |
|---|---|---|---|---|---|---|---|---|---|
| Total revenue | 0 | 100 | 180 | 240 | 280 | 300 | 300 | 280 | 240 |
| Total costs | 20 | 60 | 110 | 170 | 240 | 320 | 410 | 510 | 620 |
Determine:
(i) Average revenue
(ii) Marginal revenue
(iii) Profit
(iv) Marginal cost
(v) Average cost
Plot all the data on one graph and determine the profit maximising output. Confirm that at this output, MC = MR.
Question 2
A firm is selling 5 units of its product, and has the following cost and revenue figures.
| Output/sales | 0 | 1 | 2 | 3 | 4 | 5 |
|---|---|---|---|---|---|---|
| Total revenue | 0 | 200 | 350 | 450 | 500 | 500 |
| Total costs | 50 | 100 | 140 | 200 | 250 | 310 |
(a) Determine:
(i) the firm's average revenue and price
(ii) the firm's profit level.
b) Is the firm operating below or above its profit maximising output?
c) Determine the new total revenue and profit at the new level of output and sales.
Question 3
The following table shows the sales and revenue data for a firm selling its product.
| Sales (units) | 0 | 1 | 2 | 3 | 4 | 5 | 6 | 7 | 8 |
|---|---|---|---|---|---|---|---|---|---|
| Price (£) | 200 | 180 | 160 | 140 | 120 | 100 | 80 | 60 | 40 |
Determine the firms TR, MR and AR over this range of output. Plot the firm's Revenue curves and show where the firm maximises its sales revenue.
Question 4
Distinguish between normal and supernormal profits.
Question 5
Who decides what level of profit is normal?
Question 6
Explain the difference between profit and money.
Question 7
What is a windfall profit?
Question 8
What is the difference between the average revenue of a product and its price?
Question 9
Why do businesses aim to make a profit?
Interactive questions
The following table of data represents a business in operation and is used for the following series of multiple-choice questions
| Output/sales | 0 | 1 | 2 | 3 | 4 | 5 | 6 | 7 | 8 |
|---|---|---|---|---|---|---|---|---|---|
| Total revenue | 0 | 50 | 90 | 120 | 140 | 150 | 150 | 140 | 120 |
| Total costs | 10 | 30 | 55 | 85 | 120 | 160 | 205 | 255 | 310 |
1 |
Average revenueWhat is the average revenue for the firm at an output of 6 units? |
2 |
Marginal revenueWhat is the marginal revenue obtained from selling the 4th unit? |
3 |
Profit maximising outputThe firms profit maximising output is: |
4 |
Marginal revenueWhat is the marginal revenue obtained from selling the 7th unit? |
5 |
Revenue maximisationThe firm will maximise its revenue if it sells: |
Profit maximisation - short answer

Question 1
Why is profit maximised when MC = MR?
Question 2
What is the basic assumption that economists make about the objectives of private firms?
Question 3
Explain two other objectives a private firm might have.
Question 4
Why is it assumed that private firms ignore external costs?
Question 5
Explain the term 'satisficing'.
Revenue and profit - self-test questions

1 |
Revenue definitionsMatch the following definitions to the appropriate type of revenue. |
2 |
Revenue calculationA firm is selling 100 units at a price of $25. However, to sell 110 units they need to cut the price to $24. What is the level of marginal revenue at this higher level of sales? |
3 |
Revenue calculationA firm is selling 100 units at a price of $25. However, to sell 110 units they need to cut the price to $24. What is the average revenue at 110 units? |
Perfect competition - numerical
Question 1
Examine the diagram that is given below, which represents a firm in a perfectly competitive market.
What price would the firm require to:
(i) stay in the market in the long run
(ii) stay in the market in the short run
(iii) leave the market at once
Question 2
It is known that a firm is operating in a perfectly competitive market. Its situation is summarised in the table of data that follows.
| Sales/production | 0 | 1 | 2 | 3 | 4 | 5 | 6 | 7 |
|---|---|---|---|---|---|---|---|---|
| Total revenue | 0 | 30 | 60 | 90 | 120 | 150 | 180 | 210 |
| Total cost | 10 | 40 | 60 | 70 | 80 | 100 | 130 | 160 |
What price would the firm require to:
(i) stay in the market in the long run?
(ii) stay in the market in the short run?
(iii) leave the market at once?
Is the firm in long or short run equilibrium?
Perfect competition - short answer

Question 1
Explain why a market for shares may be considered to approximate perfect competition.
Question 2
Is it possible for a firm in perfect competition to make supernormal profits?
Question 3
A firm in a perfectly competitive industry finds that it is trying to sell its product at a price above the prevailing market price. What can it do about the situation?
Question 4
What does the term 'freedom of entry and exit' to the market mean?
Question 5
Draw and explain the models for a firm and an industry in a perfectly competitive market in the long run.
Question 6
Will you find advertising in a perfectly competitive industry?
Question 7
It is an assumption of perfect competition that, in the long run, no firm makes supernormal profits, only normal profit. Does that mean that all firms in perfect competition make the same level of profit?
Question 8
Examine the data below, which is for 4 different firms.
Revenue data (£k) for four firms
| Sales | 0 | 1 | 2 | 3 | 4 | 5 |
|---|---|---|---|---|---|---|
| A | 0 | 10 | 20 | 30 | 40 | 50 |
| B | 0 | 30 | 60 | 90 | 120 | 150 |
| C | 0 | 50 | 95 | 135 | 170 | 155 |
| D | 0 | 40 | 80 | 120 | 160 | 200 |
All of the firms are in perfectly competitive industries except?
Question 9
Discuss the main problems with perfect competition.
Question 10
Why is the existence of perfect competition unlikely in the real world?
Perfect competition - self-test questions

1 |
Assumptions of perfect competitionWhich of the following are assumptions we make about perfect competition? (Select all responses that are correct) |
2 |
Long-run equilibrium - perfect competitionWhich of the following will be true when a firm is in long-run equilibrium in perfect competition? (Select all responses that are correct) |
3 |
Long-run equilibrium - perfect competitionWhich of the following will be true when a firm is in short-run equilibrium in perfect competition? |
4 |
Monopoly and oligopoly - short answer

Monopoly and oligopoly - introduction
Question 1
Explain the difference between a monopoly industry and an oligopoly.
Question 2
Examine the factors that might give a firm a degree of monopoly power in a market consisting of several suppliers.
Question 3
What are barriers to entry? Why do monopoly suppliers spend so much time in establishing and maintaining them?
Question 4
Evaluate the following proposition:
'All monopolies are bad for the consumer and the economy, therefore they should be strictly controlled'.
Question 5
A car is a car! How do car companies compete effectively?
Question 6
Why do some industries, like the manufacture of aircraft engines, become highly concentrated, but the market for meals (restaurants) remains highly fragmented?
Question 7
Explain the differences between internal and external growth.
Question 8
Why do firms try to expand and grow?
Question 9
Explain the differences between a price taker and a price setter (maker).
Question 10
What factors affect the ability of a firm to expand?
Question 11
From where does a firm derive monopoly power?
Question 12
Many firms exist in the business world that operate in two sectors of the market, but very few operate in all three (primary, secondary and tertiary). Suggest why this is so.
Question 13
Describe the various ways in which firms compete to increase their market share
Question 14
Is such competition (see question 13) always in the interest of the consumers?
Monopoly - short answer

The model of monopoly
Question 1
Explain the meaning of the phrase 'the monopolist is constrained by the demand curve for the product'.
Question 2
Discuss the statement 'monopoly is always bad'.
Question 3
Discuss the statement 'monopoly is always inefficient'.
Question 4
Explain why, if a monopolist takes over a perfectly competitive industry and takes advantage of no economies of scale, then the monopolist will reduce the quantity available for sale and at the same time raise the price.
Question 5
Look at the data below, which gives the total revenue schedules for firms. Which company, A, B, C or D, is a monopolist?
| Sales | 1 | 2 | 3 | 4 | 5 |
|---|---|---|---|---|---|
| Firm A | 10 | 20 | 30 | 40 | 50 |
| Firm B | 100 | 190 | 270 | 340 | 400 |
| Firm C | 200 | 400 | 600 | 800 | 1000 |
| Firm D | 100 | 200 | 300 | 400 | 500 |
Question 6
Look at the data below, which gives the market shares for 4 different firms. Which company, A, B, C or D, is unlikely to have any monopoly power?
| Company | A | B | C | D |
|---|---|---|---|---|
| Market share | 65% | 45% | 25% | 12% |
The model of monopoly - self-test questions

1 |
2 |
MonopolyWhich of the following are true in monopoly? (Select all responses that are correct) |
3 |
Output levels - Monopoly
At which output level in the diagram below will the monopolist produce to maximise profits?
|

4 |
Output levels - Monopoly
At which output level in the diagram below will the monopolist produce to maximise revenue?
|

Economic efficiency - short answer

Economic efficiency in perfect competition and monopoly
Question 1
Explain the differences between allocative and productive efficiency.
Question 2
Why does perfect competition give efficient allocation of resources?
Question 3
What cannot be available in a perfectly competitive industry?
Question 4
Why, in spite of an efficient allocation of resources, may perfect competition not be a good thing for the consumer?
Question 5
Explain the differences between static and dynamic efficiency.
Question 6
Explain the differences between competitive and concentrated markets.
Question 7
What is meant by economic efficiency?
Question 8
Can monopolies ever be efficient?
Oligopoly - short answer

Question 1
Explain why price competition is rare in oligopoly.
Question 2
Explain the phenomenon of sticky prices in an oligopolistic market.
Question 3
Explain two models of an oligopolistic market.
Question 4
Explain why it is often considered that firms in oligopoly will collude over prices and form cartels and other forms of price fixing.
Question 5
Why is it difficult to break into an oligopolistic market?
Question 6
Discuss the various factors which a firm in an oligopolistic market is likely to take into account when deciding upon the price to charge for its product.
Price discrimination - short answer

Question 1
Explain how a motorcar manufacturer may practice price discrimination.
Question 2
What does a monopolist have to ensure does not happen if it wants the process of price discrimination to work?
Question 3
For price discrimination to work successfully the supplier will have to divide the market into at least two sections or segments. What characteristics do these segments have to have for the procedure to work?
Question 4
Who gains from price discrimination?
Question 5
Discuss how price discriminating monopolists stop products or services leaking from one market to another.
Theory of firm - essay

Question 1
(a) Explain why only normal profit may be earned in the long run in perfect competition
(b) Evaluate the view that the main goal of firms will always be that of profit maximisation.
The big giveaway
Read the article The big giveaway and then consider answers to the questions below. You can either read the article in the window below or you can follow the previous link to read the article in a separate window.

Question 1
Explain what is meant by the term 'freeconomics'.
Question 2
How can firms afford to make goods and services available for free?
Question 3
"Anderson's idea is that the internet, by reducing marginal costs, encourages businesses to make their money by offering free goods or services to an extent we have not witnessed before". Discuss the extent to which doing business over the internet reduces marginal costs.
Fixing it transparently
Read the articles Glassmakers fined record 1.4bn euros for price-fixing by European regulators and Europe fines glassmakers record 1.4bn euros then consider answers to the questions below. You can either read the articles in the window below or you can follow the previous link to read the article in a separate window.

Question 1
Explain what is meant by a cartel and how it is able to increase the profits of its members.
Question 2
Describe the market conditions are most likely to lead to the formation of a cartel?
Question 3
Evaluate two policies that can be used by governments to prevent price-fixing.
Question 4
Identify ways in which price discrimination can take place in an economy. Give examples from your own country/region.
Section 1.5 Theory of the firm - simulations and activities

In this section are a series of simulations and activities on the topic - Theory of the firm. These simulations and activities might include:
- Interactive diagrams - diagrams where you can drag curves or sliders to see the impact of the changes on the diagram
- PlotIT - a chance to build diagrams from data
- Step-by-step - diagrams built up step by step to help you see how to draw them and understand the principles behind the diagram
Click on the right arrow at the top or bottom of the page to move on to the next page.
DragIT - fixed cost curve
In the simulation below, drag the slider to see the impact of changes in fixed costs on the fixed cost curve.
If you would prefer to open this interaction in a new web window, then simply follow the link below:

1 |
Fixed cost changesSelect all the changes below that will result in the fixed cost curve shifting vertically upwards. |
DragIT - variable cost curve
In the simulation below, drag the slider to see the impact of changes in variable cost per unit on the variable cost curve. N.B. Please note that this is a variable cost curve with no diminishing returns to the variable factor.
If you would prefer to open this interaction in a new web window, then simply follow the link below:

1 |
Variable costsAn increase in raw material costs will shift the variable cost curve upwards. |
2 |
Variable cost changesWhich of the following will lead to the variable cost curve shifting downwards? |
DragIT -cost curves
In the simulation below, drag the sliders to see the impact of changes in costs on the various cost curves. N.B. Please note that the variable cost curve is shown with no diminishing returns to the variable factor.
If you would prefer to open this interaction in a new web window, then simply follow the link below:
1 |
Step-by-step - Short-run total cost curve
If you would prefer to view this interaction in a new web window, then please follow the link below:
DragIT -revenue curve
In the simulation below, drag the sliders to see the impact of changes in price on the total revenue curve.
If you would prefer to open this interaction in a new web window, then simply follow the link below:
1 |
Total revenue curveA fall in price will shift the total revenue curve upwards. |
DragIT - Revenue curves (1)
The demand curve for product Z is drawn below. Drag the orange dot, (located at the origin) to where you think is the correct price and quantity combination that would return maximum total revenue (TR) (as you do this the corresponding marginal revenue curve will appear).

1 |
2 |
DragIT - Revenue curves (2)
A change in the firm's output represents a movement along the demand curve (AR) and a movement along the TR curve. A shift in the demand curve would cause the total revenue curve to shift too.
The diagram below shows the current demand curve and marginal revenue curve (AR1and MR1 respectively) for product Z. Demand for this product falls by two units at all prices.
(a) Click on the points where the demand curve crosses the two axes in order to construct the new demand curve.
(b) Now click on the two points where the MR curve crosses the two axes in order to construct the new MR curve.
You may like to check your answer.

1 |
2 |
PlotIT - Profit maximisation
As we saw earlier, profit maximisation will occur for a firm where MC=MR. The following diagram shows the costs and revenues for a product Y over a range of output from zero to 80 units per week. Product Y is one of many products produced by the firm. The fixed costs associated with producing Y are £120 per week, £60 of which is normal profit.

What happens when the demand for a firm's product changes? How will this affect the profit maximising price and output? The following diagram is the same as the one above. It shows the cost and revenue curves for firm X in the production of good Y.
Now assume that a close competitor of product Y has dropped the price of its product. As a result demand for product Y changes by 15 units per week.
In the diagram below, click on the two points in turn where the new AR curve strikes the axes. Then do the same for the MR curve.
You may like to check your answer.

1 |
DragIT - Perfect competition
It should now be clear that the amount of profit or loss that the firm makes will depend on the market price.
In the diagram below drag the price up and down to see the impact of these price changes. Note that the vertical dotted line represents the profit-maximising or loss-minimising output, where MC = MR.

1 |
Perfect competition - equilibriumWhen the firm in perfect competition is making supernormal profits, they are in long-run equilibrium. |
2 |
Perfect competition - shut-down pointIf the price falls below the level of AVC the firm in perfect competition will cease production. |
Step-by-step - perfect competition, short-run supernormal profit
If you would prefer to view this interaction in a new web window, then please follow the link below:
Step-by-step - perfect competition, short-run losses
If you would prefer to view this interaction in a new web window, then please follow the link below:
Step-by-step - perfect competition, firm and industry
If you would prefer to view this interaction in a new web window, then please follow the link below:
DragIT - Monopoly (1)
The amount of profit that the firm under monopoly makes depends on (a) demand, and hence the position of the AR and MR curves; (b) costs, and hence the position of the AC and MC curves.
In the diagram below, drag the average and marginal cost curves to see the impact that changes in cost will have on the firm's profitability.

1 |
Monopoly equilibriumIf AC is greater than AR where MC=MR, then the monopolist will be making a loss. |
2 |
Monopoly - equilibriumWhere the AC is tangential to the AR curve the monopolist will be making supernormal profit. |
DragIT - Monopoly (2)
The diagram below shows the profit-maximising price and output of a firm facing a downward-sloping demand curve. Show the effect on price and output of a rise in demand by dragging the AR and MR curves. Do this by clicking on the 'MR1' label and dragging it vertically up and down.
Now click on the top of the MC curve and, by making it steeper or flatter, show the effect on Q and P after the AR curve has been dragged to the right.
Step-by-step - monopoly
If you would prefer to view this interaction in a new web window, then please follow the link below:
DragIT - Welfare loss under monopoly
Deadweight welfare loss depends on the degree of monopoly power, which in turn depends on the price elasticity of demand for the monopoly's product.
To see how the deadweight welfare loss changes as the price elasticity of demand changes, drag the handle at the end of the AR curve (i.e. the demand curve) in the diagram below. The deadweight welfare loss is represented by the shaded area. As demand becomes more elastic, so the deadweight welfare loss decreases.
Step-by-step - monopolistic competition, short-run
If you would prefer to view this interaction in a new web window, then please follow the link below:
Step-by-step - monopolistic competition, short-run
If you would prefer to view this interaction in a new web window, then please follow the link below:
