
The real supply curve?
The supply curve is usually drawn as an upwards (left to right) sloping curve. This implies that as price rises, so will the supply (Law of Supply). This further supposes that the response time for the supplier is zero. In many cases this is far from the case. If it was, then supermarket shelves would never be out of stock of the item you want! Consider the market for houses in a region illustrated in Figure 1 below.
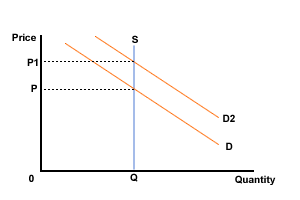
Figure 1 Supply of houses
Builders are constructing and selling 'Q' houses per month at present at price 'P'. Suddenly demand increases significantly, as a government department is moving a capital city office there. What can be done? Not much, at least in the next few months.
Supply is essentially fixed at Q, regardless of demand. The supply curve is a vertical line. Prices will be put up by the developers if they think it worthwhile - in our diagram prices have risen to P1.
 Supply
will take time to react to the new situation. They need land and
planning permission and this can take months or years to organise. It
will then take anything from 6 months to a year to build the house
itself.
Supply
will take time to react to the new situation. They need land and
planning permission and this can take months or years to organise. It
will then take anything from 6 months to a year to build the house
itself.
Figure 2 Increase in supply
Now think about the supply of things like CIVIL AIRCRAFT, AGRICULTURAL PRODUCTS and FOREIGN HOLIDAYS.
SUPPLY CHANGES SLOWLY, MUCH MORE SLOWLY THAN DEMAND.