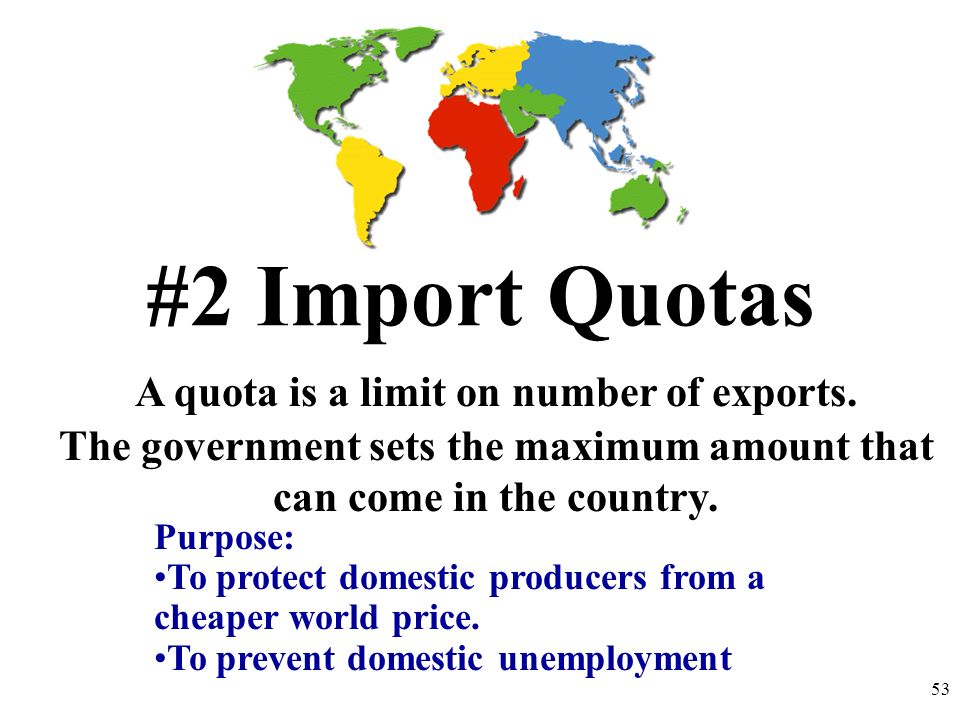
Types of protectionism - Quotas
When analysing the effects on stakeholders of imposing a quota on imported goods it is best seen in a quota diagram. So you are going to construct a diagram - active economics - step by step.
1. Have ready an A4 sheet of paper (you may want graph paper), a pencil, pen and ruler (you can also have an eraser ready)
2.
Draw 2 axes for price and quantity, a supply and demand curve (make
this big and clear). label these Sdom and Ddom for domestic S and D
3. This time DO NOT draw your dotted lines and equilibrium price (Pe) and quantity(Qe) - it will only get in the way
4. Draw a horizontal line well below the equilibrium to represent supply at the world price - assuming that domestic consumers can buy as much from the world market at the world price as they want to without affecting the world price. Many countries supply goods compared with domestic demand, therefore perfectly elastic.
Now work out and indicate on your diagram:
(i) The equilibrium quantity (Sworld = Ddom) label it Qe
(ii) Of that equilibrium
quantity how much is produced by domestic producers? Label it Qdom
(iii) How much is therefore imported from the world market.
5.
Impose a quota - to be effective the quota must be a quantity that is
less than the amount imported (or it would not be a limit on imports
obviously).To do this put a point somewhere between Qdom and Qe on the
World supply curve and on the quantity axis, label it Qquota
Now letīs summarise where we are:
(i) Consumers can buy 0 to Qdom from domestic producers, and
(ii) Qdom to Qquota from imports.
(iv) Is this an equilibrium
situation? Hopefully you can see that it is not - there are consumers
willing and able to buy at higher than world prices
and there are
domestic producers willing and able to produce and sell at higher
prices than world prices.
(v) Therefore there is a new supply curve shifted parallel to the original Sdom and displaced by the amount of the Quota. Draw this is your diagram.
(vi) Now draw in your dotted lines to show the new equilibrium. Qe2
Given the stakeholders (domestic producers, foreign producers, consumers and the government) evaluate from this analysis who wins and who loses from the imposition of a tariff.
What
price do consumers have to pay compared with the world price they used
to pay? How much can consumers buy compared with pre-quota amount?
How much is the total domestic sales? Qdom + (Qquota to Qe2) so dom sales increases - producers benefit
How much is now imported? Qdom to Qquota
By how much have imports been reduced? So foreign producers lose out.
Is there any government revenue? Is there a cost to government?
Are quotas a better option than tariffs would you say?
Can
you reason through the deadweight losses? (the presentation below is a
beautiful explanation of the effects of quotas, using a diagram)
Setting a quota - calculation
Syllabus: Calculate from diagrams the effects of setting a quota on foreign producers on different stakeholders, including domestic producers, foreign producers, consumers and the government.
For higher level, you need to be able to understand how to calculate the impact of a quota on a market. You will need to calculate this from linear demand and supply functions and to be able to calculate the change in consumer expenditure and the domestic and overseas firm's revenue from the diagram. The presentation below goes through this. Click on the screenshot, or link below, to open the presentation. It will open in a new web window. You will need a headset or speakers to listen to the explanation.
If you have trouble opening this it could be because of the browser you are using - Google Chrome seems to work best


