Comparative advantage
Syllabus: (You need to be able to)- Explain the theory of comparative advantage.
- Describe the sources of comparative advantage, including the differences between countries in factor endowments and the levels of technology.
- Draw a diagram to show comparative advantage.
- Calculate opportunity costs from a set of data in order to identify comparative advantage.
- Draw a diagram to illustrate comparative advantage from a set of data.
 While Adam Smith (1723-1790) was raving about the insight that
countries who produce goods more efficiently than others, are
better off producing what
they are good at, produce more than they need and trade the surplus for
goods they are not efficient at producing
(Absolute Advantage)...
...David
Ricardo (1772-1823) used this insight to bring a most amazing situation
to light.
Countries will benefit from
trade, not only when they have an absolute advantage, but also if they
have a comparative advantage.
It would be always beneficial for two countries to trade if they have different relative costs (opportunity cost) of producing a good.
Why is this amazing? I
hear you ask. The point is that countries are better off specialising
and trading even if one of the countries is better (more efficient) at
producing both (or all) goods. Now that is not so obvious. Thinking
time: because on the face of it this does not make sense.
Definition: Comparative Advantage
A country has a comparative advantage in producing a good, if it is able to produce the good at a lower opportunity cost (ie by sacrificing less production of other goods) than other countries.
You may wish to revise to revise PPC
and Opportunity Cost because we are going to use these extensively for
this theory. You will need to access the Microeconomic iText for this.
Comparative advantage theory
Start all models and theories with simplifying assumptions - to make it easier to understand the argument. The theory of comparative advantage is based on the following assumptions:
- There are no trade restrictions
- There are no transport costs
- There are no exchange rates
- It is a 2 good, 2 country world
You will see everything much more clearly if use graph paper and plot points properly, when following the reasoning below.
The point of what follows
is that if countries do not specialise and trade the PPC is also the
Consumption Possibility Curve ie the country cannot consume
combinations of goods and services (ie Hardware and Software in the
example below) that are beyond their respective PPC. However with
specialisation and trade they can: Therefore as long as there are different opportunity costs of production (irrespective of which country is the more efficient - absolute advantage) both countries are better off specialising and trading.
Letīs do Economics!
There
are two countries - Utopia and Happyland. These countries produce two
products - Hardware and Software. According to the theory of
comparative advantage each country should specialise in production of
the good where it has a lower opportunity cost. You need to draw the
PPCs for each country.
Before specialisation and trade situation and opportunity costs
1.
Draw up a table: Before trade each country uses a half of its resources
to produce hardware and another half to produce software.
| Production and consumption | Hardware (units) | Software (units) |
|---|---|---|
| Utopia | 100 | 500 |
| Happyland | 50 | 750 |
| Total World | 150 | 1250 |
2. Now construct the PPCs
for both countries: Make sure you fully understand each step in the
construction. Why are they a straight line? Actually what would be
better is if you plot 2 separate diagrams (1 for Utopia and 1 for
Happyland)
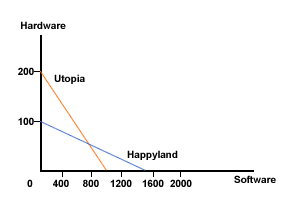
Figure 1 Production and consumption possibilities before trade

Utopia:
To produce 200 units of Hardware the opportunity cost is (ie it cannot also have) 1000 units of Software - can you see why? Therefore producing 1 unit of Hardware `costsī 5 units of Software:
1 Hardware = 5 Software
To produce more units of Software Utopia has to give up 1/5 Hardware (divide both sides by 5):
1 Software = 1/5 Hardware
Happyland:
To produce 1 more Hardware Happyland has to give up 15 units of Software:
1 Hardware = 15 Software
To produce more software Happyland has to give up 1/15 Hardware (Divide both sides by...?)
1 Software = 1/15 Hardware
4. Decide which country should specialise in which good. In conclusion, Utopia has a comparative advantage (lower opportunity cost) in production of Hardware and should specialise in production of Hardware.
Happyland has a comparative advantage (lower opportunity cost) in production of Software and should specialise in production of Software.
Specialisation
5. Construct a table to show the situation after production but before trade. The table below shows specialisation based on comparative advantage.
| Hardware (units) | Software (units) | |
|---|---|---|
| Utopia (production) | 200 | 0 |
|
Happyland (production) |
0 | 1500 |
| Total production | 200 | 1500 |
Trade
6. Specify suitable terms of trade: As each country produces only one good, they will have to trade to be able to consume some of the other good. The terms of trade must settle somewhere between the two opportunity cost ratios to ensure that both countries benefit. As we saw earlier:
In Utopia 1 Hardware = 5 Software and in
Happyland 1 Hardware = 15 Software, so make the terms of trade (the world price in real terms)
ToT: 1 Hardware = 10 Software
7. State an example trade: If
Utopia decide they need 750 units of Software how much Hardware would
they need to give up? Compare this with the `costīof producing Software
for themselves.
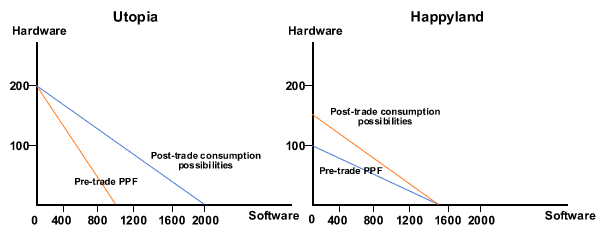
8. Construct a table to show the situation after trade: Utopia and Happyland will have the following amounts of Hardware and Software available for consumption (can you justify each number?):
| Hardware (units) | Software (units) | |
|---|---|---|
|
Utopia (consumption) |
125 | 750 |
|
Happyland (consumption) |
75 | 750 |
| Total production | 200 | 1500 |
9. Plot these points on your original 2 PPC diagrams - are they outside they original PPCs? Draw in the new Consumption Possibility Curves.

10. Both countries are better
off from specialisation and trade, because they can reach higher levels
of consumption of both goods than was possible before specialisation.
After trade they are both able to consume beyond their production
possibility curves -no matter how many goods they decide to trade.
Ah you say - it is
obvious from the original PPCs that Utopia should specialise in
Hardware and Happyland. So how about doing this all again but this time
the 2 countries are Paulinhastan and TwoMsasia?
Letīs do economics!
Using half their
respective resources the countries can produce as follows. Now prove
they are better off specialising even though Paulinhastan can produce
more of both goods (Follow all the steps above but with these numbers)
| Production and consumption | Chilli burgers |
Carrot cake |
| Paulinhastan |
200 |
1000 |
| TwoMsasia |
50 |
750 |
| Total World |
250 |
1750 |
Limitations of comparative advantage theory
Syllabus: Discuss the real-world relevance and limitations of the theory of comparative advantage, considering factors including the assumptions on whichit rests, and the costs and benefits of specialization (a full discussion must take into account arguments in favour and against free trade and protection.
In the real world what do you think New Zealand (Pop 4,565,185) specialises in? Does the USA (Pop 324,118,787) produce these goods too? Can they produce more than NZ? Do they trade with NZ for these goods? Why?
Thinking time: Do the simplifying assumptions negate the principle of Comparative Advantage? How can you build into the model things like transport costs? Does the theory take into consideration political decisions?
Research: Is Donald Trump a Free-trader? Collect some quotes to illustrate your view.
