Four point moving average - worked example

Worked example using a four-point moving average
Sales of XYZ Ltd.
| Sales Revenue | ($000s) | |||
| Year | Quarters | |||
| 1 | 2 | 3 | 4 | |
| 1 | 240 | 224 | 204 | 240 |
| 2 | 244 | 236 | 220 | 262 |
| 3 | 260 | 254 | 230 | 286 |
A qualitative examination of this data shows that the general trend is one of rising sales. Superimposed on this is an annual cycle with the highest sales in quarter 1 and the lowest in quarter 3 - this is likely to be a seasonal variation. Now let us investigate the figures quantitatively.
Extracting the 'trend'
After calculating an average of year 1, consisting of quarters 1 to 4, we then drop the first quarter's sales value and replace it with that of quarter 1, year 2. The average has, therefore 'moved' forward one quarter.
| Periods used (Yr/Qtr) | Moving Average | Trend |
| 1/1, 1/2, 1/3, 1/4 | (240+224+204+240) / 4 | = 227 |
| 1/2, 1/3, 1/4, 2/1 | (224+204+240+244) / 4 | = 228 |
| 1/3, 1/4, 2/1, 2/2 | (204+240+244+236) / 4 | = 231 |
| 1/4, 2/1, 2/2, 2/3 | (240+244+236+220) / 4 | = 235 |
| 2/1, 2/2, 2/3, 2/4 | (244+236+220+262) / 4 | = 240.5 |
| 2/2, 2/3, 2/4, 3/1 | (236+220+262+260) / 4 | = 244.5 |
| 2/3, 2/4, 3/1, 3/2 | (220+262+260+254) / 4 | = 249 |
| 2/4, 3/1, 3/2, 3/3 | (262+260+254+230) / 4 | = 251.5 |
| 3/1, 3/2, 3/3, 3/4 | (260+254+230+286) / 4 | = 257.5 |
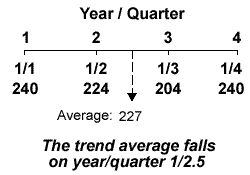
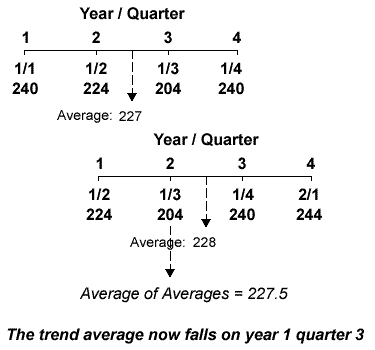
The problem with this method is that the resulting trend figures do not fall on a particular quarter, but between quarters (see Figure 1). Since it is necessary to compare the sales trend with actual sales, it is advisable to obtain a trend that falls on a particular quarter. This is achieved by a process called CENTREING, where we add and average pairs of trends. The resulting average is thus based on eight quarter's data (Figure 2).

Figure 1: Mean of four-quarter sales

Figure 2: Centreing of two successive four-quarter moving averages
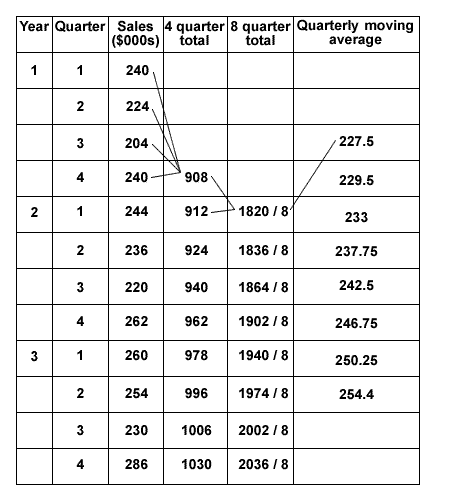
Since the trend average now corresponds with an actual month and we can compared this figure directly with the actual sales of that month. In practice, it is easier to add the two successive 4-period moving totals together and divide the result by 8, as shown below.

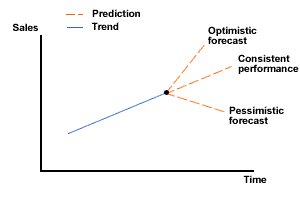
The trend line can be extended to forecast the future trend line on the assumption that the trend of the past will continue in the future. The angle of the extension could be changed according to other data, e.g. economic forecasts that might suggest that the future will be better, worse or similar to now.
