Forecasting and correlation

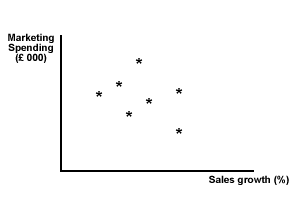
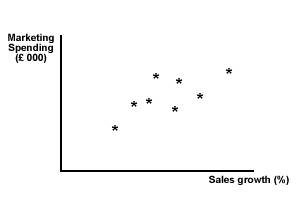
Correlation describes a relationship between two sets of numbers. A scatter diagram can be used to see if there is a possible correlation between two sets of data. The closer the relationship between the two data sets, the closer the correlation and the higher the 'correlation coefficient'. We can see this from the two scatter graphs shown below - one has a high level of correlation between marketing spending and sales growth, while the other shows a low correlation.

Figure 2 Low correlation - sales growth and marketing spending

Figure 3 High positive correlation - sales growth and marketing spending
Correlation is a tool that is perhaps most used in marketing.
- It can show you the extent of a relationship between the sets of data.
- It can help plan with greater certainty and allocate resources accordingly.
Correlation can be placed alongside forecasting in that extrapolation needs to be considered in relation to other positive or negative variables. Changes in the external environment that are positively or negatively correlated with a firm's sales will have to be factored into any predictions of future sales growth.

Without being too repetitive, it is necessary to treat data with caution ... numbers can often be used to prove opposing points of view - it is a matter of the quality of the data (GIGO) and the nature of the interpretation and tools used.
Note:
- The sample may be too small and therefore not significant
- The industry may be subject to fast technical change
- The external environment can change
