Table of Contents

  1. Topic pack - Microeconomics - introduction
  2. 1.1 Competitive Markets: Demand and Supply
  3. 1.1 Competitive Markets: Demand and Supply - notes
  4. 1.1 Competitive markets - questions
  5. 1.1 Competitive markets - simulations and activities
  6. 1.2 Elasticities
  7. 1.2 Elasticities - notes
  8. Section 1.2 Elasticities - questions
  9. Section 1.2 Elasticities - simulations and activities
  10. 1.3 Government intervention
  11. 1.3 Government Intervention - notes
  12. 1.3 Government intervention - questions
  13. 1.3 Government intervention - simulations and activities
  14. 1.4 Market failure
  15. 1.4 Market failure - notes
  16. Section 1.4 Market failure - questions
  17. Section 1.4 Market failure - simulations and activities
  18. 1.5 Theory of the firm
  19. 1.5 Theory of the firm - notes (HL only)
    1. Cost theory
    2. Calculating costs
    3. Short-run
    4. Long-run
    5. Internal economies of scale
    6. External economies of scale
    7. Diseconomies of scale
    8. Long run cost curves
    9. The very long run
    10. Revenues
    11. Revenues - notes
    12. Profit
    13. Profit - notes
    14. Combining revenue and cost curves
    15. Profit maximisation - price taker
    16. Profit maximisation - price setter
    17. Alternative aims of firms
    18. Profit, sales and revenue maximisation
    19. Perfect competition
    20. Perfect competition - notes
    21. Short-run to long-run - profits
    22. Short-run to long-run - losses
    23. Shut down price, break-even price
    24. Efficient allocation of resources
    25. Monopoly and oligopoly
    26. Monopoly and oligopoly - introduction
    27. Growth and power
    28. The model of monopoly
    29. Monopoly - profit maximisation
    30. Monopoly equilibrium
    31. Monopoly v. perfect competition
    32. Economic efficiency in perfect competition
    33. Economic efficiency in perfect competition and monopoly
    34. Efficiency and market structure
    35. Monopolistic competition
    36. Monopolistic competition - notes
    37. Monopolistic competition in the short-run
    38. Monopolistic competition in the long run
    39. Oligopoly
    40. Oligopoly - notes
    41. Advertising and branding
    42. Product innovation
    43. Theories of oligopoly - non-collusive
    44. The kinked demand curve theory
    45. Kinked demand curve - change in cost
    46. Cut-price competition (predatory pricing)
    47. Theories of oligopoly - collusive
    48. Forms of collusion
    49. Price discrimination
    50. Equilibrium of the discriminating monopolist
  20. Section 1.5 Theory of the firm - questions
  21. Section 1.5 Theory of the firm - simulations and activities
  22. Print View

Revenues - notes

Revenue is the income a firm obtains from the sales of its goods or services. Three terms must be understood:

S:\TripleA\Design\icons\small\key_terms.gif

  • Total revenue (TR) - all the revenue earned by the business. Total revenue = price x quantity demanded.
  • Average revenue (AR) - total revenue divided by number sold.
  • Marginal revenue (MR) - the increase in total revenue as the result of one more sale. This is not necessarily the same as the price. It is only the same as price, if price remains constant.

Revenue curves vary depending on whether price is constant at all levels of output (as in the case of a firm which is a price-taker), or falls as output increases (as in the case of a firm who is a price-setter). Look at Figures 1 and 2 below to see the difference this makes to the shape of the average / marginal revenue and total revenue curves:
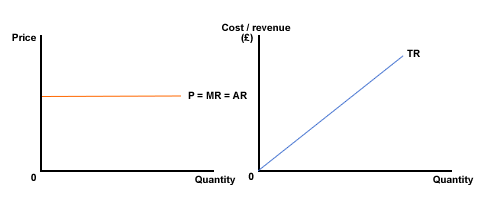
ar_mr_tr_price_taker

Figure 1 Revenue curves - constant price (price-taker)
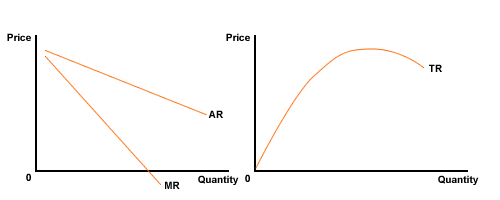
ar_mr_tr

Figure 2 Revenue curves - falling price (price-setter)

You have to be able to calculate revenue, in any form, from data, then draw and interpret curves. Time for an example, and for you to do some work again!

Output (units) 0 1 2 3 4 5 6 7 8 9 10
Total revenue ($ 000) 0 100 180 240 280 300 300 280 240 180 100


Plot this with output on the horizontal axis and revenue on the vertical axis. Look at it and then we will do some more calculations.

There is also a static version of this graph available.

Total revenue rose at first, reached a maximum, and then declined.

question

From the total revenue curve data above, now calculate the figures for marginal revenue and average revenue. Once you have had a go, click on the answer link below to check your calculations.

Answer - revenue calculations

Now, plot the marginal and average revenue curves from this data as well. Examine it. What does it tell you?

There is also a static version of this graph available.

Observation of the graph shows:

  • Both AR and MR fall as output increases.
  • AR and MR start at the same point on the Y-axis, at the same level of revenue.
  • MR can and does become negative.
  • Using the first graph as well, when MR is zero, TR is at its maximum. Output is 5.5 units.