Table of Contents

  1. Topic pack - Macroeconomics - introduction
  2. 2.1 The level of overall economic activity (notes)
  3. 2.1 The level of overall economic activity (questions)
  4. Section 2.2 Aggregate demand and supply (notes)
  5. Section 2.2 Aggregate demand and supply (simulations and activities)
  6. 2.2 Aggregate Demand and Aggregate Supply (questions)
  7. 2.3 Macroeconomic objectives (notes)
  8. Low Unemployment
    1. Low Unemployment
    2. What the data says
    3. The meaning of unemployment
    4. Case study - regional variation
    5. Consequences of unemployment
    6. Case study - tougher for men
    7. Types and causes of unemployment
    8. Disequilibrium unemployment
    9. Equilibrium unemployment
    10. Policies to reduce unemployment
    11. Low and stable inflation
    12. Low and stable inflation (notes)
    13. The meaning and measurement of inflation
    14. A consumer price index
    15. Finding out more about consumer price index weights
    16. Problems with measuring inflation
    17. Inflation - videos
    18. Consequences of inflation
    19. Hyperinflation
    20. The consequences of deflation
    21. Types and causes of inflation: demand-pull inflation
    22. Types and causes of inflation: cost-push inflation
    23. Case Study - car prices in Trinidad
    24. Possible relationships between unemployment and inflation
    25. PlotIT - Phillips curve
    26. Phillips curve - long-run
    27. Natural rate of unemployment
    28. NAIRU
    29. Economic growth
    30. Economic growth (notes)
    31. Causes of economic growth
    32. Economic growth and the PPF (1)
    33. Economic growth and the PPF (2)
    34. Economic growth and the business cycle
    35. Economic growth and the aggregate supply curve
    36. Consequences of economic growth
    37. Equity in the distribution of income
    38. Equity in the distribution of income (notes)
    39. Indicators of income equity
    40. Poverty
    41. The poverty line: An Indicator of Relative poverty
    42. The causes of poverty
    43. The role of taxation in promoting equity
    44. The role of taxation in promoting equity (notes)
    45. Other methods of promoting equity
  9. 2.3 Macroeconomic objectives (questions)
  10. 2.4 Fiscal policy (notes)
  11. 2.4 Fiscal policy (questions)
  12. 2.5 Monetary policy (notes)
  13. 2.5 Monetary Policy (questions)
  14. Section 2.6 Supply-side policies (notes)
  15. 2.6 Supply-side policies (questions)
  16. Print View

Calculating Taxes

Syllabus: Calculate the marginal rate of tax and the average rate of tax from a set of data.

Marginal Rate of tax

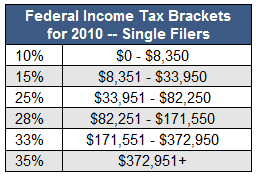
Here you can see the income tax thresholds for the USA Federal Income Tax. It is progressive as the higher the income received the higher the tax rate. The most significant thing to take note of is that each bracket only refers to income earned at that level. A person receiving $10,351 would have $8,351 taxed at the rate of 10% and the next $2,000 taxed at 15% - they would NOT have the whole 10,351 taxed at 15%.

The marginal tax rate is the tax rate on the next $ received. If a person was receiving $35,000 and they were to receive an extra $1 the marginal tax rate would be 25%.

If a person was receiving  $8,350  and gained an extra  $1 then the marginal tax rate for that $ would be 15% - they would pay an extra 15c in tax.

More Detail if you need it

This table can be a little confusing without further explanation. Please note that everyone is taxed in steps. A person earning $100,000 is not taxed 28% on the entire amount. Instead, he is taxed 10% on the first $8,350 earned, 15% for the portion $8,351to $33,950, 25% for $33,951 to $82,250, and 28% for the remainder:


Average Rate of tax

The Average Rate of Tax is calculated by  ATR =           Total Tax Paid      
                                                                          Total Taxable Income

The total amount of taxes paid by an individual or business divided by taxable income. This rate will vary based on the amount of income received during the taxable period. For example, if Steve paid $3,000 in taxes on income of $25,000, his average tax rate would be 12%. Formula: Paid taxes/taxable income = average tax rate.

Read more: http://www.investorwords.com/8529/average_tax_rate.html#ixzz3x2jzdi9I

Note: If people are allowed to earn a basic amount which is not subject to tax it should not be included in the calculation.

Past Paper Essay

Nov 2008

3. (a) Explain the difference between progressive taxation and regressive taxation. [10 marks]

    (b) Evaluate the possible effects of a decrease in direct taxation on a country’s inflation rate, unemployment rate         and balance of payments. [15 marks]