Economic growth and the business cycle
Remember, economic activity is measured by GDP and is prone to short term cyclical fluctuations (See Page 33 for Business Cycle and Page 20 for GDP). This was referred to as the of business cycle or trade cycle. The diagram below shows the various stages of the trade cycle and can also be used to illustrate whether an economy is experiencing long term economic growth. To observe this look at the trend line. If the trend shows GDP increasing over time, then the economy will be experiencing economic growth. The trend line can also slope downwards, in which case the economy is experiencing economic decline or negative economic growth.
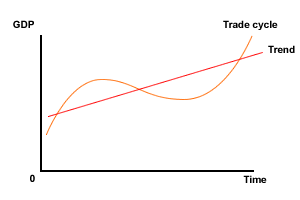 Economic Growth
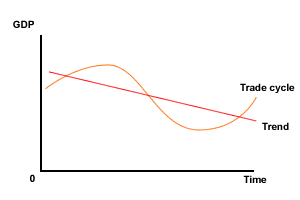 Economic Decline
Economic growth - what the data says

Identify the levels of GDP per capita in your country by accessing the World Bank Catalogue though this link.
- Choose the World Development Data set
- Click on Indicators
- Type the term 'GDP per capita' into the search engine.
- Save the GDP per capita data in a spreadsheet
- plot the data over a 20 year period using a graph
- try to draw a trend line
- if you have managed to establish a trend line - is this upward, or downward sloping?

1. Describe the data you have plotted. Identify whether there is evidence of a business or trade cycle.
Repeat the exercise for two other countries from different continents.
2. Identify similarities and differences between the three sets of GDP data.
3. Analyse the factors that might account for the similarities and differences you have identified. (You may want to revisit this answer once you have completed this section).