
Table of Contents

  1. Topic pack - Macroeconomics - introduction
  2. 2.1 The level of overall economic activity (notes)
  3. 2.1 The level of overall economic activity (questions)
  4. Section 2.2 Aggregate demand and supply (notes)
  5. Section 2.2 Aggregate demand and supply (simulations and activities)
  6. 2.2 Aggregate Demand and Aggregate Supply (questions)
  7. 2.3 Macroeconomic objectives (notes)
  8. Low Unemployment
    1. Low Unemployment
    2. What the data says
    3. The meaning of unemployment
    4. Case study - regional variation
    5. Consequences of unemployment
    6. Case study - tougher for men
    7. Types and causes of unemployment
    8. Disequilibrium unemployment
    9. Equilibrium unemployment
    10. Policies to reduce unemployment
    11. Low and stable inflation
    12. Low and stable inflation (notes)
    13. The meaning and measurement of inflation
    14. A consumer price index
    15. Finding out more about consumer price index weights
    16. Problems with measuring inflation
    17. Inflation - videos
    18. Consequences of inflation
    19. Hyperinflation
    20. The consequences of deflation
    21. Types and causes of inflation: demand-pull inflation
    22. Types and causes of inflation: cost-push inflation
    23. Case Study - car prices in Trinidad
    24. Possible relationships between unemployment and inflation
    25. PlotIT - Phillips curve
    26. Phillips curve - long-run
    27. Natural rate of unemployment
    28. NAIRU
    29. Economic growth
    30. Economic growth (notes)
    31. Causes of economic growth
    32. Economic growth and the PPF (1)
    33. Economic growth and the PPF (2)
    34. Economic growth and the business cycle
    35. Economic growth and the aggregate supply curve
    36. Consequences of economic growth
    37. Equity in the distribution of income
    38. Equity in the distribution of income (notes)
    39. Indicators of income equity
    40. Poverty
    41. The poverty line: An Indicator of Relative poverty
    42. The causes of poverty
    43. The role of taxation in promoting equity
    44. The role of taxation in promoting equity (notes)
    45. Other methods of promoting equity
  9. 2.3 Macroeconomic objectives (questions)
  10. 2.4 Fiscal policy (notes)
  11. 2.4 Fiscal policy (questions)
  12. 2.5 Monetary policy (notes)
  13. 2.5 Monetary Policy (questions)
  14. Section 2.6 Supply-side policies (notes)
  15. 2.6 Supply-side policies (questions)
  16. Print View

Economic growth and the aggregate supply curve

Syllabus: Explain, using an LRAS diagram, economic growth as an increase in potential output caused by factors including increases in the quantity and quality of resources, leading to a rightward shift of the LRAS curve.

You can use aggregate demand and supply diagrams to illustrate economic growth.

Increasing Potential Economic Growth (Capacity)

An increase in potential economic growth will cause the long run aggregate supply curve to shift to the right as in figure 1 below. Remember economic growth is often associated with increases in Real Investment which increases the Quantity and Quality of Factors of Production, a key element of this is investment in infrastructure (see Supply Side Policies).


Neoclassical LRAS

LRAS Curve shifts to the right showing Full Employment (capacity or potential production if all resources are used efficiently) has increased from Y1 to Y2


Figure 1 - Increase in long-run aggregate supply Neoclassical


Keynesian LRAS


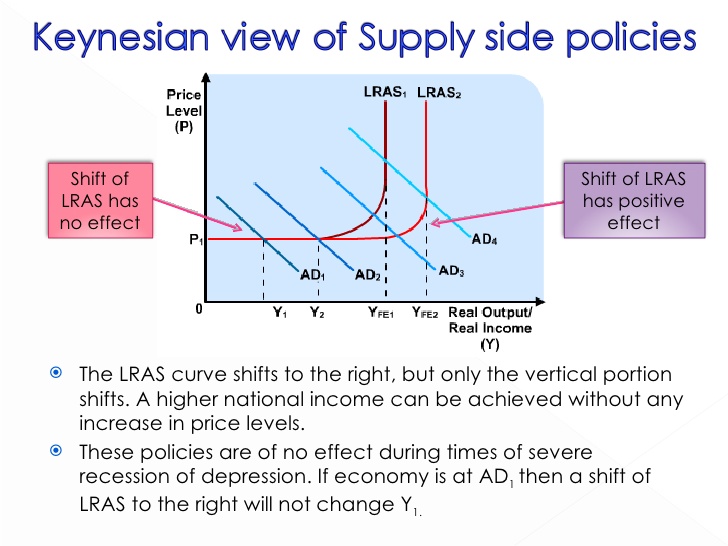
Figure 2 - Increase in long-run aggregate supply Keynesian

Again LRAS Curve shifts to the right (but different representation) showing Full Employment (capacity or potential production if all resources are used efficiently) has increased from Yfe1 to Yfe2

If you wish to see more about Supply Side Policies open Page 165 onwards

Increasing Actual Economic Growth

Actual Economic Growth is shown by the change in equilibrium output in either diagram so just to be clear - shifting the LRAS itself shows changes in potential growth (Full Employment, Capacity etc changes) and actual growth is shown where AD and AS interact to set the equilibrium which may not be at full employment according to keynesian Economists and policy makers.