
Gantt Chart
AO2 You need to be able to:
Demonstrate application and analysis of knowledge and understanding Command
Terms: These terms require students to use their knowledge and skills to
break down ideas into simpler parts and to see how the parts relate: Analyse,
Apply, Comment, Demonstrate, Distinguish, Explain, Interpret, Suggest
AO3 You need to be able to: Demonstrate synthesis and evaluation. Command
terms these terms require you to rearrange component ideas into a
new whole and make judgments based on evidence or a set of criteria. Compare,
Compare and contrast, Contrast, Discuss, Evaluate,
Examine, Justify, Recommend, To what extent
AO4 You need to be able to Demonstrate a variety of
appropriate skills. Command Terms These terms require you to demonstrate
the selection and use of subject-specific skills and techniques: Annotate,
Calculate, Complete, Construct, Determine, Draw, Identify, Label, Plot, Prepare
- What the main activities are
- When each activity starts and ends in relation to other activities
- How long each activity lasts
- Overlapping bars show simultaneous activities (can be done at the same time as each other) thus saving overall time
- The start and end dates of the whole project
Creating a Gantt Chart
Steps:
1. Identify essential tasks
All activities must be included/ earliest start dates and duration must be estimated - easier if similar projects have been done before.
2. Identify relationships between activities
Some tasks will need to be started only after preceding tasks are finished (Linear tasks), Some tasks can occur simultaneously (Parallel tasks)
3. Draw the chart
Usually specialised software or templates are used these days and cloud computing allows many mangers to access the planning tool even if they are at different locations.
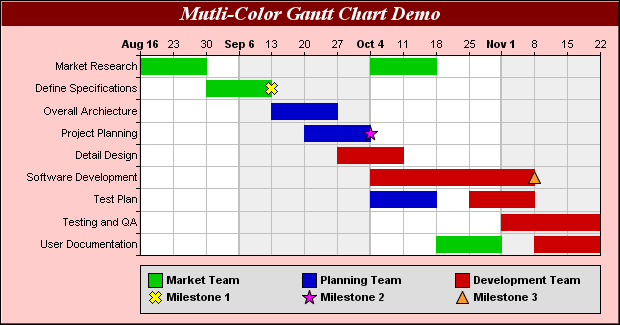
Example - note also the use of colour
Advantages of Gantt Charts
- Allows for efficient organization – In order for a Gantt chart to be successful, you first need to identify project elements or tasks. If you are using this type of chart you are essentially forced to focus on what truly needs to be done, thus making you somewhat more organized and encouraging a potentially higher chance of success.
- Helps establish timeframes – Because many project elements often depend on other tasks, it can be tough to deduce how long one task should take and when to start and finish it by. Gantt charts use bars to indicate how long a task should take and what this does is give you a better perspective of the total project, and timeframe as a whole. Just be sure to consider time factors outside of the project such as holidays.
- Highly visual – Gantt charts are visual, and give you an excellent way to instantly see and comprehend all of the different elements in once place, thus bringing thoughts and ideas together. Beyond that the visuals provide users with an easy to see chart of what needs to be done next.
- Potentially overly complex – If you’ve ever worked on a complex project, and looked at the Gantt chart, you know that these charts can be large and hard to read. For big projects businesses may need to hire specific managers to look after the details of the project, something which could be costly for small businesses that don’t have an in house project manager.
- Need to be updated – Gantt charts are developed early in the planning stages of a project, there is a good chance that the project will change, thus the chart will need to be updated. Also, as tasks are completed or reviewed the chart will need to be updated to reflect these changes too. Any amendments take time, especially if there are dependent tasks that need to also be revised. It is a pretty sure thing that most people involved in the project probably don’t have the time to do this
- Don’t show the whole picture – Gantt charts show what tasks need to be done and the time they should take. They don’t show how much work each task will involve or how many people/resources each task will require. This can give some people an incomplete picture or the wrong idea about an individual task, which can cause issues as the project gets underway.
Exercise here