
Decision trees
AO2 You need to be able to:
Demonstrate application and analysis of knowledge and understanding Command
Terms: These terms require students to use their knowledge and skills to
break down ideas into simpler parts and to see how the parts relate: Analyse,
Apply, Comment, Demonstrate, Distinguish, Explain, Interpret, Suggest
AO3 You need to be able to: Demonstrate synthesis and evaluation. Command
terms these terms require you to rearrange component ideas into a
new whole and make judgments based on evidence or a set of criteria. Compare,
Compare and contrast, Contrast, Discuss, Evaluate,
Examine, Justify, Recommend, To what extent
AO4 You need to be able to Demonstrate a variety of
appropriate skills. Command Terms These terms require you to demonstrate
the selection and use of subject-specific skills and techniques: Annotate,
Calculate, Complete, Construct, Determine, Draw, Identify, Label, Plot, Prepare
Decision trees are a special type of decision-making aid. You must be systematic and disciplined when preparing one.
The main benefits come from the preparation process, rather than the tree diagram itself. The tree acts as a summary of all that you have done. You have to think logically and clearly, and be willing to hunt for information and data.
Decision trees are an aid to decision making. They are a diagrammatical way of presenting options and probabilities. They reflect the situation that firms frequently have to make decisions in circumstances of doubt and uncertainties.
Constructing a decision tree
A decision tree is constructed working from left to right, but all calculations are made from right to left.
A decision tree consists of:
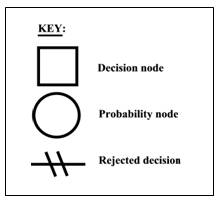
- Squares: These are decision points
- Circles: These are chance or probability nodes
Figure 1 Decision tree - key
The lines that come out of the squares or decision points represent the available options to the decision maker. In the example shown below these are the Project A, Project B and do nothing. The choices are decided by the decision-maker, i.e. they are controllable.
The lines that come out of the circles or probability nodes represent the various outcomes. These outcomes may be uncontrollable by the decision-maker, such as success or failure. The result may be influenced by external factors, such as the reaction of competitors.
Imagine a situation where a firm has to choose between two projects A and B. There is of course a further option; do nothing or stay as you are. Remember, there is always the alternative of doing nothing. This is illustrated below.
Figure 2 Decision tree choices
Now, the gains from the projects may vary, depending on how successful (for example) the marketing is. The marketing could be very good, average or poor. This set of consequences can be added to the decision diagram to give the outline decision tree.
Figure 3 Outline decision tree
Data has to be collected now - data on possible costs, returns and probabilities. Assume that these are collected and have been added to the outline decision tree. The figures in brackets indicate a cost; all others are incomes or revenues (NB You will be given this type of information in exam questions).
Figure 4 Decision tree with costs and returns
It is now necessary to work out the expected value, or weighted average return for each option. Examine the diagram above.
Project A has three possible outcomes. The outcome has a probability
of success and this is expressed as a percentage chance. Let's say that
we estimated that 'very good gains' has a 30% chance of being the
outcome, 'average gains' a 50% chance and 'poor gains' a 20% chance
(again the probabilities are given in exam questions)
The value of all the probabilities must add up to 100% if expressed as a percentage and 1.0, if expressed as decimal (in other words, one of the possibilities must happen). If you multiply the possible outcomes by their probabilities and then add them together, you get the expected value.
| Option A |
Outcome | x | Probability | = | Expected Value |
| Very good marketing | 1000 | x | 0.3 | = | 300 |
| Average marketing | 600 | x | 0.5 | = | 300 |
| Poor marketing | 200 | x | 0.2 | = | 40 |
| Total EV |
640 |
However, there are costs associated with the each project. Project A costs 500, so the net Expected Value is 140 (Value minus cost: 640-500).
You can calculate the net expected value in the same way for
Option B (ie set out the calculations in a table as above) - Do it now
using the data below.
When you conduct calculations for all options you have prepared an evaluated decision tree. The full decision tree is shown in figure 5 below.
Figure 5 A full decision tree with probabilities and expected returns
What does the completed diagram show?
To complete the diagram, the decision-maker may reject options on purely financial grounds and reject the options with the lower financial returns. In this example, the expected values of Project A is 140 and for project B is 120. Both are positive so taking one of these options is better than doing nothing which returns no gain at all. However, project A returns the greater expected outcome, so this would be the choice based on net expected value.
The decision maker shows the two rejected options by drawing two parallel lines through the rejected options. The completed diagram is shown below:
Figure 6 A full decision tree with probabilities, expected returns and rejected options
The expected returns for Project A and project B are quite similar. At this point the decision maker will consider other financial and non-financial factors, such as:
- Training costs
- Maintenance
- Motivation
- Competitor behaviour
- Long-term flexibility
- Business objectives
- Mission and vision statements
- Stakeholder views
Once the non-financial factors are considered a choice can be made.
Non-financial factors should support the financial outcome otherwise
there is a conflict the manager must resolve.
IB exam answers MUST include a key on your finished diagram:
Decision trees have many advantages and disadvantages
Advantages of using decision trees
- Constructing a decision tree may reveal alternative courses of action that had not previously been identified or thought of.
- It formalises the decision making process and makes the process more objective and logical.
- It offers a visual presentation of the options.
- The requirement of numerical values makes results of decision-making better.
- The Management is forced to consider risk.
Disadvantages of decision trees
- Probabilities will usually have to be estimated, and might, themselves, be subject to variability.
- Not all factors or decisions can be given numerical values.
- The results are purely quantitative and ignore more important qualitative factors.
- Data may be out of date when a decision is actually taken.
- The process can be time consuming and expensive. It may not be worth it.
- Expected values are weighted averages of outcomes and are unlikely to relate to the actual outcome.
- Possible options may be overlooked.
