Investment appraisal techniques AO3, AO4
AO3 You need to be able to: Demonstrate synthesis and evaluation. Command
terms these terms require you to rearrange component ideas into a
new whole and make judgments based on evidence or a set of criteria. Compare,
Compare and contrast, Contrast, Discuss, Evaluate,
Examine, Justify, Recommend, To what extent
AO4 You need to be able to Demonstrate a variety of
appropriate skills. Command Terms These terms require you to demonstrate
the selection and use of subject-specific skills and techniques: Annotate,
Calculate, Complete, Construct, Determine, Draw, Identify, Label, Plot, Prepare
Investment appraisal methods divide into two groups:
These are HL and SL
- Simple, easy to calculate methods. They are not very accurate or sensitive, but are good for screening out poor projects from a long list. All projects should be subjected to these tests. These screening tests are
- Payback period
- Average rate of return (ARR)
- Detailed and more accurate tests. If a project passes through the initial screening, then in larger businesses, which can afford the cost, the project may be subjected to more complex tests based on discounted cash flow methods. They are:
- Discounted cash flow (DCF)
- Net present value (NPV)
We will look at all these tests in turn using a single example.

Investment appraisal example
Student Computers plc is trying to decide between two expansion projects. It has the following data available from the projects department. All units are $000's.
Project A has a capital cost (in year 0) of $400k
Project B has a capital cost (in year 0) of $700k
| Net cash inflow ($000) | ||
|---|---|---|
| Project A | Project B | |
| 50 | Year 1 | 100 |
| 100 | Year 2 | 300 |
| 150 | Year 3 | 500 |
| 200 | Year 4 | 300 |
| 100 | Year 5 | 200 |
Which project is best, or should Student Computers decide to do neither?
Payback period AO3, AO4
Payback period
Payback period is a method of investment appraisal that estimates long it will take the estimated returns, made by the investment, to pay for itself. Although simplistic it is the most popular method of investment decision making.
This technique is not a measure of profitability, but more a measure of short-term risk. Long payback periods indicate a high risk, short ones a low risk.
Cumulative cash flow method of payback
Cumulative cash flow
Cumulative data is generated by adding up consecutive numbers within a series. So with project A the annual returns are:
| Project A ($000) |
|---|
| 50 |
| 100 |
| 150 |
| 200 |
| 100 |
So the cumulative returns at the end of each year are:
| Year | Cumulative ($000) |
| 1 | 50 |
| 2 | 150 (50 + 100) |
| 3 | 300 (50 + 100 + 150) |
| 4 | 500 (50 + 100 + 150 + 200) |
| 5 | 600 (50 + 100 + 150 + 200 + 100) |
Payback period method - convert the net cash flow data to cumulative net cash flow and to find the time when cumulative net cash flow is the same as the capital cost. In other words when the project repays the capital cost.
| Project A | Project B | |||
|---|---|---|---|---|
| Cost: 400 | Payback reached? | Capital cost ($000) | Cost: 700 | Payback reached? |
| Cumulative net cash inflow ($000) | ||||
| 50 | No | Year 1 | 100 | No |
| 150 | No | Year 2 | 400 | No |
| 300 | No | Year 3 | 900 | Yes |
| 500 | Yes | Year 4 | 1200 | |
| 600 | Year 5 | 1400 |
The cost of project A has been covered by the end of year 4, and the Project B covered by the end of year 3. But this is not as accurate as we require. We need to know when the payback occurs within the final year.
Project A pays back between 3 and 4 years. At the end of the third year Student Computers need an additional $100 000 to payback their investment. A total of $200 000 in cash inflows are expected in the fourth year, so:
Payback period = 3 + 100/200 = 3.5 years (i.e. 3 years and 6 months)
Project B pays back between years 2 and 3. At the end of the second year, Student computers need an additional $300 000 to payback their investment. A total of $500 000 in cash inflows are expected in the third year, so:
Payback period = 2 + 300/500 = 2.6 years (i.e. 2 years and 7.2 months)
Firms will often set a criterion level or screening test in advance for undertaking a project. For instance Student Computers may state that only projects paying back within 3 years will be undertaken. In this case only Project B would be acceptable. However, they may set a payback period as 5 years, in which case both projects fulfil the investment criterion. Then it is a choice between the two.
Clearly on a financial basis, Project B is preferable as it pays back the quickest. However, other factors may now be considered, such as non-financial issues or liquidity issues. It may be that the firm's cash flow is poor, so it is important to select the project that pays back the quickest even if other factors suggest it is not the best in the long-run.
Benefits of payback method
- Easy to calculate and understand
- Includes the cost of the investment
- Focuses on short-term cash flow and is appropriate for equipment with a relatively short life
Limitations of payback period
- Not a measure of profit.
- Ignores all cash flows after the payback point.
- Ignores the pattern of cash flow.
- Ignores the 'time value' of money.
- Encourages a short-term view of investment

Follow the link below to see a numerical example of these problems.
Payback period - problems
Average rate of return (ARR)
The average rate of return (ARR), measures the annual income of a project as a percentage of the total investment cost, which is something that simple payback does not do. This is a measure of average profit, and is expressed in a familiar percentage form. It is also a relatively straightforward method and the result can be compared with returns from alternative uses of funds and with the base bank interest rate.
As with payback, it is likely that the firm will establish an investment criterion. For example, the firm may decide that any project with an ARR of less than 5% will not be considered.
ARR - The three main steps
The ARR measures the net return each year as a percentage of the initial cost of the investment.
ARR is much easier than the formula may suggest - see the example below
Average rate of return (ARR) = (total returns - capital cost)/years of use X 100 (This is on the IB Formula sheet)
Capital Cost
![]() (This is not on the IB Formula sheet)
(This is not on the IB Formula sheet)

EXAMPLE: Three projects have the following costs and expected income:
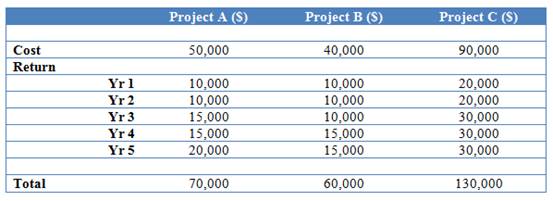
STEP 1. Calculate the total net profit from each project by subtracting the total return of the project from its cost.
![]()
STEP 2. Calculate the net profit per annum by dividing the total net profit by the number of years the project runs for.
![]()
STEP 3. Calculate the ARR using the following formula:
![]()

Calculate the ARR for the projects B and C.

Follow the link below if you need to look again at the example figures.
Student Computers - investment appraisal example
| Project | A | B |
|---|---|---|
| Total gain (sum of each years cash inflow) | 600 | 1400 |
| Less: capital cost | (400) | (700) |
| Total net gain | 200 | 700 |
| Years | 5 | 5 |
| Average net gain | 200/5 = 40 | 700/5 = 140 |
| ARR (as % of initial investment) | 40/400 = 10% | 140/700 = 20% |
This is a measure of profit, and project B seems to be preferable here as well.
Benefits of ARR
- Measures profitability
- Uses all the cash flows
- Easy to understand
- Easy to compare percentage returns with other investment opportunities
Limitations of ARR
- Ignores the pattern of cash flow - when they occur
- Later cash flows are unlikely to be accurate as they are longer term forecasts
- The length of the project or the life span of a machine maybe an estimate
- Ignores the timing of cash flows
- Ignores the 'time value' of money
- Ignores the risk factors associated with a long payback period on liquidity

Follow the link below to see a numerical example of these problems.
ARR - problems
So, with all of the problems associated with these methods of analysis, what are they used for? They are simple and quick to prepare, and are used as screens or sieves to weed out poor, or useless, projects. Firms have to set themselves 'action standards' for payback and ARR, say 3 years maximum and 15% minimum, and only if these are met and/or exceeded will a project 'pass' to be examined by the more complex discounted cash flow method. Action standards are selected by the firm concerned to reflect their view of the future and individual requirements. You will be given them in an exam if they are appropriate.
So in our example (Student Computers) project A has failed; project B has passed. Project B now has to be evaluated allowing for the 'time value' of money.