Topic pack - Accounts and finance - introduction
Welcome to this Triple A Learning topic pack for Accounts and finance. The pack has a wide range of materials including notes, questions, activities and simulations.
A few words about Navigation
So that you can move to the next page in these notes more easily, each page has navigation tools in a bar at the top and the bottom. These tools are shown below.
![]() The right arrow at the top or bottom of the page will take you to the next page of content.
The right arrow at the top or bottom of the page will take you to the next page of content.
![]() The left arrow at the top or bottom of the page will take you to the previous page.
The left arrow at the top or bottom of the page will take you to the previous page.
![]() The home button will take you back to the table of contents for the pack.
The home button will take you back to the table of contents for the pack.
The pack is split into a series of sections and to access each section, the easiest way is to use the table of contents on the left-hand side of the page. To return to the full table of contents, please click on the 'home button' at any stage.
Higher level extension material
Some of the material in this pack relates to the higher level extension topics in the Business and Management guide. This material is marked by icons as follows:

This icon indicates the start of the higher level extension material.

This icon indicates either:
- The higher level extension material continues on the next page or
- The higher level extension material continues from the previous page

This icon indicates the end of the higher level extension material.
To start viewing the contents of the pack, please click on the right arrow at the top or bottom of the page.
Terms and definitions
One of the key things you need to be sure to know are the definitions of all key business terms. In this section we give you explanations and definitions as well as some flash cards, crosswords and word searches to help you practise them.

If you would prefer to view this interaction in a new web window, then please follow the link below:
Click on the right arrow at the top or bottom of the page to start looking at the definitions.
Aims of the business and management course
The aims of the business and management course at HL and SL are to:
- promote the importance of exploring business issues from different cultural perspectives
- encourage a holistic view of the world of business
- enable the student to develop the capacity to think critically about individual and organisational behaviour
- enhance the student's ability to make informed business decisions
- enable the student to appreciate the nature and significance of change in a local, regional and global context
- promote awareness of social, cultural and ethical factors in the actions of organisations and individuals in those organisations
- appreciate the social and ethical responsibilities associated with businesses operating in international markets.
Assessment Objectives
Having followed the business and management course at HL or SL, students will be expected to:
- demonstrate knowledge and understanding of business terminology, concepts, principles and theories
- make business decisions by identifying the issue(s), selecting and interpreting data, applying appropriate tools and techniques, and recommending suitable solutions
- analyse and evaluate business decisions using a variety of sources
- evaluate business strategies and/or practices showing evidence of critical thinking
- apply skills and knowledge learned in the subject to hypothetical and real business situations
- communicate business ideas and information effectively and accurately using appropriate formats and tools.
In addition to the above, students at HL will be expected to:
- synthesize knowledge in order to develop a framework for business decision-making.
Topic Three Structure
Topic two has five core sub-topics and one HL extension sub-topic.
3.1 Sources of finance - notes
Introduction

By the end of this section you should be able to:
- Evaluate the advantages and disadvantages of each type of finance
- Evaluate the appropriateness of a source of finance for a given situation
Sources of finance
 Firms need money. They need money to pay wages, to buy raw materials, to pay for promotional activities, to fund research and development and to enable them to invest in new machinery and equipment. All these different activities require different sources of finance. Some will be internal (from within the firm), and some external (from outside the firm).
Selecting the source
Choosing an appropriate source of finance is vital. Considerations when selecting a source of finance include:
- Cost: Business obviously prefer sources that are cheaper - administration or interest charges add to the cost e.g. share issue carry high administration charges but no interest.
- Use of funds: Revenue expenditure tends to be financed by short term finance, e.g. raw material purchases are financed by trade credit or overdraft. However, the purchase of property should be financed with long term sources such as share capital or a mortgage.
- Status and size: Small firms may be limited in their sources as they lack sufficient security. Large firms have access to many sources including a flotation on a stock market.
- Financial situation: Firms suffering from liquidity problems, or firms that already have significant loans, may face reluctance from lenders to provide funds. If lenders do agree to the loan, it is likely to be at higher interest rates.
- The external environment: Firms will need to aware of market trends and forecasts and research available sources of finance.
- Organisational goals: Is the business wishing to grow, and if so how? For example, expansion overseas may require substantial funds.
- Existing financial structure: Additional loans may have a negative effect on the balance sheet and financial ratios.
- Risk: The riskier the use of the funds the harder it will be to find a lender.
- Availability of security: Small firms may find it difficult to borrow large sums for long periods as they do not have sufficient assets of value to offer as security.

When answering an examination question about finance, the most important question when choosing a source is:
Does the source of finance match the need e.g. term?
If the need is long-term e.g. buying a property, then the source should be long-term e.g. a mortgage .... Not short term like an overdraft.
Do not mix up short-term needs with long-term sources or vice-versa
The need for finance
The source of finance needs to be related to its purpose. There are two types of expenditure:
Capital Expenditure

Capital expenditure
Capital expenditure is spending to acquire or upgrade physical assets such as buildings and machinery and not for operating expenses; also called capital spending or capital expense.

Revenue expenditure
Revenue expenditure is spending related to the day-to-day running of the business, e.g. administrative and selling expenses including raw materials, wages and salaries.
Capital expenditure is incurred when a business spends money either to buy fixed assets or to add to the value of an existing fixed asset.
Fixed assets are assets not intended for resale. They represent the productive capacity of the business and determine the scale of the business operations and provide the opportunity for the business to make profits or losses. Purchases of fixed assets are shown on the balance sheet and increase the value of the business.
Included in capital expenditures is spending on:
- acquiring fixed assets such as equipment, buildings, machinery and vehicles
- improving existing assets
- preparing an asset to be used in business
- restoring property or adapting it to a new or different use
- starting a new business
As fixed assets tend to be expensive, the finance used will be of a medium- to long-term nature. Capital spending is not usually charged to just one year's accounts, but is spread out of the life of the asset in the form of a depreciation charge to the profit and loss account.
Revenue expenditure refers to an operating expense incurred from the daily running of the organisation, such as staff wages, purchase of trading stock, rent of business premises, advertising and so on. It does not add to the value to the business. The expenditure needs to be matched against revenue in the same period as the revenue is earned. Revenue and expenditure are matched in the profit and loss account, but because it is short-term it will only affect one accounting period.
There are three categories of revenue expenditure:
- Single use consumables such as stationery, petrol for vehicles
- Purchase of items that will be used up within the current financial year e.g. raw materials
- Items that are used before they are paid for, e.g. marketing expenditure
Revenue expenditure is sometimes described as circulating capital. This description reflects the fact that the capital in question leaves the owner's possession to produce profit or loss. The capital may be considered as being 'turned over'. In the process of turning over, profit or loss ensues.
Forms of finance
Finance can be classified by the:
- type: equity (share capital) or debt (loans and mortgages)
- source: external or internal
- duration: permanent, short-, medium- or long-term
Type: equity or debt
There are two basic types of finance available to any business:
- Equity is share capital risked by the shareholders. As long as the business is a going concern, this capital is not repayable, so it is considered as permanent capital. If the business makes profit, the shareholders will receive a proportion of this in the form of a dividend. Dividend, however, is optional as it is decided by the board of directors, so in a bad year a nil dividend may be announced. Equity also includes profits that have retained in the business for the purpose of re-investment.
- Debt includes all forms of borrowing from sources external to the firm. These funds need to be repaid and lenders will expect a reward in the form of interest. Interest is a legal charge and must be paid before any profit is distributed. In a bad year, interest must still be paid.
The relationship between the value of loans and the value of equity is the firm's gearing ratio. If a higher proportion of finance comes from loans than equity the business is said to be highly geared.
Source of funds
Source of funds: Internal sources of finance
If you would prefer to view this interaction in a new web window, then please follow the link below:
An evaluation of internal sources of finance
Internal finance has no direct cost to the business and is relatively convenient. It does not normally increase the liabilities of the business. However, in the case of sale and leaseback, there will be leasing charges. Internal sources are limited and relying on these to finance growth would severely limit the pace and scale of expansion, because the finance would be restricted by the extent of the profits generated.
Source of funds: External sources of finance
If you would prefer to view this interaction in a new web window, then please follow the link below:
3.1 Sources of finance - questions
In this section are a series of questions on the topic - Sources of finance. The questions may include various types of questions. For example:
- Self-test questions - on-screen questions that give immediate marking and feedback
- Short-answer questions - a series of short-answer questions to help you check your understanding of the topic
- Case study - a case study with associated questions
- In the news - questions based around a topical business news article
Click on the right arrow at the top or bottom of the page to work through the questions.
Forms of finance - case study

Read the case material that follows, and then answer the questions.
Sherston Antiques
This company was founded five years ago by four partners. As an unincorporated business, it has grown slowly and steadily, and has developed a good reputation for the selling of old books. It is based just in one country and has 3 shops.
It is now at a major crossroads, and some major business decisions need to be taken soon by the partners, one of whom is approaching retirement age.
They have the opportunity of taking over a major competitor in the same area as they are in, but it will be expensive. They would need to raise $1 million. They have few loans at present, and could raise considerably more. It has been suggested, though, that this is the time for the firm to 'go public' and raise the money that way.
They have just been approached by the '3h' company, a venture capital organisation, with an offer to finance their expansion.
What should they do?

Questions
1. Explain the meaning of the terms:
- Unincorporated business
- Going public.
2. Discuss the additional sources of finance that would be available to Sherston Antiques if they went public.
3. Explain why the firm should aim for a balanced portfolio of finance sources rather than just one.
4. Discuss the advantages and disadvantages of using a venture capitalist to finance such an expansion.
Forms of finance - overdraft report
Write a report outlining whether or not you would consider a bank overdraft to be the most suitable form of short-term finance for a sole trader.
Forms of finance - sole trader report
David Merchant operates as a sole trader and is considering turning his business into a private limited company. He asks you to produce a report outlining the merits of such a move as well as the case for remaining as a sole trader, with your personal recommendation.
Forms of finance - short answer questions

Question 1
Explain the concept of sale and leaseback.
Question 2
Outline the reasons for a company raising capital from a variety of sources.
Question 3
Explain the difference between an ordinary share and a debenture.
Question 4
Explain why venture capital may be a deceptively dangerous source of finance.
Question 5
The capital that a firm needs may be raised from within the company (internally) or from outside of the firm (externally).
Look at the following list of possible sources of funds and decide if they are an internal (I) or external (E) sources. Be careful, some are not sources at all, but are uses of funds (U). Mark these as well.
| 1. Profits | [I] or [E] or [U] |
|---|---|
| 2. Overdrafts | [I] or [E] or [U] |
| 3. Bank loans | [I] or [E] or [U] |
| 4. Trade creditors | [I] or [E] or [U] |
| 5. Selling of unwanted assets | [I] or [E] or [U] |
| 6. Hire purchase | [I] or [E] or [U] |
| 7. Credit sales | [I] or [E] or [U] |
| 8. Taxation | [I] or [E] or [U] |
| 9. Debt factoring | [I] or [E] or [U] |
| 10. Sale of more shares to existing shareholders | [I] or [E] or [U] |
| 11. Dividends | [I] or [E] or [U] |
Tesco: sale and leaseback
Read the article Tesco funds more expansion abroad with $570m sale and leaseback deal and then have a go at the questions below. You can either read the article in the window below, or follow the previous link to open the article in a new window.

Tesco has a long history of using sale and leaseback as a source of finance to fund its global expansion programme. Read more from the articles below to help answer the questions.

Question 1
Define the terms 'sale and leaseback' and 'joint venture'.
Question 2
Explain why Tesco has chosen to enter a joint venture to sell and leaseback a number of their stores.
Question 3
Examine three other sources of finance that Tesco could have used instead of sale and leaseback to fund their international expansion plans.
Question 4
Discuss the advantages and disadvantages of using sale and leaseback to fund further international expansion for Tesco.

Extension activity:
With reference to the Ansoff's Matrix, analyse the strategic growth options that Tesco have chosen to pursue.
SouFun: Flotation IPO
Read the article SouFun sets eyes on $300 million flotation IPO and then have a go at the questions below. You can either read the article in the window below, or follow the previous link to open the article in a new window.

Read more about Global IPOs in the following article:
To support your answers, you may wish to review the Wikipedia article on an IPO

Question 1
Define the term Initial Public Offering.
Question 2
Explain how the funds raised from an IPO will be used by the SouFun.
Question 3
Explain the role of merchant banks, such as JP Morgan Chase, in an IPO.
Question 4
Analyse the advantages and disadvantages of a flotation.

Extension activity:
You may wish to investigate the following statement:
"The $30.5 billion that new issues raised globally in July was the most since November 2007".
See if you can find some other examples of recent IPOs and examine why there is a link between the popularity of IPOs and the business cycle.
3.2 Investment appraisal - notes
Introduction
In the previous section we looked at sources of finance and their suitability. We now move on to look at investment appraisal.

By the end of this section you should be able to:
- Calculate the payback period and ARR for an investment
- Analyse the results of the calculations

- Calculate the NPV for an investment
- Analyse the results of the calculations
Investment appraisal

Investment
Investment means postponing present consumption to increase future returns. In a business sense this will involve the purchase of capital equipment such as plant and machinery with the objective of increasing future output, sales revenue and profit.
In the next section we will be looking at investment appraisal. In essence, we will be looking at the question 'is it worth investing in that project?'
 Just like individuals, the finance available to firms is limited and so they must choose how to spend this finance in a way that offers the best return on their investment. This is not always an easy assessment because it is dependent upon the time period involved and the level of risk the firm is prepared to take.
A business may have a variety of investment decisions. They may have to choose between:
- Launching one product or another
- Between different locations for parts or whole of their business
- Buying one piece of equipment or another
Investment appraisal is a quantitative technique used to avoid relying on 'hunch' decision making. However, like all such business tools it must be remembered that the reliability of the outcome is only as good as the data used in the appraisal. As is often said, 'Garbage In, Garbage Out' (GIGO).
Investment appraisal requires two main pieces of information
- The capital cost of the project
- The value of the project (what cash will it bring in for the cost?)
Investment appraisal is a forward-looking process. It considers what might happen, and makes forecasts of financial returns. However, these forecasts will always contain elements of inaccuracy, uncertainty and risk and we will examine how different investment appraisal methods account for these elements.
Investment appraisal will not only be used to choose between one project and another, but also to rank the investments in terms of financial returns. Just like other tools in the business and management toolbox, it is likely that investment appraisal will be used in combination with other tools to provide a broader analysis. Non-financial information may be just as important in the decision making as financial outcomes. It may be the best financial decision to locate in a remote area of the world, but how will employees and customers react?
Investment appraisal
Investment appraisal is built around estimates of future cash flows - cash flow into and out of the company as a result of a particular investment project.
These are almost certainly not entirely accurate. The capital cost will not really be known until it is actually done. Plus or minus 5% would be a good level of accuracy from a good, experienced project team. Cash inflows are also notoriously hard to predict with any accuracy.
Cash outflow
This is all the costs of the project. It will be built up by the 'Projects Department', often using a series of sub-estimates that are aggregated to get the overall cost.

Follow the link below to see an example of a possible project cost pro-forma.
Project cost pro-forma
Every effort is made to cover all items that may be required. Note the inclusion in the above proforma of the words 'Contingencies'. What are they, and why are they needed?
Cash inflow
This is the estimate of the value of the project. It is expressed in terms of net cash inflow.

Net cash inflow
Net cash flow is the additional cash a project will generate (sales revenue or cost savings) less annual costs incurred in processes such as the manufacture and sale of a product.
The heart of the forecast of net cash inflow is the sales forecast produced by the marketing department. This may possibly be inaccurate as it is a forecast. This inaccuracy may be magnified if there are also problems with the cost side of net cash inflow.

Follow the link below to see an example of a possible net cash flow pro-forma.
Net cash flow pro-forma
Notice that it is a cash flow forecast, not a profit forecast. We are concerned with real money here.
Cash inflows often tend to be overestimated. Brand managers who have committed themselves to their new product are rarely pessimistic about sales or they may do themselves out of a job! Marketing people tend to be optimists - the product will sell well - so the sales forecast will probably be an overestimate of the real situation.
Reasons for this inaccuracy are:
- Firms do not work in a vacuum. They cannot predict accurately the actions of the competition, the development of the market, changes in consumer taste, and changes in the economy and government regulation.
- Firms cannot always accurately predict the prices of materials or the cost of labour in advance. These prices may fluctuate daily.
- The weather may be very unseasonable and cause sales to be different to the forecast.
- Some other items, such as agricultural products are difficult to predict in advance.
August 2010
A severe drought destroyed one-fifth of the wheat crop in Russia, one of the world's largest exporters. The majority of the damage to Russia's wheat crop has been caused by the drought, one of the worst in decades as much of the country suffers through the hottest summer since record-keeping began 130 years ago. But in recent days, wildfires raging through much of western Russia have spread and there are fears that more fields will be lost.
Expectations that Russia will slash exports by at least 30 percent have sent wheat prices soaring. "Russia has become the price-maker on the market," said Dmitry Rylko, director general of the Institute for Agricultural Market Studies, who says he expects minimal exports.
Wheat prices on the Chicago Board of Trade surged in July by 42 percent, the biggest monthly gain in more than a half century, and are now the highest they have been in nearly two years. With no immediate end in sight for the drought in Russia, analysts expect prices to continue to rally.
Thus there is a considerable element of risk when cost figures are used; which is another reason to ensure a contingency is included in the budget. The results of investment appraisal need to be considered in the light of uncertainty in the market, the reliability of the source and the quality of the data involved. An allowance should be made for the risk element.
Investment appraisal issues
The basis of investment appraisal is the cost and cash flow estimates. We will now see how we can use them to come to a judgement about an investment project.
The basic requirements of investment appraisal are:
- An estimate of what the project will cost. This is the capital investment.
- An estimate of what the project will earn the firm. This is called the forecast of net cash inflow.
These are both estimates, and may well be inaccurate. As we have discussed, the cost estimate may to be too low (forecast is fraught with problems), so costs may well only become apparent during the project. The net cash inflow, which is based on a sales forecast for the product, will possibly be too high (marketing people are optimists and are not known for producing under-estimates). As a result, any estimate of the value of a project is likely to be too high.
Investment appraisal techniques
Investment appraisal methods divide into two groups:
- Simple, easy to calculate methods. They are not very accurate or sensitive, but are good for screening out poor projects from a long list. All projects should be subjected to these tests. These screening tests are
- Payback period
- Average rate of return (ARR)
- Detailed and more accurate tests. If a project passes through the initial screening, then in larger businesses, which can afford the cost, the project may be it is subjected to more complex tests are based on discounted cash flow methods. They are:
- Discounted cash flow (DCF)
- Net present value (NPV)
We will look at all these tests in turn using a single example.

Investment appraisal example
Student Computers plc is trying to decide between two expansion projects. It has the following data available from the projects department. All units are $000's.
Project A has a capital cost (in year 0) of $400k
Project B has a capital cost (in year 0) of $700k
| Net cash inflow ($000) | ||
|---|---|---|
| Project A | Project B | |
| 50 | Year 1 | 100 |
| 100 | Year 2 | 300 |
| 150 | Year 3 | 500 |
| 200 | Year 4 | 300 |
| 100 | Year 5 | 200 |
Which project is best, or should Student Computers decide to do neither?
Payback period

Payback period
Payback period is a method of investment appraisal that estimates the time period taken to recover the initial cash outlay on an investment. Although simplistic it is the most popular method of investment decision making.
This technique is not a measure of profitability, but more a measure of short-term risk. Long payback periods indicate a high risk, short ones a low risk.
Cumulative cash flow method of payback
Cumulative cash flow
Cumulative data is generated by adding up consecutive numbers within a series. So with project A the annual returns are:
| Project A ($000) |
|---|
| 50 |
| 100 |
| 150 |
| 200 |
| 100 |
So the cumulative returns at the end of each year are:
| Year | Cumulative ($000) |
| 1 | 50 |
| 2 | 150 (50 + 100) |
| 3 | 300 (50 + 100 + 150) |
| 4 | 500 (50 + 100 + 150 + 200) |
| 5 | 600 (50 + 100 + 150 + 200 + 100) |
Payback period method - convert the net cash flow data to cumulative net cash flow and to find the time when cumulative net cash flow is the same as the capital cost. In other words when the project repays the capital cost.
| Project A | Project B | |||
|---|---|---|---|---|
| Cost: 400 | Payback reached? | Capital cost ($000) | Cost: 700 | Payback reached? |
| Cumulative net cash inflow ($000) | ||||
| 50 | No | Year 1 | 100 | No |
| 150 | No | Year 2 | 400 | No |
| 300 | No | Year 3 | 900 | Yes |
| 500 | Yes | Year 4 | 1200 | |
| 600 | Year 5 | 1400 |
The cost of project A has been covered by the end of year 4, and the Project B covered by the end of year 3. But this is not as accurate as we require. We need to know when the payback occurs within the year.
Project A pays back between 3 and 4 years. At the end of the third year Student Computers need an additional $100 000 to payback their investment. A total of $200 000 in cash inflows are expected in the fourth year, so:
Payback period = 3 + 100/200 = 3.5 years (i.e. 3 years and 6 months)
Project B pays back between years 2 and 3. At the end of the second year, Student computers need an additional $300 000 to payback their investment. A total of $500 000 in cash inflows are expected in the third year, so:
Payback period = 2 + 300/500 = 2.6 years (i.e. 2 years and 7.2 months)
Firms will often set a criterion level or screening test in advance for undertaking a project. For instance Student Computers may state that only projects paying back within 3 years will be undertaken. In this case only Project B would be acceptable. However, they may set a payback period as 5 years, in which case both projects fulfil the investment criterion. Then it is a choice between the two.
Clearly on a financial basis, Project B is preferable as it pays back the quickest. However, other factors may now be considered, such as non-financial issues or liquidity issues. It may be that the firm's cash flow is poor, so it is important to select the project that pays back the quickest even if other factors suggest it is not the best in the long-run.
Benefits of payback method
- Easy to calculate and understand
- Includes the cost of the investment
- Focuses on short-term cash flow and is appropriate for equipment with a relatively short life
Limitations of payback period
- Not a measure of profit.
- Ignores all cash flows after the payback point.
- Ignores the pattern of cash flow.
- Ignores the 'time value' of money.
- Encourages a short-term view of investment

Follow the link below to see a numerical example of these problems.
Payback period - problems
The payback period can also be calculated without using the cumulative method by the following formula:
![]()

Initial investment = 3000
monthly contribution = 300
Payback 9000/300 = 30 months or 2 years 6 months
This method is not normally used in IB examinations and would only work if the net cash inflow was constant.
Average rate of return (ARR)
The average rate of return (ARR), or accounting rate of return, method of investment appraisal measures the annual income of a project as a percentage of the total investment cost, which is something that simple payback does not do. This is a measure of average profit, and is expressed in a familiar percentage form. It is also a relatively straightforward method and the result can be compared with returns from alternative uses of funds and with the base bank interest rate.
As with payback, it is likely that the firm will establish an investment criterion. For example, the firm may decide that any project with an ARR of less than 5% will not be considered.
ARR - The three main steps
The ARR measures the net return each year as a percentage of the initial cost of the investment.
![]()

EXAMPLE: Three projects have the following costs and expected income:
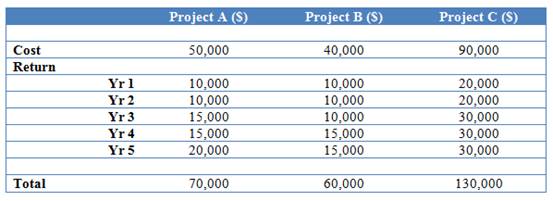
STEP 1. Calculate the total net profit from each project by subtracting the total return of the project from its cost.
![]()
STEP 2. Calculate the net profit per annum by dividing the total net profit by the number of years the project runs for.
![]()
STEP 3. Calculate the ARR using the following formula:
![]()

Calculate the ARR for the projects B and C.

Follow the link below if you need to look again at the example figures.
Student Computers - investment appraisal example
| Project | A | B |
|---|---|---|
| Total gain (sum of each years cash inflow) | 600 | 1400 |
| Less: capital cost | (400) | (700) |
| Total net gain | 200 | 700 |
| Years | 5 | 5 |
| Average net gain | 200/5 = 40 | 700/5 = 140 |
| ARR (as % of initial investment) | 40/400 = 10% | 140/700 = 20% |
This is a measure of profit, and project B seems to be preferable here as well.
Benefits of ARR
- Measures profitability
- Uses all the cash flows
- Easy to understand
- Easy to compare percentage returns with other investment opportunities
Limitations of ARR
- Ignores the pattern of cash flow - when they occur
- Later cash flows are unlikely to be accurate as they are longer term forecasts
- The length of the project or the life span of a machine maybe an estimate
- Ignores the timing of cash flows
- Ignores the 'time value' of money
- Ignores the risk factors associated with a long payback period on liquidity

Follow the link below to see a numerical example of these problems.
ARR - problems
So, with all of the problems associated with these methods of analysis, what are they used for? They are simple and quick to prepare, and are used as screens or sieves to weed out poor, or useless, projects. Firms have to set themselves 'action standards' for payback and ARR, say 3 years maximum and 15% minimum, and only if these are met and/or exceeded will a project 'pass' to be examined by the more complex discounted cash flow method. Action standards are selected by the firm concerned to reflect their view of the future and individual requirements. You will be given them in an exam if they are appropriate.
So in our example (Student Computers) project A has failed; project B has passed. Project B now has to be evaluated allowing for the 'time value' of money.

Click on the right arrow at the top or bottom of the page to move on to the next page.
Discounted cash flow (DCF) & Net present value (NPV)

Discounted cash flow (DCF)
Discounted cash flow (DCF) analysis is a method of valuing a project, company, or asset using the concepts of the time value of money. DCF is used to calculate the value of future cash flows in terms of an equivalent value today. All future cash flows are estimated and discounted to give their present values (PVs).
 What is the time value of money?
When you were younger, you probably looked at compound interest in mathematics and were asked some simple questions such as,
If you had $100 and put it in the bank at 10% interest how much would you have at the end of:
Year 1?
Year 2?
Year 3? and so on...
The answers are:
Year 1 $110 ($100 + $100 x 10 per cent) or ($100 x 1.1).
Year 2 $121 ($110 + $110 x 10 per cent) or ($110 x 1.1).
Year 3 $133.1 ($121 + $121 x 10 per cent) or ($121 x 1.1).
N.B. Multiplying by 1.1 is the same as working out 110%.
Why is it called compound interest? The reason is that you will get 10% interest on your original $100 deposit (the principal) plus you also get 10% interest on any previous interest. So in the case of year 2 to year 3, you will receive 10% on your original $100 (which is $10) plus an additional 10% on your $21 interest (which is $2.1). So in total you receive $12.1 interest. Add that to your $121 and you get $133.1.

Compound interest
Compound interest is interest which is calculated not only on the initial principal, but also the accumulated interest of prior periods. Compound interest differs from simple interest in that simple interest is calculated solely as a percentage of the principal sum.
Therefore, it can be asked what $110 earned in one year's time is worth today (the Present Value or PV) if the interest rate is 10%. One way of thinking of this is reverse compound interest. The answer is obviously $100 as this could have been invested a year ago at 10 per cent to earn $10 in interest giving $110. Therefore $100 is worth the same as $110 received in a year's time or $121 received in two years' time. This indicates the time value of money
Discounted Cash Flow (DCF) deals with the two problems of interest rates and time. The return on an investment project is always in the future, usually over a period of several years. Money earned or paid in the future is worth less today, because of the concept of reversecompound interest:
We have already seen that, $100 is worth the same as $110 received in a year's time or $121 received in two years' time. This indicates the time value of money. So the Present Value or PV of $110 received in a year's time is $100 as this could have been invested today at 10 per cent to earn $10 in interest giving $110 at the end of the year. $100 today is therefore exactly the same in financial terms as $110 received at the end of the year. By now you should be getting the point!
Therefore, if a business wishes to compare two possible investments, which deliver different returns in the future, it is impossible to compare the relative merits unless the business can compare 'like with like'. To achieve this, all future returns must be converted into present values (PV). This can be achieved by discounting future returns.
To evaluate the worth of an investment we will then need to calculate the Net Present Value:

Net Present Value
The Net Present Value (NPV) of a project is the return on the investment (the sum of the discounted cash flows) less the cost of the investment.
If the NPV is larger than the initial cost (positive NPV), then the firm will see a return on its money. If it is less than the initial cost (negative NPV) then the project is not worth pursuing.

An investment project costing $100,000 yields an expected stream of income over a three year period of:
Year 1 - $30,000
Year 2 - $40,000
Year 3 - $50,000
If the interest rate is 10%, the discount values (present values) can be calculated using the technique below:
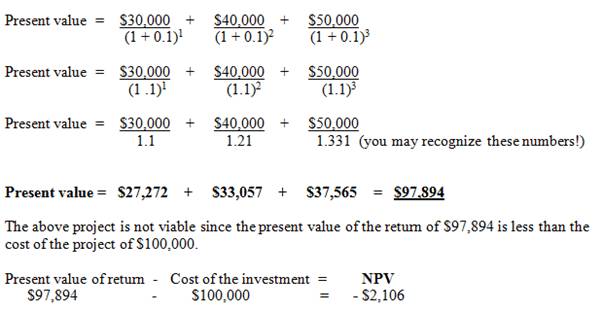
The firm will be losing money on the investment (a negative NPV), so should not undertake it.
Fortunately, it is not necessary to carry out these discount factor calculations as tables of discounted values at different interest rates can be used and should be included with the examination paper (unless the examination board forgets to do so, which can happen!). The example above shows you how the discount factors are worked out.
The extract of a table below shows the present value of $1 receivable for a 6 year period at an interest rate of 5% per cent (rounded to two decimal places).
Present value of $1 receivable at the end of 6 years at 5 per cent
| After | 1 yr | 2 yrs | 3yrs | 4 yrs | 5 yrs | 6 yrs |
|---|---|---|---|---|---|---|
| Present value of $1 | $0.95 | $0.90 | $0.86 | $0.82 | $0.78 | $0.75 |
| Discount factor | 0.95* | 0.90 | 0.86 | 0.82 | 0.78 | 0.75 |
Therefore, it is possible to calculate the present values of the yields from previously used example using the correct discount factor from the table:
| Present value of income in year 1 | = | $30,000 | x | 0.95* | = | $28,500 |
|---|---|---|---|---|---|---|
| Present value of income in year 2 | = | $40,000 | x | 0.90 | = | $36,000 |
| Present value of income in year 3 | = | $50,000 | x | 0.86 | = | $43,000 |
| Total present value of all income | = | $107,500 |
This investment is now viable as the Total Present Value ($107,500) is greater than the cost ($100,000). The NPV, therefore, is $7,500.
Worked Example: Net present value (NPV)
Our company - Student Computers - wants a minimum return on its investment of 15%, after allowing for the time value of money. We can work out what Project B is worth in terms of today's money using the discount factors below.
| Discount rate 15% |
|---|
| Year in future | 1 | 2 | 3 | 4 | 5 |
|---|---|---|---|---|---|
| Discount factor (f) | 0.870 | 0.756 | 0.658 | 0.572 | 0.497 |
The project has a capital cost of $700k and the net cash inflow for each year will be:
Cash inflow for year x discount factor (for year)
| Year | Cash inflow | Discount factor | Net cash inflow |
|---|---|---|---|
| 1 | 100,000 | 0.870 | 87,000 |
| 2 | 300,000 | 0.756 | 226,800 |
| 3 | 500,000 | 0.658 | 329,000 |
| 4 | 300,000 | 0.572 | 171,600 |
| 5 | 200,000 | 0.497 | 99,400 |
| Total cash inflow | $ 913,800 |
The project is worth $913.8k in today's money, but costs only $700k. This means that it has a net present value (NPV) of +$213.8k.
i.e. $913.8 - $700k = + $ 213.8k
This means that the project should bring in more money than simply investing the $700k in the bank at a rate of 15%.
Note how NPV is written as + or - , $ , number. You must give the sign (+/-) and the money unit as well as the number itself. Do not forget the thousands if they are there.
Interpretation of NPV
- NPV is positive: The project earns more than the discount rate. The project has 'passed' this test, and may be considered further.
- NPV is zero: The project earns exactly the discount rate. It may or may not be rejected.
- NPV is negative: The project earns less than the discount rate. The project will be rejected.
Benefits of Discounting/NPV
- Considers all cash flows
- Accounts for the time value of money and therefore considers the opportunity cost
- It is more scientific than the other methods
Limitations of NPV
- Complex to calculate
- Only as good as the original data. If the estimates of cost or net cash inflows are wrong, so will be the NPV
- The selection of the discount factor is crucial, but it is mostly guesswork as this rate is constantly changing
- NPV's look deceptively accurate
- Ignores all and any non-financial factors.

1 |
Average rate of returnThe average rate of return for a project gives you: |
2 |
Discounted cash flowDiscounted cash flow methods of investment appraisal |

The time value of money

1. The dollar and time
Look at the following data:
| Year | 1963 | 2009 |
|---|---|---|
| New honours graduate salary | $800 per year | $50,000 per year |
| 3 bedroom house | $2,825 | $400,000 |
| Small car | $400 | $10,000 |
All monies are in dollars, but they clearly do not have the same value. The $ in 1963 was worth more than the one today. So a $ today is worth more than a $ tomorrow; a demonstration of the time value of money.
This approach is general, not specific or numerate. That is where discount tables come in.
2. Discount tables
Imagine that you invest $100 at 10% per annum, compounded annually. Your deposit would grow.
| Year | 0 | 1 | 2 | 3 | 4 | 5 | 6 |
|---|---|---|---|---|---|---|---|
| Value | 100 | 110 | 121 | 133 | 146 | 160 | 176 |
This is the future value of a $ today at 10%. We can turn this round and look at the present value of a $ earned in the future. It is the reciprocal of the numbers above.
Present value of $1 earned in the future.
| Year | 0 | 1 | 2 | 3 | 4 | 5 | 6 |
|---|---|---|---|---|---|---|---|
| Present value | 1.000 | 0.909 | 0.826 | 0.75 | 0.684 | 0.625 | 0.568 |
This tells us that a $ received in 3 years time is worth the same as 75 cents today at 10% rate of interest.
Do the same thing for an interest rate of 20% and we get:
| Year | 0 | 1 | 2 | 3 | 4 | 5 | 6 |
|---|---|---|---|---|---|---|---|
| Future value | 100 | 120 | 144 | 173 | 207 | 249 | 299 |
| Present value | 1.000 | 0.833 | 0.694 | 0.578 | 0.483 | 0.401 | 0.334 |
The higher the interest rate, the less money is worth received in the future.
For interest rate, read discount rate and you have the discount tables.

Residual values

 The residual value of any investment is the scrap value of any plant etc. at the end of its life. This does not reduce the cost of a project, it simply gives another cash inflow in the year when the item is sold.
What effect does a residual value have on our tests?
- Payback period - none at all, since the money comes after the payback point.
- Average rate of return - will increase the 'gain' and hence the 'net gain'. The return will increase if the number of years is not adjusted.
- NPV - little change, unless the residual value is very high. Discount factor will be low since the money only comes in after the project is over.

Investment appraisal - qualitative factors
We have examined the numerical methods of performing investment appraisal. It is vital, however, that you appreciate that this is an aid to decision-making, not a decision maker in itself. People make decisions and have to take into consideration a wide range of non-financial factors. By definition, non-financial factors cannot be taken into account when doing payback periods, average rates of return and net present values.
What are these non-financial factors?
They can be summarised under the headings of:
- Personnel
- Objectives
- Image
- Risk
Let's examine each of these in more detail.
- Personnel factors - numerical measures cannot account for the availability of skills, effect of redundancy and concerns about relocation. It cannot account either, for the personal preferences of Directors and Managers.
- Objectives - firms have to set action standards. These should reflect likely external changes such as interest rate trends, inflation trend and the change in the economy. People who have individual objectives also set them. Whether the firm wants high or low returns, if it after short-term or long-term gains is a matter of personal decision, not numerical fact. A good project may be turned down for short-term, non-financial reasons. Corporate objectives may overtake financial figures and information.
- Image - decisions are taken often so as to maintain or improve the image of the company in the eyes of some or all of the stakeholders.
- Risk - risk management is important, but difficult to enumerate. Degrees of risk are hard to decide, and may be more a matter of opinion than fact. Allowance for risk may lead to high action standards being set.
3.2 Investment appraisal - questions
In this section are a series of questions on the topic - Investment appraisal. The questions may include various types of questions. For example:
- Self-test questions - on-screen questions that give immediate marking and feedback
- Short-answer questions - a series of short-answer questions to help you check your understanding of the topic
- Case study - a case study with associated questions
- In the news - questions based around a topical business news article
Click on the right arrow at the top or bottom of the page to work through the questions.
Payback & ARR - self-test questions

Why not have a go at the following examples to see how well you have understood the calculation of payback and ARR?
A firm has to choose between two possible projects and the details of each project are as follows:
| Capital cost | $000 |
|---|---|
| Project A | 300 |
| Project B | 500 |
| Project C | 450 |
| Net cash inflow ($000) | |||
|---|---|---|---|
| Project A | Project B | Project C | |
| Year 1 | 75 | 100 | 50 |
| Year 2 | 125 | 200 | 75 |
| Year 3 | 125 | 300 | 250 |
| Year 4 | 100 | 300 | 300 |
| Year 5 | 75 | 150 | 200 |
1 |
2 |
3 |
4 |
5 |
6 |
7 |
Discounted cash flow - self-test questions


Why not have a go at the following examples to see how well you have understood the calculation of discounted cash flow and net present value?
A firm has to choose between three possible projects and the details of each project are as follows:
| Capital cost | $000 |
|---|---|
| Project A | 300 |
| Project B | 500 |
| Project C | 450 |
| Net cash inflow ($000) | |||
|---|---|---|---|
| Project A | Project B | Project C | |
| Year 1 | 75 | 100 | 50 |
| Year 2 | 125 | 200 | 75 |
| Year 3 | 125 | 300 | 250 |
| Year 4 | 100 | 300 | 300 |
| Year 5 | 75 | 150 | 200 |
Assume a discount rate of 8%. The discount factors for this are given in the table below.
| Discount factors 8% | |
|---|---|
| Year 1 | 0.926 |
| Year 2 | 0.857 |
| Year 3 | 0.794 |
| Year 4 | 0.735 |
| Year 5 | 0.681 |
1 |
2 |
3 |

Inv. appraisal techniques - short answer questions


Question 1
Define the term 'screening test' (or 'criterion level').
Question 2
Explain the term 'time value of money'.
Question 3
Explain what a net present value (NPV) of +$256 at a 20% discount factor tells you about a project.
Question 4
Outline how a residual value affects the average rate of return.
Question 5
Explain the meaning of the payback period for an investment and why this might be considered a measure of risk rather than profitability.

Quantitative factors - numerical questions (1)


Question 1
A company is faced with the choice between two projects X and Y. The cost information for the two projects is summarised below.
| X | Project | Y |
|---|---|---|
| 600 | Capital cost ($000) | 900 |
| Net cash inflow ($000) | ||
| 50 | Year 1 | 150 |
| 100 | Year 2 | 300 |
| 300 | Year 3 | 500 |
| 300 | Year 4 | 300 |
| 200 | Year 5 | 250 |
| 50 | Year 6 | 100 |
N.B. There are no residual values
(i) For each project determine the payback period and the average rate of return.
The firm has a screening tests of a maximum of 3.0 years for payback period and 12 % as the minimum rate for the average rate of return.
(ii) Explain the meaning of the term 'screening test'.
The firm has a company screening test of 10% for all projects after adjustment for the time value of money.
(iii) Explain the term 'time value of money.
(iv) Calculate the net present value for the best project found in i). Does this meet the firm's screening test?
Use the following discount factors (10% discount rate):
Year 1 0.909
Year 2 0.826
Year 3 0.751
Year 4 0.683
Year 5 0.621
Year 6 0.564
Question 2
Hertford Chemicals plc
Hertford Chemicals plc is considering investing in a new chemical processing plant, but has the choice of manufacturing one of two products on it. The firm requires a minimum return of 20% on any capital expenditure. Details of the two proposals are summarised below:
| Project A | Initial capital cost | Project B |
|---|---|---|
| $200,000 | $250,000 | |
| Net cash inflows | ||
| $50,000 | Year 1 | $20,000 |
| $100,000 | Year 2 | $150,000 |
| $200,000 | Year 3 | $250,000 |
| $200,000 | Year 4 | $100,000 |
| $100,000 | Year 5 | $150,000 |
(a) Calculate the payback period, average rate of return and the net present value for the two projects.
Use the following discount factors (20% discount rate):
Year 1 0.833
Year 2 0.694
Year 3 0.579
Year 4 0.482
Year 5 0.402
(b) On the basis of these measures only, which project would you recommend?
(c) What other factors, other than quantitative/financial factors, should you take into consideration when deciding between projects?

Quantitative factors - numerical questions (2)


Question 1
The manager of O'Neill Biochemical Ltd is considering relocation of the processing facilities. He has narrowed down the choices to two options. Data relevant for this decision is as follows:
Location A
This location is in Michigan and, although a cheaper option, there would be higher operating costs due to the higher wages that would need to be offered to recruit suitable workers. The capital cost of plant A is $5 million.
Location B
This location is in Houston would be very near transport links, which would save the firm money, but the site is relatively expensive. The capital cost of plant B is $10 million.
Forecast information for each of the plants was produced as follows:
| Location A | Location A | Location B | Location B | |
|---|---|---|---|---|
| Revenue receipts | Operating payments | Revenue receipts | Operating payments | |
| $ million | $ million | $ million | $ million | |
| Year 1 | 7.3 | 4.0 | 7.3 | 2.7 |
| Year 2 | 7.5 | 5.2 | 7.5 | 3.3 |
| Year 3 | 9.1 | 5.3 | 9.1 | 4.6 |
| Year 4 | 9.8 | 6.5 | 9.8 | 5.5 |
| Year 5 | 11.2 | 8.1 | 11.2 | 6.4 |
Additional information:
- A modification to the plant at location B to treat the pollution would need an extra capital cost of $2 million. In addition, operating payments would increase in each year by $400,000.
- The company's cost of capital is 10% per annum.
- The following extract is from the present value table for $1 at 10% per annum.
| Year 1 | 0.909 |
|---|---|
| Year 2 | 0.826 |
| Year 3 | 0.751 |
| Year 4 | 0.683 |
| Year 5 | 0.621 |
Required
Produce net present value calculations for the locations A and B. For Location B provide figures both for the plant in its basic form and also with the modifications to treat pollution.
Question 2
Flanders Ltd is trying to decide which project should be taken up, out of three possible investments. The initial investment would amount to $40,000. Scrap value at the end of use would be nil.
The cost of capital is 9%, for which discount factors are as follows:
| Year | Present value of $1 |
|---|---|
| 1 | 0.917 |
| 2 | 0.842 |
| 3 | 0.772 |
| 4 | 0.708 |
| 5 | 0.650 |
The net cash inflows from the three projects under consideration are:
| XC1 | VB93 | IPR2 | |
|---|---|---|---|
| $ | $ | $ | |
| Year 1 | 5,000 | 14,000 | 11,000 |
| Year 2 | 8,000 | 16,000 | 12,000 |
| Year 3 | 6,000 | 21,000 | 13,000 |
| Year 4 | 12,000 | - | 14,000 |
| Year 5 | 18,000 | - | - |
Required
For each possible project you are required to calculate:
(i) Payback
(ii) Net present value

Investment appraisal - quantitative factors - numerical questions 2

Question 1
Wells Ltd is considering extending its operations into the production and sale of components used in the making of lawnmowers. The components cost $7 to manufacture and would be sold on to the lawnmower manufacturer for $12. A new machine will be needed costing $10,000 which is payable on 1 January in Year 1.
The expected sales of these are as follows:
| Units | |
|---|---|
| Year 1 | 600 |
| Year 2 | 650 |
| Year 3 | 720 |
| Year 4 | 800 |
| Year 5 | 850 |
The cost of capital is 10%.
The following is an extract from the present value table for a cost of capital of 10%:
| 10% | |
|---|---|
| Year 1 | 0.909 |
| Year 2 | 0.826 |
| Year 3 | 0.751 |
| Year 4 | 0.683 |
| Year 5 | 0.621 |
It is assumed that revenues are received and costs are paid off at the end of each year.
It is assumed that everything produced is sold
(a) Calculate the annual net cash flows for each year, which are expected to result from the purchase of the machine.
(b) Using the expected annual net cash flows, calculate the net present value for the machine.
Question 2
The assembly machine of Tahoulan Ltd could be replaced. The replacement machine will cost $400,000, which is payable on 1 January in Year 1. The new machine will be able to assemble 24,000 units a year. However, this is expected to rise by 25% from the start of year 4.
The cost of capital is 10%.
- The following is an extract from the present value table for a cost of capital of 10%:
| 10% | |
|---|---|
| Year 1 | 0.909 |
| Year 2 | 0.826 |
| Year 3 | 0.751 |
| Year 4 | 0.683 |
| Year 5 | 0.621 |
- It is assumed that revenues are received and costs are paid off at the end of each year.
- It is assumed that everything produced is sold
- Each unit of production costs $25 to manufacture, but will rise to $32 in year 3 and $35 in year 4 onwards.
- Each unit is expected to sell for $35 in years 1 and 2 rising by 10% (compound) in years 3 and 4, thereafter remaining constant.
Should the assembly machine be replaced?

3.3 Working capital - notes
In the previous section we looked at sources of finance and their suitability and used different methods of investment appraisal. We now move on to look at working capital and the preparation of cash flow forecasts.

By the end of this section you should be able to:
- Define working capital and explain the working capital cycle
- Prepare a cash-flow forecast from given information
- Evaluate strategies for dealing with liquidity problems
Working capital

Working capital
Working capital is the day-to-day finance for running a business and is used to measure a firm's ability to meet current obligations, such as the payment of wages, electricity and rent. A high level of working capital indicates significant liquidity. It is also called net current assets or net working capital.
Every business needs money, cash, to keep it operating. Money is the lifeblood of business to meet day-to-day expenses and to pay bills, as and when they come due. If key bills, such as those for rent and energy are left unpaid, the firm may be declared insolvent. Indeed, a lack of cash, rather than insufficient profit, is the main reason for business failure.
Working capital is calculated by using the formula:
![]()
Current Assets are assets that are intended to be turned into cash within the present financial year. Typically current assets comprise stock, debtors and cash.
- Stock is the least liquid of current assets. It comprises of stocks of raw materials (components), semi-processed goods (work in progress) and finished goods. In some countries stock is called inventory.
- Debtors are people or organisations that owe money to the business as the result of buying goods or services on credit. It is an asset, because the firm should eventually receive payment.
- Cash is the most liquid asset. It is held in the organisation or in the bank (cash-in-hand or cash-at-the-bank). All other assets are measured against it to define liquidity.
Current Liabilities are anything owed by the organisation, which is likely to be paid within the present financial year. Typically current liabilities comprise an overdraft, creditors, dividends and unpaid tax.
- An overdraft is a facility given to an organisation that allows it to raise short term finance by having a negative balance on its accounts up to an agreed limit. In essence it is a short term bank loan.
- Creditors are suppliers to whom the organisation owes money because it has bought goods and services on credit.
- Dividends are a share of the profits due to shareholders as a reward for purchasing shares, but have not yet been paid.
- Tax may be owed to the government for a variety of reasons, such as a percentage of profits.
Having too much working capital can be considered a problem, because there is an opportunity cost associated with surplus working capital tied up in stocks, debtors and cash. Current assets, such as cash, could have earned returns elsewhere in the business. For instance, cash could be invested in new fixed assets which would generate future sales. So there is a balance to be made between too many, and too few, liquid assets.

Do you know the difference between bankruptcy and voluntary liquidation? This money for the day-to-day operation of a business, and its survival, is known as working capital. Working capital control is vital to the survival of businesses.
Working capital cycle
The accounting definition of working capital is:
Working capital = Current assets - current liabilities
Stock + debtors + cash
minus
Creditors + overdrafts + short-term loans
There is, in most businesses, a significant delay between paying out for the raw materials and labour required to produce the goods or services and the receipt of cash from the sale of the goods. This means that for most businesses their working capital (their net current assets) needs to be very carefully managed.
If you would prefer to view this interaction in a new web window, then please follow the link below:
Cash flow forecasts
We will look at this section in two parts. By way of introduction to the notion of cash and cash flow we will first look at the difference between profit and cash. People always tend to assume that they are the same, but they are far from it. Both are vital to a business, but for different reasons. Then we will look at how businesses can use cash flow forecasts to help them plan for the future and ensure they have enough cash to meet their obligations.
Profit and cash
Profit is the positive difference between a firm's sale's revenue and its total costs of production. The fact that a company is profitable does not guarantee it will be solvent. A profitable company may run out of cash. Why?
It is often assumed that at the end of the year, a sum equal to the firm's profit, is in the bank account able to be used to pay bills or fund expansion. In reality, it is more likely that profits will be tied up in some other area of the firm and will be in some other form of asset rather than cash.
It is possible for a firm to be profitable, but also be short of cash because:
- Many sales are on credit. They will be counted in the firm's profits, but the cash may not appear for months.
- The firm may have invested heavily in capital items. The cost of these assets may impact heavily on the firm's cash position.
- The firm may have invested in stocks. The cash outflow occurs when they are bought.
- Some items are paid for in advance, but do not appear as a cost until much later.

In the 1980s, Body Shop was expanding rapidly through the use of franchising. Every new franchise required training, new equipment, marketing and supplying. Body Shop was very profitable, but suffered a cash flow/liquidity problem as much of its cash became tied up in new franchises.
Bowater Scott, a paper manufacturer was making heavy losses. It decided to sell some of its loss-making divisions. The sale resulted in Bowater Scott having a large pile of cash, despite its losses.

Cash is not the same as profit. A firm may be making losses, but is 'cash rich' or alternatively may be very profitable, but suffering from liquidity problems.
Cash flow forecasts
Firms usually exist to make a profit. However, it is also important for firms to monitor their cash flow position, otherwise they may not be able to pay their bills, supplier costs or wages. If they do not pay these they may be faced with closure.
It is vital, therefore for managers to track their cash flow position.

A cash flow forecast
A cash flow forecast is an estimate of the timing and amounts of cash inflows and outflows into an organisation over a specific period, usually one year.
A cash forecast contains three main elements:
- Cash inflows may arise from cash sales, debtors paying what they owe, interest received, bank loans, rent payments and disposal of assets.
- Cash outflows occur when the organisation pays its creditors, makes cash purchases, buys assets, pays taxes, wages and rent and any other cash outgoing for business expenses. Not all of these pass through the profit and loss account.
- Net cash flow is the difference between cash inflows and cash outflows. Ideally this should be positive, although organisations can survive negative cash flows if it can find cash from other sources, such as an additional bank overdraft.

A positive cash flow is not profit and a negative cash flow is not a loss. Do not use these terms interchangeably.
A profitable business may run out of cash - this is called insolvency. This could be the result of selling output with too long a credit period or tying up funds in new assets. According to the UK Department of Trade and Industry more business failures result from lack of cash than any other reason. This is particularly true for new businesses. Too little cash can result in the following problems:
- Non payment of suppliers
- Discounts lost for late payment of bills
- Wages and salaries may not be paid on time, causing poor motivation, high labour turnover, absenteeism and industrial unrest
- New capital assets cannot be afforded
- Tax cannot be paid.
Managing cash flow.
To manage cash, a firm will need to assess:
- The size and timing of cash flows into the business
- The size and timings of cash flows out of the business
- Whether there are other sources of finance to cover short term need for cash
Cash-flow forecast.
 A cash-flow forecast is an attempt by management to plan ahead and prevent future liquidity problems. Each month a firm estimates the amount of cash entering and leaving the business and whether this will result in a cash deficit (overdraft) or surplus. If an overdraft is predicted, the managers will have to consider potential solutions. These could include:
- Arranging an overdraft with a bank
- Arranging a longer term loan
- Rescheduling payments or considering alternative purchase solutions, e.g. hire purchase, or possible leasing arrangements
- Selling assets or postponing purchases
- Finding cheaper suppliers
- Reducing credit terms for customers or lengthening credit terms with suppliers
Some businesses are highly seasonal, e.g. farming, tourism. It is likely that firms in these industries will experience some cash-flow problems. If they make arrangements with banks to cover these periods then problems of insolvency may not arise
Alternatively, a firm may have too much cash during the year. This may result in the loss of interest as longer-term investments carry higher interest rates. Firms could also purchase more productive assets.

Example 1 - cash-flow forecast
A typical cash-flow is shown below:
New Horizon Holidays
Cash flow forecast year ($000s)
| Month | Jan. | Feb. | Mar. | Apr. | May | June | July |
|---|---|---|---|---|---|---|---|
| Receipts/inflows | |||||||
| Cash sales | 100 | 120 | 240 | 280 | 430 | 500 | 540 |
| Payments from debtors | 50 | 100 | 100 | 140 | 200 | 340 | 450 |
| Other (loan received) | 80 | ||||||
| Total cash inflows | 150 | 220 | 340 | 420 | 710 | 840 | 990 |
| Payments/outflows | |||||||
| Labour | 20 | 40 | 50 | 60 | 100 | 180 | 200 |
| Flights | 40 | 75 | 90 | 100 | 180 | 190 | 210 |
| Hotel bookings | 30 | 80 | 120 | 140 | 250 | 260 | 300 |
| Interest | 20 | 20 | |||||
| Advertising | 5 | 30 | 30 | ||||
| Electricity | 15 | 15 | 15 | ||||
| Rent | 50 | 50 | 50 | ||||
| Salaries | 50 | 50 | 50 | 50 | 50 | 50 | 50 |
| Purchase of fixed assets | 60 | ||||||
| Total cash payments | 210 | 295 | 340 | 475 | 600 | 680 | 825 |
| Net cash flow | (60) | (75) | (0) | (55) | 110 | 160 | 165 |
| Opening cash balance | 70* | 10 | (65) | (65) | (120) | (10) | 150 |
| Closing cash balance | 10 | (65) | (65) | (120) | (10) | 150 | 315 |
* January's opening balance of $70,000 is the closing cash balance from December
Similarly, January's closing balance of $10,000 becomes the opening balance of February.
Figures in brackets are negative, i.e. negative cash flow - an overdraft.

Examiners like to add complications to cash flows. The most common are:
- Delayed payments or receipts. It is common practice for firms to buy and sell products on credit. The examination question may give a table of sales or purchases but then say that the credit term is one month. It is important that you make the cash flow or inflow one month later. Remember this is cash forecast, not a record of other assets. In the following example the goods received in January are not paid for until February:
| Jan | Feb | March | April | May | June | July | |
| Good received ($000) | 20 | 30 | 30 | 25 | 40 | 50 | |
| Payment - cash outflow | 20 | 30 | 30 | 25 | 40 | 50 |
- Asset purchases made in instalments
- Payment such as electricity may be payable every quarter
The important thing is to make sure that the timings of the cash inflows and outflows are accurate.

Example 2 - Interactive cash flow forecast
Follow the link below to open up an interactive spreadsheet of a cash flow forecast. In this spreadsheet, you can change the values of the various receipts and payments and see the impact on the firms cash balance. Once you have experimented a bit with changing values, reset the spreadsheet (using the 'reset' button) and try the following questions.
Interactive cash flow forecast

1 |
2 |
Perils of cash flow forecasting
A firm prepares a forecast, no more. It makes assumptions when preparing the forecast and there is no guarantee that all expectations or assumptions will be met. This means that cash flow forecasting has to be a continuous or ongoing process. The firm needs constantly to check on the cash position and identify problems before they happen, otherwise the firm may find itself in a liquidity crisis.
A liquidity crisis may be caused by a number of factors including:
- Overstocking happens if the firm does not match its production or purchasing with final demand patterns and holds too much stock, which ties up liquid funds.
- Overborrowing creates significant interest payments. If interest rates rise, these payments may be unsustainable.
- Unexpected changes in the external environment may occur, such as seasonal variations and sudden changes in demand patterns.
- Poor credit control can cause liquidity issues if the firm allows too much credit some of which may go 'bad' in recessionary times.
- Overtrading occurs when a firm expands without securing the necessary long-term finance, which results in the reduction of working capital. If a firm accepts new orders, these may be profitable when sold. However, production ties up liquid funds in assets such as work-in-progress and the storage of stock as well as paying production expenses. The firm will not recover its liquidity until payment is made for the goods, which may not be for a long period, especially if the purchaser takes advantage of a credit period.
An overtrading scenario
The timing of inflows and outflows
A car company assembles vehicles in Europe. It receives an enquiry about supplying an additional 500 cars for a US dealership. It does its calculations and estimates, that even with additional transport costs it will make a 12% profit on every car sold because it has surplus capacity. It accepts the order and waits for the extra profits to roll in. However, they have not examined the cash flow situation.
Just like the majority of manufacturing firms the car assembler makes the cars and pays for all production costs well before they see any inflow of money from sales. The US dealership insists on delivery of all 500 cars before being invoiced. This will take 2 months.
Assume the car manufacturer:
- pays labour at the end of each week
- pays energy bills monthly
- orders the parts two weeks in advance and pays for them 3 months after receipt
- pays additional miscellaneous expenses throughout the production period
The US dealership receives all 500 cars after 2 months, but then uses the full 3 month credit period before paying the total order value.
So despite the each car making a profit, the manufacturer has cash outflows for up to 5 months, before receiving any cash inflows. The question is whether the firm has sufficient liquid assets to fund this production for the entire period. The negative cash flow could destroy the business. If they cannot pay their bills, their factory may be closed before they finish the order. The greater the rate of expansion of sales, the greater the adverse difference between inflows and outflows and the greater the potential cash flow problem. Success can be very expensive!
Management of working capital
If cash flow is poor, how can it be improved?
Working capital management involves monitoring four important components of the working capital cycle:
- debtors
- creditors
- stock
- cash
If you would prefer to view this interaction in a new web window, then please follow the link below:
'What if' analysis - contingency planning
As with all business tools the output is only as good as the quality of the input. Cash flow forecasts are exactly what they say - forecasts of future events. It is good planning to consider 'what if' scenarios which might affect cash flow. For instance:
- Sales revenue is lower than expected as fashions change
- Customers do not pay on time or there are larger bad debts than usual
- Raw materials, components and energy costs increase rapidly
- New competitors enter the market and existing competitors cut prices
- Interest rates increase
- Market research is inaccurate
- Motivation falls leading to lower output and higher production costs
The firm can work out the worst case scenario and look at the effect on its cash flow. Would this be sustainable? It can then put procedures and contingencies in place to deal with emergencies. For instance it may build contingencies into its budgets and/or negotiate overdrafts on good terms before they are required. Computer software makes it easier to complete 'what if' analysis using spreadsheets with variable timings and amounts.
3.3 Working capital - questions
In this section are a series of questions on the topic - Working capital. The questions may include various types of questions. For example:
- Self-test questions - on-screen questions that give immediate marking and feedback
- Short-answer questions - a series of short-answer questions to help you check your understanding of the topic
- Case study - a case study with associated questions
- In the news - questions based around a topical business news article
Click on the right arrow at the top or bottom of the page to work through the questions.
Working capital - short exercises

Exercises
- Explain the concept of working capital.
- Draw a diagram to show the 'working capital cycle' and explain its components.
Cash flow forecasts - case study - cash flow management

Wholesale Phones Ltd
Three shareholders, Sandra, Sumira and Ranjit, have just set up a small company that buys mobile phones from Asia and the sells them to wholesalers in Europe. Marketing and selling is done using the Internet. When they started trading, Ranjit the Accountant, arranged an overdraft with the Bank for $100,000. They had also deposited $36,000 in cash in return for the initial share issue.
The early weeks were very hard, but the market was growing. Sales were very good, and all the owners' efforts were put into buying and selling. Credit control was ignored, and Ranjit let the work on the cash flow forecast slip.
The owners are in the boardroom when the receptionist interrupts them.
'Ranjit, phone the Bank Manager at once. Unless you talk to her, she will call our overdraft in.'
'What is she on about', said Sandra, 'does that mean I will have to cancel the order for my BMW?'
Ranjit went to his office. He had not really checked the cash position for two months.
He was a little worried. His records showed the following.
Opening bank balance - $12,468 credit
Overheads
Rent: Office $3,000 per month. Both months paid.
Furniture: $1,000 per month. One month paid.
Cars: $1,000 per month. One month paid.
Rates, Insurance etc: $1,000 per month. Both months paid.
Tax: $500 per month. None paid.
Services: $250 per month. Both months paid.
Salaries and expenses: $9,500 per month. Both months paid.
Sundries: $1,000 per month. One month paid.
Sales
Period 1: $15,000 All paid for.
Period 2: $24,000 All paid for.
Period 3: $30,000 Half paid for.
Period 4: $40,000 No payments received.
Period 5: $86,000 No payments received.
Purchases
Period 1: $8,000 Paid.
Period 2: $15,000 Paid.
Period 3: $15,000 Paid.
Period 4: $55,000 Paid.
Period 5: $45,000 Paid.
Was he right to be worried, and will Sandra get her car? He had set up an overdraft limit of $80,000 with the bank. Surely that was enough?
Hint: He has every right to be worried, very worried!
Cash flow forecasts - short answer questions

Question 1
Explain why cash may be more important to a firm than profit.
Question 2
'Look, we have made $150,000 profit this year. What do you mean I can't afford to buy that Aston Martin?' Discuss this statement, made by the Chairman of a company to her Finance Director.
Question 3
Explain the statement 'The life blood of firms is cash, not profit'.
Cash flow forecasts - numerical questions

The Computer Business
Power plc sells computers to the general public through the Internet. They buy their stock for $600 per computer and sell them for $1,000 each. The history of the firm for its first 10 weeks of trading is shown below.
When they started the business the three shareholders put in $100,000 in cash.
Week 1 - they rent a serviced office for $300 per week, and pay this in cash. This rental is then paid weekly for the remainder of the 10 weeks.
Week 2 - they purchased a batch of 100 computers at a price of $600 each, paying cash with order. The pay an insurance policy for 6 months. It costs them $650 cash.
Week 3 - they sell 50 computers for cash, and 20 on two weeks credit.
Week 4 - they purchase another batch of computers. They now buy 200 units at a special price of $500 each for cash. They sell 50 units on three weeks credit, and 20 for cash.
Week 5 - they sell 30 units for cash and 50 on three weeks credit.
Week 6 - they buy another 200 units for $500 cash. They also pay wages of $2,500 cash. No sales this week.
Week 7 - they sell 80 units on three weeks credit.
Week 8 - they buy another 200 units on a very special deal. Cash purchase at $450 per unit. They sell 50 for cash.
Week 9 - they sell 60 on three weeks credit and 30 for cash.
Week 10 - they buy 200 units on one-month credit. They sell 40 units for cash and 20 on three weeks credit.
Question 1
Prepare a chart showing the purchases, sales and stocks of the firm for the trading period of 10 weeks.
Question 2
Prepare a cash flow statement for the firm covering these first 10 weeks trading.
Question 3
Prepare a profit statement, on a week-by-week basis, for the same 10-week period.

Question 4
Market Mike
Mike Dines has recently begun in business running his own market stall. He wishes to expand and he would need a bank loan. The bank has requested that Mike produces a cash budget for the forthcoming period. He has obtained the following information relating to the next six months. This information is to be used to construct a cash flow forecast for the six months ending 31 December.
- Purchases and sales are expected to be as follows:
| All in $s | Jul | Aug | Sep | Oct | Nov | Dec |
|---|---|---|---|---|---|---|
| Purchases | 890 | 1040 | 1190 | 1260 | 1350 | 1670 |
| Sales | 1480 | 1530 | 1580 | 1670 | 1760 | 2140 |
- Purchases are paid for one month in arrears
- All sales are for cash
- Trade creditors as at 30 June amounted to $830
- A new stall is expected to be purchased in September which would cost $750. The old stall would be traded in at a value of $150.
- Personal drawings are $500 per month
- Rent of the market stall patch amounts to $180 per month but will rise to $270 in October
- On 1 July the bank balance was $750 overdrawn
Required
- Prepare a cash budget for the six months ending 31 December.
- Identify three actions that Mike could take to secure this bank loan.
Case study (1) - profit and cash flow

Ecocity Cars Ltd
Ecocity has developed a new micro city car that runs on a petrol/electric system licensed from Honda. It knows from market research that there is a strong demand for the vehicle because of its small size and competitive pricing, and it is installing assembly capacity for up to 2,500 cars per month. It has prepared the following cost and revenue data for the first 6 months of sales of the car.
The selling price of each car is $25,000 each. Cars will be sold to specialised dealers on two months credit, initially.
| Month | 1 | 2 | 3 | 4 | 5 | 6 | 7 | 8 | 9 |
|---|---|---|---|---|---|---|---|---|---|
| Sales forecast | 10 | 30 | 100 | 200 | 500 | 1,000 | 1,200 | 1,400 | 1,600 |
Cars must be assembled two months before sale at this stage. When Ecocity become more established it will be able to cut this, and is planning for just-in-time assembly in year 2.
Costs are forecasted as follows:
Parts and materials: $10,000 per car, purchased and paid for one month before use.
Labour: $2,000 per car, paid for at the time of assembly
Overheads: $100,000 per week, paid as cash.

For the first 6 months of sales, prepare the following:
- Cash flow forecast
- Profit forecast
If Ecocity starts its operation and the first ordering of materials with $1 million in the bank, will it need an overdraft facility in this period? If so, how much should be asked for, and when?
Case study (1) - profit and cash flow

A company produces and sells DVD's to the Retail Trade. The firm sells packs of 10 DVD's, at a cost of $100 per pack. The cost to the company, per pack, are summarised below:
Labour $10 per pack
Materials $15 per pack
Overheads and expenses $25 per pack
All costs are paid in cash as they are incurred. Sales may be made for cash or on 4 weeks credit.
At the start of the period the firm has $100,000 in the bank, and has built up a profit of $250,000.

Question 1
Calculate the profit made on the sale of a pack of DVD's.
Examine the actions described below and calculate the effect of them on the firm's cash flow and profit position. You are advised to use the pro-forma stock chart and cash book by clicking on this link: [Pro-forma].
Question 2
In month 1 the firm makes 10,000 packs, but sells 5,000 packs for cash. Show the impact of these transactions on cash, profit and stock levels.
Question 3
In month 2, the firm makes another 15,000 packs, but sells 7,000 packs on one month free credit.
Question 4
In month 3, the firm makes another 15,000 packs, but sells 10,000 packs for cash and 5,000 on one month free credit.
Question 5
In month 4, the firm makes another 10,000 packs, but manages to sell only 7,000 packs, then only on one month free credit.
Question 6
In month 5, the firm makes another 15,000 packs, but sells 5,000 packs for cash and 10,000 on one month free credit.
Question 7
In month 6, the firm makes only 5,000 packs, but sells 7,000 packs on one month free credit, and 13,000 packs for cash.
Case study (2) - profit and cash flow

Many businesses have seasonal demand patterns. This question enables you to test your knowledge of profit and cash flow, and to practise working by examining a case study, extracting data, and making appropriate calculations. Do not try to be quick, just careful!
A farmer grows rape seed on her farm. She has 40 hectares of usable land. She expects a yield of 8.5 tons/hectare and should receive $100 cash per ton from the buyer, and $25 per tonne as a subsidy payment from the EU Agricultural Support budget. She grows one crop per year, which she sells in August. In September she buys and plants seeds, 4 tons at a price of $250 per ton. She buys fertiliser in November and March; 15 tons each time at $80 per ton. She pays herself $450 per month and also pays $500 four times each year for assistance in seeding September, fertilising and reaping in November, March and August. She pays rent of $1,500 in January, April, July and October, and taxes of $1,700 in May. All transactions are in cash.
At the start of this growing season she had $3,000 in the bank.

Question 1
How much profit will she expect to make this season?
Question 2
Will she need to arrange an overdraft with her bank?
Hint: You need a table, by month, to work this out correctly.
Question 3
If she does need an overdraft, when will she need it and how much should she ask for?
Awash with cash

Read the article, Almost $40 Billion In Cash: What Is Apple Waiting For? and then consider answers to the questions below. You can either read the article in the window below, or follow the previous link to open the article in a new window.

You may also like to read the following article, which develops the themes raised in Businessweek:

Question 1
Outline the present cash position of Apple.
Question 2
Compare the views of Apple CFO Peter Oppenheimer that the goal of Apple's cash management is "preservation of capital" and investment in "short dated, high quality investments" with the writer's viewpoint.
Question 3
Discuss whether Apple should use their cash for dividends or further acquisitions and investments.
Awash with debt

It could be a week, a year or possibly two, but it will happen; a UK premiership club will go out of business. Portsmouth F.C. has been on the brink. The club had four owners in just one season. Afflicted by the desire to compete with the Liverpools and Manchester Uniteds of this world... they spent big. They attracted international stars to a relatively small provincial club with the carrot of wages beyond their means. In 2009, wages represented 90% of the revenues of the club. The bonuses were so high, that if they had won the F.A. Cup, they would have lost money. What does this prove? It is simple. No business, whether a bank or a fashion house like McQueen, can spend more than it earns for a long period. If costs are higher than revenues there will come a time when the business is financially unsustainable.
A business may represent the heart and soul of a community or be the brand choice of Hollywood stars, but if it fails to maintain an adequate cash flow or to make a profit it is dead.

Read the article, Portsmouth FC's insolvency lessons and then consider answers to the questions below. You can either read the article in the window below, or follow the previous link to open the article in a new window.

Before answering the questions below you might also like to read the following articles. The first is an BBC 'questions and answers' article, which explains the concept of a business, such as Portsmouth FC, going into administration and the consequences for its survival:
The second article outlines the financial mismanagement at the club and lists the creditors. The third article describes one of the actions of the administrator in seeking to reduce the debts of the club.

Question 1
Define the term 'insolvency'.
Question 2
Explain what happens when a business is put into administration.
Question 3
Examine the practical consequences for Portsmouth F.C. resulting from its poor liquidity.
Question 4
"Cash flow is a key component in operating a successful business, and during a recession its importance cannot be understated." Discuss the importance of cash flow management during a recession.
3.4 Budgeting - notes (HL only)
Introduction
In the previous section we looked at sources of finance and their suitability, used different methods of investment appraisal, defined working capital and prepared cash flow forecasts. We now move on to look at budgets and variances.

By the end of this section you should be able to:
- Explain the importance of budgeting for organisations
- Calculate and interpret variances
- Analyse the role of budgets and variances in strategic planning
Budgeting


A budget
A budget is an agreed plan setting out an organisation's expected future income and expenditure over a defined period usually one year.
A budget is a forward financial plan. It provides a prediction of expected flows of money in and out of the firm in the immediate future. A budget is a yardstick by which a manager's success or failure can be measures and potentially rewarded. Normally, a budget will be prepared in advance of a period of time, usually a year but it could be on a monthly or quarterly basis.
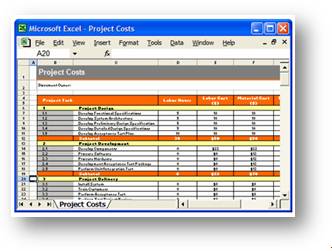 What is called the firm's budget is actually a whole series of sub-budgets covering all of the functional areas such as production, marketing, finance and administration. From the start of the process the firm identifies the primary constraint on its operations during the coming year. Normally this is sales, so all other budgets must reflect this primary budget, after all a business should not spend more than it is earning. The master budget is a summary of company's plans that sets specific targets for sales, production, distribution and financing activities. It consists of a number of separate but interdependent budgets, which usually culminates in a cash budget, a budgeted profit and loss statement, and a budgeted balance sheet. In short, the master budget represents a comprehensive expression of management's plans for future and how these plans are to be accomplished. It is quite clearly a confidential document!
Budgets are drawn up for a number of reasons within a firm. Often the process of producing a budget will take a significant amount of time. Producing budgets on a regular basis for a large part of the activities of the business will help in the following ways.

Types and purposes of budgets

If you would prefer to view this interaction in a new web window, then please follow the link below:
How are budgets set?
Budgets need to be realistic, agreed, co-ordinated, challenging and flexible. These may have to be negotiated as there is a natural tendency to inflate budgets, so as to make it easier to be met.
Budgets are set by reference to:
- Historical data - what has happened in the past, previous experience and knowledge of previous trends.
- Organisational aims and objectives - the budgets will need to complement the aims of the business. If expansion is planned, budgets will need to reflect this. The aims and objectives need to be expressed in terms of sales revenue, market share and ultimately profits.
- Available finance - budgets must be realistic as firms cannot spend more than the funds available.
- Benchmarking - a firm may set budgets that reflect industry best practice and in line with similar sized organisations. Procter and Gamble and Unilever are among the world's largest advertisers and major competitors. No doubt an increase in the marketing budget by one of these two will be quickly matched by the other.
- Negotiation and discussion - budgets should be set though concensus not by imposition. A manager will only feel responsible if there is agreement when it is set.
Benefits and Limitations of budgeting
Budgets have features which enhance performance and efficiency and help improve financial control. Budgets:
- Control and monitor costs and link costs to revenues
- Make individuals responsible for their performance
- Provide data for rewarding individuals
- Motivate individuals by setting challenging, but achievable targets
- Improve communication within, and between, departments
- Force managers to consider the direction of the business and the role of departments in the process of reaching organisational aims and objectives.
However, budgeting does not always produce positive results:
- Budgeting is not an exact tool since they are built on forecasts of revenues and costs. If an inaccurate budget is set, it may be very demoralising for the budget holder who may be held responsible.
- Powerful departments and individuals may be able to set higher budgets than necessary as a way of demonstrating their status.
- Budgets may encourage short-termism to meet unrealistic targets and promote a focus on financial targets at the expense of less tangible, but important factors such as brand building, teambuilding, effective leadership and customer satisfaction.
- Unless budgets are allowed to roll over to the next financial year, managers may be encouraged to spend unnecessarily near the end of the financial year, before the money is taken away.
- Budgets may be set by adding on an increment to the previous year's budget rather in relation to actual need. This is called historical budgeting.
- The process of setting budgets and updating them takes considerable time and can be expensive. It is unlikely that smaller firms or sole traders will be willing to spend money on extensive market research - making predictions less accurate.
- Senior managers will often try to control the level of spending by different departments by insisting on 'efficiency gains'. This means that departmental managers have the amount allocated to them reduced by a small percentage each year to encourage productivity increases. This may be resented by staff, who see this as unfair.
- The budgeting process may limit co-operation between departments as they fight to increase their own budgets to protect self interest, even if this is at the expense of other departments and the overall success of the business.
- The procedure of setting an annual budget may not be suitable when markets and external environments are changing rapidly.
Although planning for the future is highly desirable, critics of budgeting argue that it can be an inflexible and inappropriate tool. As a result alternative forms have developed. Two of these are:
- Flexible budgeting
- Zero-based budgeting
 Flexible budgeting
Flexible or flexed budgeting allows budgeted targets for revenues and costs to alter as circumstances change. For example the external environment can change rapidly and this should be reflected in the budget process. Recessions may cause sales revenue to fall below target and this should be reflected in lower expenditure as less output is required. When budgets are prepared they may include targeted expenditure at different levels of sales, e.g. 95%, 90%, 85% of forecasted sales levels.
Although this allows the business to respond to changing conditions, the changes may loosen the link between budgets and company objectives.
Zero-based budgeting
 The financial information used in most budgets is based on historical data. A department holder is likely to look at last year's planned and actual expenditure as a starting point in preparing the current year's budget. Additional sums may be included to cover increased costs and inflation. However, some expenditure may be difficult to quantify, especially if there are no previous examples. Here Zero-based Budgeting (ZBB) is employed.
The budget holder starts with nothing and is required to justify every $1 of expenditure. Nothing is included in a budget unless the person responsible for it can demonstrate why funds are required, what benefits the expenditure will bring and how it will help the organisation achieve its objectives. This prevents spending just because it has always been spent. It can be a long and costly process to set up budgets this way.
Advantages
- Nothing is taken for granted. Every cost has to be justified.
- Previous budgets do not influence the present one
- Efficiency should be improved as a result of the questioning procedure and resource allocation should be improved
- Staff motivation should be improved, if the process is part of a suitable corporate culture.
- Managers are forced to evaluate expenditure on a regular basis
- It encourages the examination of possibly cheaper alternatives
Disadvantages
- May be very time consuming to collect all the relevant data
- Managers may be demotivated by constantly fighting for funds
- Managers may not be prepared to support each and every item
- Managers may not spend in areas that would, in fact, benefit the business
- Decisions may be more political and influenced by subjective opinions.

Variance analysis

A budget variance is the difference between the actual amount incurred or realised, and the corresponding budgeted or planned figure.

Variances can be adverse/unfavourable or favourable. They can also be positive or negative.
Be very careful with these terms. A positive or a negative variance may be favourable or adverse/unfavourable.

Adverse variances
Adverse variances are those variances that are unfavourable to the firm. Examples would be sales below plan; costs above budget, cash receipts lower than expected, and overtime payment more than forecast.

Favourable variances
Favourable variances are those variances that are beneficial to the business. Examples would be sales ahead of plan, costs below budget, and wages below forecast.

Positive variance
A positive variance occurs where 'actual' exceeds 'planned' or 'budgeted' value. Examples might be actual sales are ahead of the budget.

Negative variance
A negative variance occurs where 'actual' is less then 'planned' or 'budgeted' value. Examples would be when the raw materials cost less than expected, sales were less than predicted, and labour costs were below the budgeted figure.
As you can see in the table below, the variance may be adverse or favourable according to the budget being scrutinised.
| Actual greater than budget | Actual lower than budget | |
|---|---|---|
| Sales/turnover/income | Favourable | Adverse |
| Costs/expenses | Adverse | Favourable |
Which of these are favourable and which adverse?
- The raw materials cost less than expected. The company saves money so increases profit. Favourable, therefore, in spite of the variance being negative. Negative, favourable.
- Sales were less than predicted. Revenue will fall. Profit is lost, so the variance in adverse, but is negative. Negative, unfavourable.
- Profits were above the budgeted figure. The company gains from increased profit. Favourable, therefore, and positive. Positive, favourable.
- Sales tax charges were more than forecast. The company suffers, so it is an unfavourable variance, in spite of being positive. Positive, unfavourable
The tests for variance
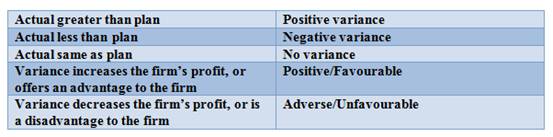
If you follow these rules you should have no difficulties with variances.
In examinations, you will not be expected to analyse budgets in detail, but you may be asked to identify whether a variance is favourable or adverse, if it is positive or negative.
Management by exception
The concentration of management on abnormal performance is called 'management by exception'. There is no point in management wasting their valuable time monitoring and examining systems that are working normally and according to plan. Any variances, positive or negative should trigger an investigation. A positive variance may not be beneficial to a firm. It may, for instance, result from a manager under-spending on training or marketing, which may have negative impacts on performance and profitability. An improvement in sales revenue may be the result of increased prices, which may make the business less attractive in the longer term.
Causes of variances
Interpreting variances is like detective work. You probe deeper and deeper, and find out more and more. The process of monitoring, identifying and explaining variances is a significant element in finding solutions to improve performance.
Let's look at the example of Specialty Foods, which appears later in the questions with this module.
The report was as follows:
Specialty Foods Ltd. - profit report - June (Units - $000)
| Plan | Actual | Variance | |
|---|---|---|---|
| Profit | 10,000 | 9,000 | (1,000) |
| Sales | 110,000 | 120,000 | 10,000 |
| Costs | 100,000 | 111,000 | 11,000 |
If you were the Managing Director you might ask some questions.
Question 1
Where has the increase in sales revenue come from?
Sales revenue = number sold x price per unit.
Deeper in the pile of reports will be one covering this. It might look as follows:
Specialty Foods Ltd. - variance report - sales
| Plan | Actual | Variance | |
|---|---|---|---|
| Sales revenue ($000) | 110,000 | 120,000 | 10,000 |
| Sales units | 11,000 | 11,000 | 0 |
| Sales price ($ each) | 10 | 10.91 | 0.91 |
The increase in revenue has come from putting the price up. This may raise a whole set of new questions, and more detective work will be done. The firm will become more efficient over time.
Question 2
Where has the increase in costs come from?
You can dig in the same way. Cost of an item will be made up of price and usage. If the cost per unit had fallen but the usage increased you can again ask why.
- Is there something wrong with the cheaper material?
- Has the plant become old and worn out?
- Have the workers or management become slack?
Having answered the questions you can do something about it.
Budgeting is an interesting area of work in a real business. Budgets and the subsequent variance analysis is a very important part of management accounting and company management.

3.4 Budgeting - questions

In this section are a series of questions on the topic - Budgeting. The questions may include various types of questions. For example:
- Self-test questions - on-screen questions that give immediate marking and feedback
- Short-answer questions - a series of short-answer questions to help you check your understanding of the topic
- Case study - a case study with associated questions
- In the news - questions based around a topical business news article
Click on the right arrow at the top or bottom of the page to work through the questions.

Types and purposes of budgets - short answer questions


Question 1
Define the term 'budget'.
Question 2
Explain two disadvantages of budgets.
Question 3
Describe zero-based budgeting.
Question 4
Analyse the costs and benefits of zero-based budgeting.
Question 5
Discuss whether a budget can ever be accurate.

Variance analysis - short answer questions


Question 1
Explain the differences between a positive and a favourable variance.
Question 2
Examine whether a large variance is a sign of poor management.

Variance analysis - case study


Specialty Foods Ltd
Tong Lui, the new management accountant, has just completed his first month's work. He has entered a huge amount of data into the finance and accounting system and is now faced with a pile of reports. One such report is shown below:
Specialty Foods Ltd. Profit Report: June (Units - $)
| Plan | Actual | Variance | |
|---|---|---|---|
| Profit | 10,000 | 9,000 | (1,000) |
| Sales | 110,000 | 120,000 | 10,000 |
| Costs | 100,000 | 111,000 | 11,000 |
Explain the meaning of the above report.

Budgeting for R&D

Read the article Tough Times Spur Shifts in Corporate R&D Spending and then have a go at the questions below. You can either read the article in the window below, or follow the previous link to open the article in a new window.


Question 1
Define the term 'Research and Development' (R&D).
Question 2
Explain why firms may reduce their R&D budgets in a recession.
Question 3
Examine the reasons why '... 232 companies in the Standard & Poor's 500 index for which data were available increased their aggregate research and development expenditures to $163.37 billion in 2008 and $166.42 billion in 2009 from $154.44 billion in 2007'.
Question 4
Discuss the reasons why large pharmaceutical companies such as GSK and Pfizer are cutting their R&D budgets.

Budgeting for advertising

The news
Executives at most of the countries independent television companies are bracing themselves for difficult times. With the economy suffering in the recession, advertisers are cutting their budgets and focusing on the more successful programmes. This is a major concern for commercial channels as advertising is their main source of income. As revenue flows decline, schedulers are looking for ways to boost income or cut costs. Programmes, such as The Wire and Glee, can bring financial success in the short-run attracting extra viewers and generating more advertising opportunities. If these viewers remain loyal over several series, more can be charged for the advertising slots available before, during and after the show. However, when successful series end, finding the next blockbuster becomes a priority; however this does not come cheap. Other more established programmes may struggle and producers and executives will have to look at their budgets to see if it worthwhile keeping these going. The result may be cheaper television, such as reality programmes, or ever more repeats.
The theory
Obviously, we are talking budgets and other related topics. In this topic we will be looking at cost centres, profit centres and the use of variances. So, let's start with an analysis of what we mean by the term 'budget'. Follow the links below to see information on related theoretical topics.
Budgeting
Variance analysis

Questions
- Explain what you understand by the terms:
- variance
- zero budget
- Outline the reasons why budgets may be inaccurate.
- Examine how managers use variance analysis to monitor the performance of their business.
- Analyse how producers may react at independent television companies as their advertising revenues fall.
Suggested answers

3.5 Final accounts - notes
Introduction
In the previous sections we looked at sources of finance and their suitability, used different methods of investment appraisal, defined working capital and prepared cash flow forecasts and explained the importance of budgets and calculated variances. We now move on to look at final accounts, methods of depreciation, intangible assets and stock valuation.

By the end of this section you should be able to:
- Explain the purpose of accounts
- Construct and amend accounts from information given
- Evaluate the importance of final accounts to each stakeholder group

- Calculate depreciation using straight line and reducing balance methods
- Evaluate the strengths and weaknesses of each method
- Explain the meaning and value to the firm of differ types of intangible assets
- Understand the difficulties associated with valuing intangible assets
- Make calculations of closing stock using LIFO and FIFO
- Calculate the effect of different stock valuations on profit
Final accounts

Accounting
Accounting is the systematic process of identifying, recording, measuring, classifying, interpreting and communicating financial information about a business. It provides information on the resources available to the business, the means employed to finance those resources, and the results achieved through their use. It reports on the profit or loss for a given period and the value and nature of a firm's assets, liabilities and owners' equity.
Micawber Principle

Annual income twenty pounds, annual expenditure nineteen nineteen and six, result happiness. Annual income twenty pounds, annual expenditure twenty pounds ought and six, result misery.
Wilkins Micawber from Charles Dickens' novel David Copperfield.
Of all the business functions, probably none has the universal reach of accounting, which is found in nearly every community in the world. It deals with people and everyday life in the language of numbers. It provides a measure of success and failure; it allows performance of individuals and organisations to be compared; it underpins decision making in business and everyday life; it provides a system of control and allows individuals and organisations to plan for the future.
For the wide range of individuals and organisations affected by a particular business, relevant information can reduce risk and maximise opportunities. Different stakeholders will each have their own concerns and information needs. To satisfy these needs the government and other regulatory and financial bodies impose reporting requirements on businesses under a series of accounting standards (although specific to an individual country there are significant international overlaps). In addition, businesses themselves may volunteer additional information through a range of publications such as annual reports and websites.
As a student you may look at accounts and decide they are 'boring'. However, behind the numbers lies intrigue and deception that could be the script of any best-selling thriller - and indeed was in the 2005 film about the demise of Enron, The Smartest Guys in the Room.
After all, accounts can involve millions or possibly billions of dollars and the temptation to 'fiddle the books' has existed as long as even rudimentary accounts existed. Perhaps the US has suffered most from high profile scandals surrounding companies such as Enron, WorldCom and Tyco, which have left individuals ruined and others in prison with huge corporations like Arthur Andersen collapsing in the aftermath of the financial earthquake.
In the case of limited companies, accounts are public documents and the law lays down the information that must be included and the nature of how this information is reported. There is pressure on every business to make their accounts look as good as possible. The law and accounting regulators attempt to standardise reporting to provide a 'true and fair view' of a business. However, there are still ways that firms can 'window dress' their accounts to present their operations in the best possible financial light. Sometimes this 'financial massaging' of the accounts is legal and sometimes it is not.

The triumvirate of shame - Enron, WorldCom and Tyco
The early part of the millennium saw a number of financial scandals in the US typically involving misuse of funds, overstating revenues, understating expenses, overstating the value of corporate assets or under-reporting the existence of liabilities, sometimes with the cooperation of officials in other organisations, including company auditors.
 Enron Fraud
Enron filed for bankruptcy in December 2001. The former energy giant was undone by accounting fraud and off-the-balance-sheet transactions. In the Enron case, many players were involved in fraud at multiple levels. Investigations implicated several former high level executives and have brought into question the roles of many others. Enron's accounting firm, Arthur Anderson, LLP, was convicted of obstruction of justice, because the firm allegedly destroyed documents pertinent to the Enron case.
The founder of Enron, Kenneth Lay, and the CEO, Jeffrey Skilling, went on trial in 2006. Lay pleaded not guilty to the eleven criminal charges, claiming he was misled by those around him. He faced a total sentence of up to 45 years in prison, but died before sentencing. Skilling was convicted of fraud and sentenced to 24 years and 4 months in prison. The chief financial officer, Andrew Fastow, pleaded guilty to two charges of conspiracy and was sentenced to ten years, with no parole, in a plea bargain to testify against Lay and Skilling.

- The Corporate Scandal - list of all the 2000 - 2002 financial scandals in the US reported in Forbes Magazine.
- Called to Account - the demise of Arthur Anderson reported in Time magazine.

- The Smartest Guys in the Room the trailer for the Enron film
Tyco Fraud
Tyco International, Ltd. a US conglomerate, sold a diverse range of healthcare, security, telecommunications and electronics products worldwide. In 2002, three former top Tyco executives were indicted on fraud charges. Former CEO L. Dennis Kozlowski, former CFO Mark Schwartz, and former legal counsel Mark Belnick allegedly issued themselves low or no interest loans, which they then forgave through an unauthorized bonus program. They concealed their illegal actions from shareholders and other board members by keeping them out of the accounts. Tyco replaced its CEO and most of its Board in an attempt restore its reputation.
Kozlowski and Swartz were convicted on theft charges. Kozlowski was sentenced to no less than eight years and four months and no more than 25 years in prison. Swartz received the same sentence.
In July 2007, Tyco separated into three publicly independent companies.
WorldCom Fraud
For a while, WorldCom was the second largest long distance phone company in the US after AT&T. In July 2002, major accounting errors that hid vast amounts of debt led WorldCom to file bankruptcy. Investors were unaware of the company's problems because of the accounting mistakes and intentional cover-ups. Some former top executives of WorldCom were accused of altering transaction and account records to conceal company debt. The company emerged from Chapter 11 bankruptcy in 2004, with about $5.7 billion in debt and $6 billion in cash. In 2005, Verizon Communications agreed to acquire MCI for $7.6 billion.
In 2005, CEO Bernard Ebbers was found guilty of all charges and convicted of fraud, conspiracy and filing false documents and sentenced to 25 years in prison. Other former WorldCom officials were also charged with criminal offences.
Auditing of accounts
All firms are required to have their accounts audited by independent companies to ensure that they present a 'true and fair view' of the financial position of the firm. The auditors accept that they will become legally liable should it be established that they did not exercise due diligence and missed some irregularity or illegality.
However, following Arthur Andersen's audit of Enron, its rapid collapse thereafter as one of the world's major accountancy firms and the spiralling costs of professional indemnity insurance, governments have been forced to introduce the concept of liability limitation agreements to restrict the liability of auditors for claims.
Use of Accounts
There are three main groups of users of published accounts, each of which will be seeking different information for different purposes:
- Internal management who can use financial results as measures of their own performance and success. The accounts form the foundation of future strategic and financial planning.
- Other internal users such as employees and trade union representatives may use the information to support their claims for better term and conditions or for general information about the success or otherwise of the business. The accounts will allow employees to assess their job security.
- External users such as shareholders, customers, suppliers, financial investors and lenders of funds and the government, who want to know how successful and stable the business is and to gain a picture of its profitability, assets, liabilities and future prospects. Shareholders and other investors will want to know how their money was used and how their investment performed. Suppliers will want to know the likelihood of future orders and whether they will be paid if they do supply. The government will want financial information to assess tax liabilities and to support economic planning and reporting.
All companies must provide a set of final accounts including three major accounting statements:
- The profit and loss account (the income statement) calculates the surplus or deficit of income over all of the business costs across a specified period, usually one year. Income can come from trading activity in the form of sales revenue or from non-trading activity such as dividends on shares. Any costs which arise directly or indirectly from the process of selling of products are deducted. The resulting profit and loss after tax and other deductions is ploughed back into the business and this figure transferred to the balance sheet.
- The balance sheet is a summary statement showing the firm's sources of finance and their corresponding use at a given date. It shows the stock of 'assets' a business owns which is balanced against the amount of money a business owes.
- The cash flow (funds flow) statement shows the sources of new funding into the business and how these funds have been used or applied.
Types of financial information
There are two distinct areas of financial information:
1. Management accounts
2. Financial accounts
Financial accounts
Firms need financial accounts, because they use money and, often, other people's money.
 The tax authorities want to see that they have not been cheated. Shareholders want to be sure that the directors have done a good job for them. Potential investors want to see how well the firm is doing. However, the most fundamental reason why incorporated businesses prepare them is because Company Law in most countries states that they have to, and as a result, the accounts are public property in most countries.
Accounts tell a story in numbers. The story is complex and often shrouded in intrigue and illusion. Company accountants are paid very well to make the accounts look good. In this section you will be introduced to some of the language of financial accounts. You will also become familiar with important accounting concepts and techniques, which will help unravel the figures, remove the shrouds and allow us to look at the real story behind the numbers.
Companies spend money so that they can make their product or service and then sell it later. They get revenue when it is sold and actually receive the payment.
Already you can see the two sides of accounting - expenditure and income. The order is important; usually expenditure comes before income. A firm usually has to make something and supply it before it will be paid for it.
All payments and receipts have to be accounted for, to both the owners of the business and the government. This is done through a formal set of financial accounts that consist of:
- The balance sheet
- The profit and loss account (P&L Account)
These will be accompanied by a set of notes, which explain entries in the accounts and also give a mass of interesting information. These accounts are what are called 'historic' meaning they report what has happened in the past. They tell the reader what a firm has done, but not what it will do. Accounts are probably 3 to 6 months out of date when they are published.
What follows are some descriptions and definitions:

Balance sheet
The balance sheet is a financial statement of a business that lists the assets, debts, and owners' investment as of a specific date - usually the last date of an accounting period. Assets are ordered according to how soon they will be converted into cash, and debts according to how soon they must be paid. Balance sheets do not list items at their current monetary value, so may greatly overstate or understate the real value of certain corporate assets and liabilities.
The balance sheet is often referred to as a 'snapshot' of the firm on a particular date - as if the auditor had visited the firm on a single day and taken photographs of all the various components that make up the business. It can only be constructed on one date, and not over a period of time, as the values for assets and liabilities change constantly. Single balance sheets just show how things are on a particular date. Balance sheets reveal the most information when they are compared with previous balance sheets, as that process shows the extent to which the business has changed; whether it has grown or contracted and how one part has grown or declined relative to another. This is rather like looking at photographs of yourself over a number of years - it tells a narrative about how you have changed. However, there is always a story behind those changes and this is what financial analysis, such as the use of ratios, attempts to establish and explain.
The balance sheet is split into two parts:
- A statement of fixed assets, current assets and the liabilities (sometimes referred to as "Net Assets")
- A statement showing how the net assets have been financed, for example through share capital and retained profits.
The law requires a balance sheet to be included in the published accounts of all limited companies. In reality, all organisations that use other people's money need to prepare accounts for external users, since it is an important to provide stakeholders with feedback about the financial affairs of the organisation.
However, a balance sheet does not necessarily provide a true value of a business, because assets and liabilities are shown are historic, and some intangible but valuable assets, such as brands, quality of management and goodwill are not included.
A balance sheet has the following title which shows it is a 'snapshot' at a particular time; this is usually the last date of the firm's financial year:
| Balance sheet for |
|---|
| XYZ Company |
| as at 'a date' |

Profit and loss account
A profit and loss account is a statement recording all of a firm's revenues, costs and net income within a past trading period. The account shows gross and net profit or loss on trading.
The Profit and Loss account:
| Profit and loss account |
|---|
| XYZ Company |
| for the year ended 'date' |
So balance sheets act as 'bookends' to a profit and loss account and cash flow statement.
It is conventional to give the last years accounts alongside the new ones. This enables comparisons to be made right from the start. A balance sheet will be headed like this:
| Balance sheet |
|---|
| XYZ Company |
| As at 1st January 2011 |
| 2010 | 2011 |
|---|
Look at the data section of this unit where you will find a set of accounts for a fictitious company. These will be used later, but look at their format now, if you like (Click on the right arrow at the top or bottom of the page to see them).
Sample accounts
The following set of accounts represents the set of documents published by a fictional company.
| Balance sheet - Forlorn Sails plc as at 28th May 2011 ($'000's) |
|---|
| 2010 | 2010 | 2011 | 2011 | |
|---|---|---|---|---|
| Fixed assets | ||||
| 600 | Land | 600 | ||
| 1,200 | Buildings | 1,200 | ||
| 2,100 | Plant and equipment | 2,300 | ||
| 700 | 4,600 | Others | 800 | 4,900 |
| Current assets | ||||
| 250 | Stock | 500 | ||
| 250 | Debtors | 400 | ||
| 100 | Cash | 600 | ||
| 600 | 1,500 | |||
| Current liabilities | ||||
| 150 | Creditors | 200 | ||
| 100 | Overdrafts | 300 | ||
| 150 | Taxation | 200 | ||
| 300 | Dividends | 300 | ||
| 700 | 1,000 | |||
| (100) | Net current assets | 500 | ||
| 4,500 | **Net assets | 5,400 | ||
| Financed by: | ||||
| Long term liabilities | ||||
| 500 | Loans | 1,000 | ||
| 500 | 1,000 | Debentures | 500 | 1,500 |
| Capital and Reserves | ||||
| 1,200 | Share capital | 1,200 | ||
| 500 | Revaluation reserve | 500 | ||
| 500 | Share premium account | 500 | ||
| 1,300 | 3,500 | Retained profits | 1,700 | 3,900 |
| 4,500 | Capital employed | 5,400 |
| Profit and loss account - Forlorn Sails plc - year ended 28th May 2011 ($'000's) |
|---|
| 2010 | 2011 | |
|---|---|---|
| 19,000 | Sales revenue | 21,600 |
| 13,000 | Cost of goods sold | 14,500 |
| 6,000 | Gross profit | 7,100 |
| 4,350 | Operating costs/expenses | 5,000 |
| 1,650 | Net profit before interest and tax | 2,100 |
| 1,000 | Interest | 1,200 |
| 150 | Taxation | 200 |
| 500 | Net profit after interest and tax | 700 |
| 300 | Dividends | 300 |
| 200 | Retained profit | 400 |

Be warned of a possible confusion in the balance sheet. Net assets is considered by the IB (and other examining boards) to mean the same as assets employed. The definition is therefore given by the formula:
Net Assets = ** Fixed assets plus net current assets (FA + [CA -CL])
However, in published company accounts, long-term liabilities are deducted, making net assets mean the same as net worth (shareholders' funds)
Net Assets = Fixed assets plus net current assets less long-term liabilities
(FA + [CA - CL] - LTL)
If you use this term or they are used in presented accounts in papers or the case study, make sure you are in tune with the IB presentation from the guide.
We will use net assets in the topic to represent assets employed (FA + [CA -CL]).
Capital and revenue expenditure
When drawing up the profit and loss account and balance sheet, it is important to remember the difference between capital and revenue expenditure. Firms raise capital from shareholders and other sources and this is spent on buying premises, plant and equipment etc. The finance raised and the corresponding capital expenditure are recorded in the balance sheet. Other spending takes place on current assets used directly in the production of finished goods, such as raw materials, packing materials and stocks of spare parts. This is called revenue expenditure.
Unfortunately, there are some crossovers between the profit and loss account and the balance sheet which we will examine during this section. The exceptions are shown in italics in the following definitions:
- Capital expenditure - the spending of funds to buy fixed assets with a long life, such as land or buildings. This spending is recorded in the balance sheet, although the depreciation of these assets is included in the profit and loss account as an expense.
- Revenue expenditure - the use of funds to buy current assets, such as stocks, or to pay operating expenses such as salaries and wages. These are recorded in the profit and loss account. However, stocks that remain at the end of the company year are recorded in the balance sheet, because they are assets that can be sold by the business in the next financial year.
Trading and profit and loss accounts
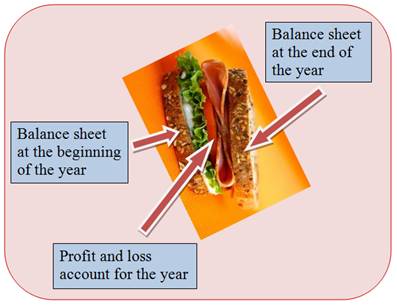 The profit and loss account is shorthand for the full title of 'the trading and profit and loss account'. The purpose of operating a commercial organisation is to make a profit.
This account summarises a firm's trading results for a specific year and shows how the resulting profits were used, or the losses were financed. It is sometimes compared to a 'video' of the year's activities.
It is conventional to give the last year's profit and loss account figures alongside the most recent version to allow for comparison and the identification of trends.
The profit and loss account for a trading year is sandwiched between two balance sheets. The balance sheets provide snapshots at points in time; in this case at the beginning and end of the trading year.
The Format of the Trading and Profit and Loss account
If you would prefer to view this interaction in a new web window, then please follow the link below:
The meaning of profit
When discussing profit, an important question to ask is - which profit? The profit and loss account identifies three types of profit:
Gross profit
This is simply 'sales less cost of goods sold'. For a shop it is the difference between the buying in price and the selling price. It represents the mark-up the shop makes on every unit sold.

Forlorn Yachts sells its product for $50,000 but spends $20,000 on bought in components. Mark up = $30,000 or 150%. Profit = $30,000. Profit margin = 60%.
Net profit before interest and tax (NPBIT)
This is the gross profit with the costs of running the business deducted. These expenses include the costs of labour, services, rents, rates etc., but not interest on loans and company taxation. This is a good basic measure of the performance of a business and is used in performance ratios, because the management have no control of the levels of interest and taxation charged. If tax, was 100%, there would be no profit at all, but this would not be the fault of the management!
Net profit after interest and tax (NPAIT)
Tax and interest are now deducted, leaving a figure of more interest to the shareholder, because this is the pot from which there dividend is paid. In practice, firms are often able to reduce their tax liability by using tax allowances and other methods and employing good accountants.

Why is profit before tax and interest a good measure to base comparisons on? Look at the following example.
| Compare plc - profit performance ($k) |
|---|
| Year | 2008 | 2009 | 2010 | 2011 |
|---|---|---|---|---|
| Sales | 200 | 300 | 400 | 500 |
| Gross profit | 100 | 150 | 200 | 300 |
| Gross profit/sales | 50% | 50% | 50% | 60% |
| Net profit before interest and tax | 50 | 70 | 100 | 200 |
| Net profit before interest and tax/sales | 25% | 23% | 25% | 40% |
| Net profit after interest and tax | 20 | 50 | 20 | 40 |
| Interest | 10 | 5 | 20 | 30 |
| Tax | 20 | 15 | 60 | 130 |
| Profit after interest and tax/sales | 10% | 17% | 5% | 8% |

- Which have been good years?
- What else do you need to know before you can come to any valid conclusions?
Gross profit performance - sales have increased by $100,000 each year. Gross profit is 50% of sales value except for year 2011. Why is this? We do not know, so can only guess (perhaps we should do some deeper research!) Has Compare put its prices up at the expense of sales or have the costs fallen? If it is the latter, is this a result of good buying by Compare, or is it part of a general trend? The main question is - is the improvement in profitability a reflection on compare, or is it really fortunate circumstances? Gross profit is, therefore a measure of the buying efficiency of a firm, or of improving general conditions, or a combination of both. This cannot be used a good basis for judging the performance of a firm as a whole, but it does point towards the effectiveness of the buying and selling process. We still have two more profit figures in the account though.
Profit before tax and interest performance - the first three years show a gradual improvement, but the fourth shows a big increase. This appears to have been a very good year. As this profit has taken account of all revenues and costs, it is a very good measure of the efficiency of the firm.
Profit after interest and tax performance - this shows the effect of interest and tax on a company's profit. It says little about the company, but more about government tax and economic policy. The pattern is very different to that of the 'before profit' data. Look at the tax figures and you see that the tax was increased significantly for the last two years. The firm's performance did not decrease; it was the government imposing higher taxes which made the difference. Therefore, this is not a good measure of efficiency.
So which profit is the most important? It all depends who you are and what information you are seeking. The important thing is that if comparisons are made, they must always use the same profit figure as the base. As we have said, the net profit before interest and tax is the best basis for examining operational efficiency, where the net profit after interest and tax is the measure of greatest interest for the shareholder as determines the sum available for the payment of dividends.
By examining the profit and loss account we have already done some ratio analysis. We will return to more ratio analysis later in the section.
Profit and loss account - interactive graphic
The profit and loss account for Student Computers is shown below:
If you would prefer to view this interaction in a new web window, then please follow the link below:
Balance sheets
It is important to be able to interpret, or 'read' a balance sheet. To do this you will have to know how it is constructed and what the specific terms mean. Again the real meaning of the balance sheet will not be evident unless compared with previous years' balance sheets.
Book keeping works on a simple idea. Any transaction involves a 'giving' and a 'receiving'. If you spend $1 on an ice-cream, you give $1 and receive a good in return worth $1. If you draw up an account to record this transaction the value of the 'giving' side of the account will equal the 'receiving' side of the account. The balance sheet works on the same principle. It shows where the firm obtains all of its funds (sources) and where these funds went (uses). It must, therefore, balance!


The balance sheet represents a valuation of the firm's assets and liabilities at a particular time. It is a snapshot of the business's wealth.

Assets
Assets are anything, tangible or intangible, that is capable of being owned by, or owed to, a business. Assets produce value and have a positive economic value. Assets can be converted into cash (although cash itself is also considered an asset). Tangible assets include current assets and fixed assets.
Examples are land, buildings and stock.

Liabilities
Liabilities are financial obligations, debt or claims on the business. These are anything owed by the business when the balance sheet is prepared. Liabilities can be classified as long-term or current. Examples are mortgages, bank loans and creditors.
We have already discussed in the sources of funds section that there are two sources of funds: equity and debt.
The firm obtains its funds from shareholders (shareholder capital) or borrows them from external organisations such as banks (liabilities). It uses these funds to purchase the factors of production required to produce goods and/or services.
Sources of finance - this explains where the money to fund Net Assets has been sourced including share capital and retained profits.
Below is a sample balance sheet for Student Computers plc which represents the value of the firm's assets and liabilities at the end of the present financial year. The current balance sheet can be compared with the previous year.
Remember, a balance sheet is just a snapshot at a point in time. It is a still picture, which on its own could be misleading or even dangerous. A picture of passengers on the Titanic just before the disaster would have shown many happy and relaxed people, not knowing that the ship was about to hit an iceberg and sink!

Are you able to define the term balance sheet? Write your definition down, and then click on the link to compare your definition with ours'.
Balance sheet - interactive graphic
If you would prefer to view this interaction in a new web window, then please follow the link below:
Uses and limitations of published accounts
We have now explained and illustrated the balance sheet and profit and loss account. It is now time to see how these financial accounts are used and what information can be derived from them, while highlighting their limitations.
Uses of published accounts
This will be examined in depth when we look at ratio analysis in the next section. In more general ways, investors (shareholders) and potential investors will use the accounts to examine the follows:
- Profit utilisation - firms have to give their shareholders an acceptable return on their investment, otherwise they will sell their shares and the market value of the firm will fall. Investors will be interested in the ratio between dividends and retained profits.
- Profit quality - identify any changes in profit and ask where any profit comes from. For instance, identifying whether the profit generated is from improved trading or from the sales of assets.
- Balance sheet strength - to look at the balance between assets and liabilities. What is the cash position and how is cash used? What are the levels of debt and how strong is the liquidity position of the firm? How easily can the firm pay its bills?
- Trends with time - what do a series of accounts, representing several years, say about the business? What trends for sales (turnover) and profits can be identified?
Limitations of published accounts
Accounts are documents required by law, and are open for all to see. Their value is limited, however, as they are prepared with this knowledge in mind. Although, in theory, there can be no secrets in these accounts the accounts show the 'headline figures' rather than the specific detail.
Specific limitations:
- A series of accounts is needed to be able to compare the firm's performance with others. One account, say a single balance sheet, is of virtually no value. It is like one still picture from a 1.5 hour movie. It may be good for advertising, but provides little information that can be used. The investor should have the full set of accounts and notes for a number of years.
- Accounts are in terms of money, and tell you nothing about non-financial matters. This can be vitally important when making decisions. For instance, they tell you nothing about the firm's technology or the ability and skill of the staff in using this.
- The major asset of many firms, its personnel, is not included. This is crucial when looking a firm where the creativity of staff is important. With an advertising agency, for example, its strength depends on its key creative staff. If they leave, the prospects for the firm are poor, even though the accounts (which are historic) may not show this until it is too late.
- Accounts for other firms in the industry are required to enable judgements and comparisons to be made.
- Accounts will be a 'potted truth'; they will not tell all the truth. Firms want to avoid putting too much detailed information in the public domain, as it then becomes available to their competitors.
- Accounts are backward looking (historic). They report what has happened, not what is going to happen. Accounts, when issued, may be up to 6 months out of date. Only management accounts, which are intended for internal use, look forward. These accounts are used as planning and navigation documents for the management and are not available to the general public.
 Window dressing
Window dressing is presenting the accounts of a business in the best possible, or most, flattering way. In public companies, this type of "creative accounting" can amount to fraud.
There are several 'tricks of the trade' - some legal and others not - whereby companies try to make their businesses look more successful than they are. Remember accounts are produced on a single day at the end of the financial year. The position may be different the day before or the day after! The timing of various transactions can be manipulated to influence the appearance of the accounts just before they are prepared.
Why massage the accounts?
- Managers may be on performance bonuses
- To minimise tax liability
- To increase share values - especially if the directors are shareholders
- To disguise the fact that the business is close to insolvency
- To use as a bargaining tool in negotiations with suppliers, customers and employees.
Methods
- Treating revenue expenditure as capital expenditure. Revenue expenditure, like rent is payable in the present year. Capital expenditure, e.g. spending on machinery, can be spread over several years through the process of depreciation. Spreading a payment will increase profit in the current year.
- Selling assets just before the end of the financial year to make it appear that the business is more liquid than it is, e.g. Sale and leaseback where a firm sells some property and then rents it back. This releases funds for the business and improve liquidity, but incurs a long-term liability for the rent. If this is done just before the accounts are due, the firm may seem to have a good cash, or liquidity position, but it now has an additional long-term expense. As a result, long-term profits may be lower.
- Encouraging early debt payments through discounts before the end of the financial year, whilst delaying payment of debts, to improve liquidity. This can be achieved also by delaying purchases for even a week, so this cost does not appear in the present year's accounts.
- Loans may be taken out just before the date of the accounts to improve the liquidity position, but may be repaid a few days later.
- Firms may change the way that they account for items from one year to the next - this may be hidden in the notes to the accounts.
- Inflating the value of intangible assets, such as brands, just after purchase.
Window dressing can amount to fraud if the accounts are simply 'made up'. One of the most notorious business failures of recent years was Enron, which went into receivership when its accounts were discovered to be fraudulent. Its accounting company, Arthur Anderson, which verified the accounts, was also closed down and several of their senior managers were imprisoned.
Depreciation

![]()
Profit is earned at the time that an item is sold. This is when ownership changes from the seller to the buyer, regardless of whether the money has actually changed hands or not.

Profit is rarely held in the form of cash
Capital expenditure goes to the balance sheet, but does not go directly as a cost to the profit and loss account. Look at the following example.
Maze Green Yachts plc
The company buys a new injection-moulding machine for $600,000, which it will use to make parts for its boats for the next 10 years, the estimated life of the machine.
The $600,000 is clearly capital expenditure, so goes to the balance sheet, as does the spending of the cash. This illustrates the principle of double entry and equal and opposite effects. Buying the machine has two consequences. Maze Yachts:
- increases an asset - the injection-moulding machine (fixed assets↑)
- decreases an asset - cash (current assets ↓)
The question is how the cost of the machine should be recorded in the profit and loss account. The cost of the machine should be spread across its useful life, so that a charge is made against profit each year equal to the value of the 'wear and tear' resulting from its use in production. In this case, 10% of its value is added to the costs for each of the next 10 years' profit and loss accounts. Thus an allowance for the purchase of capital items is made using the device known as depreciation.

Depreciation
Depreciation is a non-cash expense (or a non-monetary movement) that reduces the value of an asset as a result of wear and tear, age, or obsolescence. Most assets lose their value over time (in other words, they depreciate), and must be replaced once the end of their useful life is reached. There are several accounting methods that are used in order to write off an asset's cost over the period of its useful life. Depreciation lowers the company's reported earnings, but because it does not involve a cash outflow in the way that other expenses do, so increasing the firm's available cash flow.
Depreciation is effectively subtracted from the balance sheet and added to the profit and loss account as a cost or expense. However, no money actually moves; it is merely an accounting or book entry. Depreciation is an allowance, not a real cost.
Not all fixed assets are depreciated. Over a period of time, property is likely to increase in value or appreciate. Firms deal with this by periodically revaluing these assets in the balance sheet to reflect market or resale value
There are a variety of methods used by firms to calculate the depreciation of fixed assets. However, the two main methods in use are:
- Straight line method
- Reducing balance method
Straight-line depreciation (SLD)
This method, also known as the fixed instalment method, is the most commonly used method of depreciation. It is also the easiest method to understand and calculate.
Once the annual depreciation provision has been calculated, this will remain the same for each year the asset is in use. The formula for calculating the annual rate of depreciation is as follows:
![]()
The scrap value (sometimes known as either residual value or disposal value) will, in most cases be an estimate. It is common, keeping in line with prudence, to have a zero scrap value - due to the uncertainty of any estimate.

Example 1
A delivery vehicle was bought for $25,000. The firm plans to keep it for five years and then trade it in for $3,000 (in effect the trade in value becomes the scrap value).
Example 1 - answer
The depreciation to be charged would be:
![]()
If, after four years, the vehicle had no trade-in value, then the charge for depreciation would have been:
![]()
This amount of depreciation would appear in the profit and loss account as a debit entry (i.e. a charge against the profit) for five years running. The balance sheet value would reduce by the depreciation provision each year for five years. In other words, the balance sheet value of this asset would fall each year by $5,000 for five years running until the assets has no value in the balance sheet - because it has no value to the firm!
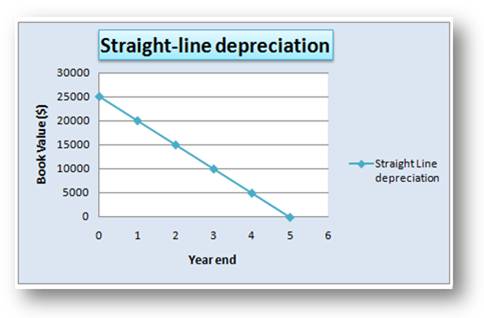
Straight-line as a percentage
It is fairly common to express straight-line depreciation as a percentage. This simply means that a percentage of the original cost of the asset will be charged as the depreciation. For example, if an asset cost $10,000 and depreciation is to be calculated at 10% on cost - this would mean that we should charge 10% x $10,000 ($1,000) as the annual depreciation for each year that we have the asset.
The percentage quoted under the straight-line method will also tell us how long we expect the asset to last, for example:
10% - 10 years
25% - 4 years
20% - 5 years
Reducing (declining) balance method
In this method, the annual depreciation is based on a percentage of the asset's net book value (i.e. what the asset is worth in the firm's accounts). The net book value of an asset is calculated as follows:
Net book value = original cost - accumulated depreciation
As the depreciation charged against an asset builds up over time, the net book value of an asset would decrease. Therefore, although the percentage used in this method remains constant, the depreciation charge (in $) will become smaller, the longer we have the asset.
This method is also known as the diminishing or declining balance method.
The percentage rates chosen for reducing balance may seem as if they are chosen randomly, without any real explanation. However, there is a formula, which takes into account the cost, the scrap value, and the expected lifespan of the assets. This formula calculates the percentage that should be used. We do not include it here because it is not a requirement of the course for you to know the formula and it is, without any doubt, one of the most complicated formulae you would ever be likely to see!
With both methods, there may be variations used. Some firms will charge depreciation for each month that the asset is owned. In this case, an asset bought half way through the year would only have half of one year's depreciation charged for it. Some firms may charge a full year's depreciation for any assets, regardless of whether it was owned for the full year. Some firms will not charge depreciation in the year of sale, or in the year of purchase. Each question should tell you which of these rules the firm is applying.

Example 2
Equipment is bought for $40,000 with a residual value of approximately $6500. The depreciation is to be charged at approximately 30% per annum using the reducing balance method.
Example 2 - answer
The calculations for the first three years would be as follows:
| $ | |
|---|---|
| Cost | 40,000 |
| First year depreciation (30% x $40,000) | 12,000 |
| Net book value after first year | 28,000 |
| Second year depreciation (30% of $28,000) | 8,400 |
| Net book value after second year | 19,600 |
| Third year: depreciation (30% x $19,600) | 5,880 |
| Net book value after third year | 13,720 |
| Fourth year depreciation (30% of $13,720) | 4,116 |
| Net book value after fourth year | 9,604 |
| Fifth year: depreciation (30% x $9,604) | 2,881 |
| Net book value after fifth year | 6,723 |
With this method, the depreciation can continually be charged until the asset loses all of its value. If there is a scrap value for the asset as in this example, this method will depreciate the value down to the scrap value rather than to zero. However, as this shows, it is difficult to find the depreciation percentage to achieve the exact scrap value.
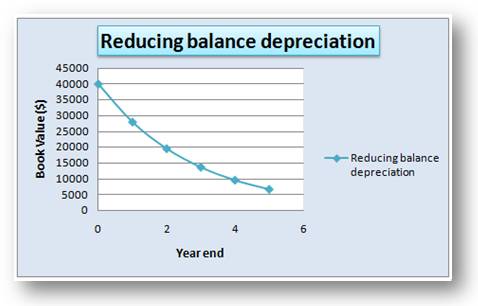

Remember, both methods can be quoted using percentages for the depreciation.
- Straight line is a percentage of the cost of the asset
- Reducing balance is a percentage of the net book value of the asset.
Choice of method
Notice that with the reducing balance method, the depreciation provision per year will start off relatively large and will gradually get smaller. It has been commented that this method of depreciation is superior to the straight-line method, because it is more realistic with asset valuations - assets do lose more of their value in the earlier rather than the later years.
In addition, the total cost of a machine or vehicle is made up not just of the purchase price, but the maintenance costs as well. In the early year when the asset is new, the maintenance costs are low, but the depreciation charge is high. In the later years when the asset is older, the maintenance costs tend to increase, but the depreciation charge falls. So the combined value of depreciation plus maintenance is relatively constant.
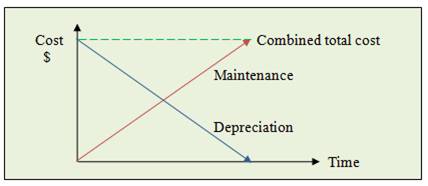
However, the counter-argument is that calculating annual amounts for depreciation should not be primarily concerned with providing realistic values for asset values - it is simply an accounting method of 'spreading' the cost of the asset over its useful life.

Example 3
A firm has just bought a machine for $30,000. It will be kept in use for four years, and then it will be disposed of for an estimated amount of $2,000. The question asks for a comparison of the amounts charged as depreciation using both methods.
Straight-line method: ($30,000 - $2,000) / 4 = $7,000 per annum
Reducing balance method: 50 per cent will be used.
See if you can calculate depreciation using both methods and then follow the link below to see how you got on.
Example 3 - answer
This example illustrates the fact that using the reducing balance method has a much higher charge for depreciation in the early years, and lower charges in the later years.
Also when using reducing balance, unless we use a percentage rate with decimal places, we are unlikely to get exactly to the scrap value at the end of the life of the asset
In theory, it does not really matter which method is selected. With both methods, the full costs of the asset will pass through the profit and loss account over its lifespan, although in each individual year different amounts will appear, depending on which method is selected. In practice this may be important to mimise tax liabilities. In addition, some countries require that one of the methods be used.

Terminal value

It has been assumed so far that an asset has no value at the end of its life. This is often not the case. When an asset has a scrap or terminal value, it is normal to depreciate the asset using a percentage of its net cost (historic cost less scrap value) for every year of its useful life.

A machine is bought for $1,000,000. It has a life of 10 years, when it will be worth $50,000 as scrap. It is depreciated at 10% per annum.
Cost = $1,000,000
Scrap value = $50,000
Net cost = $950,000 Depreciation = $95,000 per annum.
A car is purchased for the Managing Director for $65,000. It has a life of 4 years, when the car will have a resale value of $15,000. Depreciation rate = 25%
Cost = $65,000
Resale value = $15,000
Net cost = $50,000
Depreciation = $12,500 per annum

Revaluation

Revaluation rather than depreciation
Some assets do not depreciate, they appreciate with time. Works of art and antiques are well known, but land and buildings are examples of industrial items where appreciation is common.

Intangible assets

Recording tangible assets in the balance sheet is relatively straightforward, but the treatment of intangible assets is more problematic.
Intangible assets
Assets are things of value. The value should be a matter of fact or, at least, a commonly accepted valuation. The value should be objective. Tangible assets, such as land and buildings are real and touchable and have a market value that can be generally agreed.
Intangible assets are non-physical assets. However, they have value, and indeed may be the most valuable asset a firm possesses. Brand names are the prime example. The Coca Cola brand name is virtually priceless. It is one of the best known symbols in the entire world. Putting an exact value on an intangible asset can be extremely difficult and cannot normally be established until it is sold. However, intangible assets are rarely sold (they are not normally intended to be sold) and in some cases the asset cannot be sold.
Intangible assets appear in the balance sheet in the Fixed Asset section. They include:
- Goodwill. Goodwill represents the good name and reputation of the business, its public image and customer base and its existing products. Goodwill can only arise when a business is sold because it is the difference between what was paid for the business by the acquiring firm and the book value of the assets.
Example: A bar is purchased for $500,000 as a 'going concern'. The price includes:
Buildings and land - $250,000. This value is established by reference to a Land Agent.
Stock and fitting - $50,000. A value established and accepted by an external surveyor.
Goodwill - $200,000. An extra charge decided by the seller to reflect the value of the reputation, future profits and existing customer base.
The value of goodwill is what the buyer is prepared to pay, over and above the value of the assets. Goodwill is not guaranteed into the future; customer loyalty for instance can be lost almost overnight and reputation only exists if the firm remains a going concern. The value of the goodwill simply represents an estimation of a range of intangible factors... and consequently accountants, who are prudent people, really do not like it and want to remove from the balance sheet as soon as possible! Often shareholders will question the amount paid for goodwill.
Note however, that the firm is generally not allowed to include the value of its own goodwill on the balance sheet, except when it has been recently acquired by another business. There is a problem with this as it may severely undervalue the business and so does not provide a 'true and fair view' of the net worth of the business.
- Patents and copyrights. Firms want to protect their intellectual property rights to allow them to profit from their ideas and inventions. Patents are legal documents designed to protect an invention against copying by other businesses for up to 20 years. Copyrights are similar to patents, except that protect the ideas of authors, artists and composers. Fees can be charged if other companies or individuals wish to use these ideas. Alternatively, patents and copyrights can be sold completely. The value of patents and copyrights can be significant and the argument is, therefore, that these valuable assets should be recorded on the balance sheet.

Singer-songwriter, Crystal Cartier, sued Michael Jackson and others for an alleged infringement of her song "Dangerous" copyrighted July 18, 1991. However, in this case, the jury returned a verdict in favour of the defendants, stating that there were significant differences in the works.
- Trademarks and brand names. Trademarks are a visible representation of the firm and may be in several forms such as symbols, images and logos. These are instantly recognisable and provide a shorthand identity for what a firm stands for. Examples include the three stripes of Adidas or the 'Golden Arches' of McDonalds. They generate significant sales and therefore firms will protect trademarks through registering them. Trademarks can be sold. Brand names have as similar value and function and will also be protected.
In conjunction with The Financial Times, Bloomberg and Datamonitor, Millward Brown Optimor developed the BrandZ Top 100 providing a guide to the value the 100 Most Powerful Brands and showing changes in values over a number of years. The Top 100 total $2.04 trillion in brand value, which means that in the past five years, since the ranking was first published in 2006, the brand value of the Top 100 has grown by a more than 40%.
A summary of the top 14 brands by value is given below. Google and IBM are the top 2 brands by value in 2010. Google's brand is estimated to be worth $bn114.26 and the IBM brand $bn 86.38.
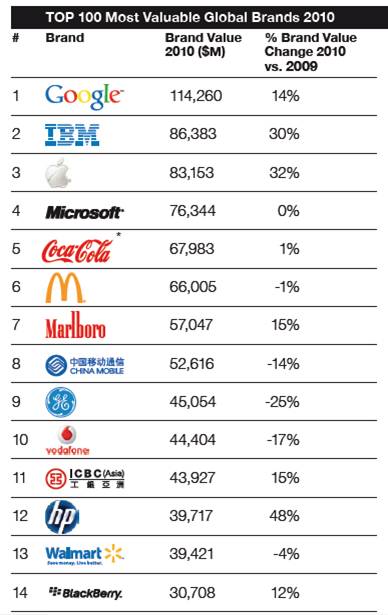

If you wish to download a pdf of the 2010 report showing all of the top 100 brands, please click on this link.

Intangible assets - example
Goodwill - if you buy a shop, hotel or pub you will be asked to pay for the assets, and more. This extra is called goodwill, and is essentially the price paid to buy the future profits of the firm. This cannot be valued or even guaranteed; you have to judge if it is worthwhile. Having paid it, is it an asset that should go into the balance sheet? It can be misleading to do this as it inflates the net worth of the business. As a consequence, many firms write goodwill off as a loss.
Look at the following example. Both firms start from the same point and buy an asset, a restaurant, and pay $500,000 for it, including $200,000 goodwill. Firm A includes the transaction using intangible assets; the other has the product policy of writing off such payments in the year that they occur. The two balance sheets are as follows:
| Balance sheet - A and B Company year ended 1st April 2011 ($k) |
|---|
| Start | Firm A | Firm B | |
|---|---|---|---|
| Fixed assets - tangible | 12,000 | 12,300 | 12,300 |
| Fixed assets - intangible | 0 | 200 | 0 |
| Current assets - cash | 2,000 | 1,500 | 1,500 |
| Current assets - others | 3,000 | 3,000 | 3,000 |
| Current liabilities | 2,000 | 2,000 | 2,000 |
| Long-term liabilities | 3,000 | 3,000 | 3,000 |
| Net capital employed | 12,000 | 12,000 | 11,800 |
The difference is the goodwill, considered by B as a loss.
| Financed by: | |||
|---|---|---|---|
| Shares | 6,000 | 6,000 | 6,000 |
| Retained profits | 6,000 | 6,000 | 5,800 |
| Total | 12,000 | 12,000 | 11,800 |
Company B will have to make profits in the future and retain them to get the goodwill back. It is being wise and prudent. Company A, on the other hand, is 'counting its chickens'; it is assuming profits in advance. Not wise, and is contrary to accounting standards in many countries.
Dyson lose patent case

Read the article Dyson may appeal court's decision over design infringement and then have a go at the questions below. You can either read the article in the window below, or follow the previous link to open the article in a new window.

You may also like to read the following article to support your answers:

Question 1
Define the terms:
- Patent
- Copyright.
Question 2
Explain why patents and copyrights are particularly important to technology companies like Toyota and Dyson.
Question 3
Discuss whether Toyota and/or Dyson should include intangible assets in their balance sheets.

Stock (inventory) valuation

 For many firms, the value of stock can represent a large proportion of its asset value, which means that valuing it accurately in the balance sheet is very important.
Stock is often purchased in batches, and because the market tends to fluctuate significantly, especially in the case of commodities, it is not unusual for a firm to pay varying amounts for stock which may make it more complex to value unsold stock. If we can identify each unit of stock then we could apply the relevant cost price. However, some stocks will be very hard to distinguish - the goods may be very uniform and we may not be able to tell which stocks were purchased when. For example, with coal or oil purchased on different dates we would not be able to distinguish between different purchases. The firm is unlikely to keep separate purchases in different areas of the firm and it would be time consuming for firms to keep track of every purchase. This means that the stock left over at the end of the period may have been purchased on several different occasions.
If there is any stock left at the end of the trading period, then which cost price should we use for the valuation? Should we use the earliest cost we paid, or should we use the latest cost price that was paid? The underlying concept is that we should refer to the concept of prudence (lower of cost or net realisable value), but if there are different cost values then we need a method of deciding which cost value to use.
In stock valuation there are two major methods used. These are as follows:
- FIFO (First In, First Out method)
- LIFO (Last In, Last Out method)

Example
We will use the following data to calculate the value of the closing stock at the end of January 2011 using each of the three methods for stock valuation.
Then we can draw up the trading accounts under each method to see what the gross profit is for the month. Note that the selling price of the stock is irrelevant as far as the stock valuation is concerned. We only concern ourselves with the selling price when drawing up the trading account.
| Bought | Sold |
|---|
| 2011 | $ | 2011 | $ | ||
|---|---|---|---|---|---|
| Jan 5 | 20 units @ $20 each | 400 | Jan 11 | 12 units for $35 each | 420 |
| Jan 18 | 10 units @ $25 each | 250 | Jan 24 | 9 units for $38 each | 342 |
| 650 | 762 |
Method 1 - First in, first out method (FIFO)
This method assumes that the stock used in a transaction (e.g. a sale) will be the earliest stock purchased. The first stock into the firm is the first stock to be issued. Any stock remaining at the end of the period will be the most recent purchases.
| Date | Bought | Issued | Stock held after transaction | ||
|---|---|---|---|---|---|
| 2011 | $ | $ | |||
|
Jan 5 |
20 units @ $20each | 20 units@ $20 | 400 | ||
|
Jan 11 |
12 units @ $20 each |
8 units@ $20 |
160 |
||
| Jan 18 | 10 units @ $25 each |
8 units @ $20 10 units @ $25 |
160 250 |
410 |
|
| Jan 24 |
8 units @ $20 each 1 unit @ $25 each |
9 units @ $25 |
225 |
Method 2 - Last in, First out method (LIFO)
This method assumes that the stock used in a transaction (e.g. a sale) will be the most recent stock purchased. The last stock into the firm is the first stock to be issued. Any stock remaining at the end of the period will be the earliest purchases.
| Date | Bought | Issued | Stock held after transaction | ||
|---|---|---|---|---|---|
| 2011 | $ | $ | |||
|
Jan 5 |
20 units @ $20each | 20 units@ $20 | 400 | ||
|
Jan 11 |
12 units @ $20 each |
8 units@ $20 |
160 |
||
| Jan 18 | 10 units @ $25 each |
8 units @ $20 10 units @ $25 |
160 250 |
410 |
|
| Jan 24 | 9 units @ $25 each |
8 units @ $20 1 unit @ $25 |
160 25 |
185 |
The closing stock values at the end of January are as follows:
FIFO $225
LIFO $185
Impact of stock valuation on final accounts
The final accounts will be affected in the following way:
| Trading account for month ended 31 January 2011 |
|---|
| FIFO | FIFO | LIFO | LIFO | |
|---|---|---|---|---|
| $ | $ | $ | $ | |
| Sales | 762 | 762 | ||
| Less Cost of goods sold | ||||
| Purchases | 650 | 650 | ||
| Less Closing stock | 225 | 425 | 185 | 465 |
| Gross profit | 337 | 297 |
As long as the method is consistently applied (used year after year), then the effects on the final accounts will cancel each other out over time. This is because the closing stock in one year will become the opening stock the year after.
Advantages and disadvantages of each method
| FIFO |
|---|
| Advantages | Disadvantages |
|---|---|
| It is probably the method that would be used if intuition was called for | In times of rising prices it shows higher profit figures earlier - which is not prudent |
| It is allowable for taxation by many tax authorities | |
| It is legally acceptable under accounting standards in many countries |
| LIFO |
|---|
| Advantages | Disadvantages |
|---|---|
| Issues of stock are valued at the most recent prices | The balance sheet contains out of date values for stock |
| It is often not allowed for taxation purposes or by accounting standards in many countries |

3.5 Final accounts - questions
In this section are a series of questions on the topic - Final accounts. The questions may include various types of questions. For example:
- Self-test questions - on-screen questions that give immediate marking and feedback
- Short-answer questions - a series of short-answer questions to help you check your understanding of the topic
- Case study - a case study with associated questions
- In the news - questions based around a topical business news article
Click on the right arrow at the top or bottom of the page to work through the questions.
Final accounts - short answer questions

Question 1
Explain the main reasons for incorporated firms preparing and publishing financial accounts.
Question 2
Identify the owner of funds used by a plc within its business.
Question 3
Define the term 'company year'.
Capital and revenue expenditure - short answer questions

Question 1
Explain the difference between capital and revenue expenditure.
Question 2
Consider the following list of expenses incurred by a company. Examine this list and determine if each expense is revenue or capital expenditure.
A. Purchase of a motor car
B. Claim for a meal
C. Purchase of shares in a supplier
D. Purchase of a new computer
E. Payment for hotel accommodation
F. Receipt for petrol
G. Purchase of raw materials
H. Purchase of an autoclave
I. Purchase of a set of spanners
J. Payment of an insurance premium
K. Wages
L. Purchase of a new plot of land.
Profit and loss accounts - short answer questions

Question 1
Define the term 'depreciation' and explain why it is recorded in a P&L Account.
Question 2
Define the term 'appropriation account' and explain what it shows.
Question 3
Explain whether it is possible for a dividend ever to be bigger than the profit before tax.
Question 4
Can gross profit be positive and trading profit before tax negative?
Question 5
Explain whether profit is always in the form of cash that is available to spend.
The profit and loss account - numerical questions

Question 1
Solway Gliders plc has just set up a new office in Brussels. It purchased a new computer system and software. However, the computer system crashed following a power surge and some of the data was lost. The latest version of their profit and loss account is shown below, but it has some gaps. Your task is to calculate the figures that should be in these gaps and then to complete the account.
| Profit and loss account - Solway Gliders plc year ended 31st May .... ($'000's) |
|---|
| 2010 | ....... | |
|---|---|---|
| ...... | Sales revenue | 3,000 |
| 800 | Cost of goods sold | ...... |
| 1200 | Gross profit | 1,800 |
| ..... | Expenses | 800 |
| 80 | Depreciation | 150 |
| 400 | Net profit before interest and tax | ..... |
| 50 | Interest | 150 |
| 30 | Taxation | 80 |
| ..... | Net profit after interest and tax | ...... |
| 50 | Dividends | 135 |
| ..... |
Retained profit (to balance sheet) |
....... |
When you have completed this task, identify the changes between the two years and provide an explanation for them.
Question 2
From the following balances from the books of Fox Ltd, draw up a trading and profit and loss account for the year ended 30 June 2011.
| $ | |
|---|---|
| Sales revenue | 56,798 |
| Cost of goods sold | 32,532 |
| General expenses | 8,450 |
| Sundry expenses | 1,845 |
| Advertising | 2,378 |
| Electricity costs | 1,650 |
| Rent received | 1,240 |
| Machine repairs | 2,100 |
| Insurance | 3,400 |
| Wages | 17,645 |
Balance sheets - short answer questions

Question 1
Distinguish between fixed and current assets.
Question 2
Explain why debtors are an asset to a firm.
Question 3
If a bank lends money to a firm, explain whether this loan is an asset or liability for the firm.
Question 4
Distinguish between tangible and intangible assets.
Question 5
Distinguish between ordinary shares and debentures.
The balance sheet - report

Produce a memorandum with advice as to which section of the balance sheet the following items should appear. Reasons should be given in support of each choice:
- Purchase of new equipment
- Cars purchased for resale
- Bank overdraft
- Car purchased taken for private use by owner of firm
- Depreciation
The balance sheet - numerical questions

Question
Solway Gliders plc has just set up a new office in Brussels. It purchased a new computer system and software. However, the computer system crashed following a power surge and some of the data was lost. The latest version of their profit and loss account is shown below, but it has some gaps. Your task is to calculate the figures that should be in these gaps and then to complete the account.
Comment on your findings.
| Balance sheet - Solway Gliders plc as at 28th May ..... ($'000's) |
|---|
| 2010 | 2010 | ......... | ......... | |
|---|---|---|---|---|
| Fixed assets (FA) | ||||
| 250 | Land | 250 | ||
| 350 | ......... | 480 | ||
| ..... | Plant and equipment | .... | ||
| 350 | Furniture and fittings | 385 | ||
| 200 | 1600 | Vehicles | 220 | 2495 |
| ....... ...... (CA) | ||||
| 350 | Stock | .... | ||
| .... | ....... | 345 | ||
| 220 | Cash | 135 | ||
| 720 | 880 | |||
| less Current liabilities (CL) | ||||
| 100 | Creditors | 200 | ||
| ... | Short-term loans (under 1 year) | .... | ||
| 200 | Overdrafts | 150 | ||
| ... | ... | |||
| ... | Net current assets | 330 | ||
| 1880 | Net assets | .... | ||
| Financed by: | ||||
| Capital and reserves | ||||
| 500 | Share capital | 500 | ||
| .... | ..... | Retained profits | ..... | ..... |
| Long-term liabilities (LTL) | ||||
| ... | Mortgages | .... | ||
| 400 | 900 | Long-term loans (over 1 year) | 750 | 1250 |
| .... | Capital employed | .... |
Depreciation - short answer questions


Question 1
Explain the process of straight-line depreciation.
Question 2
Explain the term 'revaluation reserve'.
Question 3
Explain why firms include depreciation in their accounts.
Question 4
A company purchases a new refrigerated articulated delivery vehicle for $120,000. It is to be depreciated over 4 years, when it will have a residual value (resale value) of $20,000. What will be the written down book value of the vehicle after two years of use?

Depreciation - numerical questions


Question 1
The manager of Collison Ltd has purchased a new price of equipment to help speed up the production line. The equipment cost $50,000 and is expected to last for five years. At the end of this period the equipment can be traded in for the value of $4000.
Required
You are required to calculate the depreciation for each year on the asset using both straight line and reducing balance methods. Show the net book value for the van at the end of each of the 5 years for each method (assume that 40% is to be used for the reducing balance method).
Question 2
Fiona Palmer, a sole trader purchases a delivery van for the sum of $12,000. It has as estimated life of 6 years and a trade-in value of $3,000.
Required
You are required to calculate the annual depreciation on the van using both straight-line and reducing balance methods.
Show the balance remaining - the net book value - on the van at the end of each of the 6 years for each method (assume that 20% is to be used for the reducing balance method).

Company accounts - interactive questions

1 |
Working capitalWorking capital is |
2 |
DebtorsDebtors are people and / or firms which: |
3 |
CreditorsCreditors are |
A balance sheet shows the reserves of a company. They are found in the section entitled 'Financed by:' and may also be called retained profits. An extract from the balance sheet of Pill Pharmaceutical plc is shown below:
| Financed by: | ($k) |
|---|---|
| Share capital | 500 |
| Retained profits | 3,500 |
4 |
Financing expansionThe company is spending $2 million on a new office complex. Why might it not be able to finance this expenditure from these reserves? |
Forlorn Holdings plc
On 1st January 2011 Forlorn Holdings buy a new computer for $1500 and a new car for $25,000.The Tax Department allows the computer to be depreciated, using straight line methods only, at a rate of 25% per annum and the car at 40% per annum.
Forlorn Holdings plc has a business year that ends on 31st December.
5 |
Straight-line depreciationIn straight line depreciation, the book value of the item being depreciated in the accounts: |
6 |
Written-down book valueThe written down book value of the computer after 1.5 years will be: |
7 |
Written-down book valueThe written down book value of the vehicle after 2.0 years will be: |
8 |
Depreciation entryThe depreciation entry in the accounts for the year ended 31st December 2012 for these two items will be: |
9 |
DepreciationDepreciation is shown in the profit and loss account, and is reflected in the balance sheet. It is not a sum of money, however, nor does any cash ever move. This is because, in accounting terms, depreciation is: |
10 |
Balance sheetWhat does a balance sheet tell you about a company? |
11 |
Company accounts - rebuild a set of accounts

CheapSkate plc has just completed their year's trading and produced the following figures. Using the data below construct the balance sheet and the profit and loss account for the company. All the figures are included and if placed in the correct order and location should ensure the accounts balance. The end of the financial year is March 31st.
N.b. dividends, interest and taxes have not yet been paid.
| Overdrafts | 50 |
| Net Profit after interest and tax | 200 |
| Costs of goods sold | 2500 |
| Dividends | 100 |
| Sales revenue | 5000 |
| Reserves | 1550 |
| Net profit before interest and tax | 400 |
| Net current assets | 150 |
| Capital employed | 2400 |
| Debtors | 250 |
| Gross profit | 2500 |
| Cash | 100 |
| Stock | 250 |
| Plant | 1200 |
| Debentures | 50 |
| Nets assets | 2400 |
| Share capital | 500 |
| Buildings | 500 |
| Taxation | 100 |
| Creditors | 200 |
| Interest | 100 |
| Retained profit | 100 |
| Motor vehicles | 250 |
| Bank loans over one year | 200 |
| Expenses | 2100 |
| Furniture and fittings | 300 |
| Net current assets | 150 |
After you have prepared your answers, follow the links to the balance sheet and profit and loss account below to check your answers.
Balance sheet
Profit and loss account
Uses and limitations of published accounts - memorandum

Produce a short memorandum outlining three uses that the board of directors would make of the profit figures available.
Ensure that the memorandum follow the format:
To:
From:
Date:
Subject:
Stock valuation - numerical questions


Question 1
From the following figures for the month of January, calculate the closing stock in trade that would be shown using FIFO and LIFO.
| Bought | Bought | Sold | Sold |
|---|---|---|---|
| January 4 | 20 at $12 each | January 13 | 18 for $34 each |
| January 11 | 25 at $15 each | January 22 | 9 for $30 each |
Question 2
From question 1, draw up the trading account for the year showing the gross profits that would have been reported using FIFO and LIFO.

GM - are they losing it?
Read the article GM records second-biggest loss in US corporate history with $39bn deficit and then have a go at the questions below. You can either read the article in the window below, or follow the previous link to open the article in a new window.

Question 1
Define the terms 'balance sheet' and 'emerging markets'.
Question 2
Explain what is meant by "..... writ[ing] off the value of billions of dollars worth of tax credits".
Question 3
Analyse two reasons for the $39bn loss made by General Motors.
Question 4
Evaluate two strategies that the company could adopt to try to return to profitability.
Between a Rok and a hard place.
Read the article Rok profits halve after accounting problems and then have a go at the questions below. You can either read the article in the window below, or follow the previous link to open the article in a new window.


Question 1
Describe the purpose of the Sarbanes-Oxley Act.
Question 2
Explain why there is not always a direct link between the level of profit a company makes, and the dividend it announces.
Question 3
Companies such as Enron, WorldCom and Tyco covered up, or misrepresented, a variety of questionable transactions. Examine the purpose and role of accounting practices and how Rok's accounts did not provide a 'true and fair view' of their business.
Question 4
Accounts are a story in numbers. Using Rok as an example, discuss the view that the accounts of a company provide a good starting point to understand and investigate the performance of a business.
Toyota out of reverse gear
Read the article Toyota Raises Profit Forecast as U.S. Sales Recover, Asia Gains
and then have a go at the questions below. You can either read the article in the window below, or follow the previous link to open the article in a new window.

You may also like to read the articles:

Question 1
Define the terms:
- profit margin
- exchange rate.
Question 2
Explain the principal factors that had led to falling profits at Toyota in the previous quarters.
Question 3
Analyse the effect of the exchange rate on sales and profits at Toyota.
Question 4
Evaluate the strategies adopted by Toyota to try to improve their profitability.
Extension activity
With reference to Toyota's reliability problems, discuss the importance of goodwill to Toyota and its financial performance.
3.5 Final accounts - simulations and activities
In this section are a series of simulations and activities on the topic - Final accounts.
DragIT - Build a profit and loss account
 Maze Green Yachts have had a major crash of their computerised accounting software and their profit and loss account is only partially complete. Drag the figures on the right onto the profit and loss account in the appropriate places to build the profit and loss account for Maze Green Yachts for the year ended December 31st 2010.
If you get stuck, you may find the hints below helpful. Once you have built the profit and loss account you may like to have a go at the questions below.

1 |
Profit and loss termsMatch the definitions/descriptions below with the terms to which they refer. |
2 |
DragIT - Build a balance sheet
Maze Green Yachts have had a major crash of their computerised accounting software and their balance sheet is only partially complete. Drag the figures on the right onto the balance sheet in the appropriate places to build the balance sheet for Maze Green Yachts as at December 31st 2010.
If you get stuck, you may find the hints below helpful. Once you have built the balance sheet you may like to have a go at the questions below.

1 |
Balance sheet termsMatch the definitions/descriptions below with the term to which they refer. (N.B. You may find it helpful to refer to the completed balance sheet above) |
2 |
TryIT - Accounting at Maze Green Yachts
 Now that you have looked at basic accounting issues, why not have a look for yourself and see how a firm produces their accounts.
In the window below is the Maze Green Yachts online business simulation. In this, you get to see how well you can run a major international yacht manufacturer.
To test how Maze Green account for their yachts and work out their financial performance, go to the Maze Green business simulation (you can either do this in the window below or you can open it in a separate window by following the previous link).
If you are asked for a username and password, please check with your teacher/lecturer.
Try running the simulation for a few quarters and then have a look at the financial results that are produced. Make sure you understand all the terms in the results and then consider the questions/issues below.

Question 1
Identify three examples of variable costs that Maze Green will be likely to pay when producing their yachts.
Question 2
Identify three examples of fixed costs that Maze Green will be likely to pay when producing their yachts.
Question 3
Identify any examples of semi-variable costs that you would expect Maze Green's costs to pay.
Question 4
Identify the level of cash the company currently have available and how much this increased/decreased, since you started running the simulation. How has the level of short-term loans changed?
Question 5
If Maze Green Yachts are short of cash, examine possible sources of finance available to them.
Question 6
Try running the simulation and progressively reducing the amount you produce of each yacht. Identify the break-even output.
Now try running the simulation for the full period and attempt to maximise the level of profit. How much profit did you manage to make overall?
Try again with a slightly different set of strategies. Did you manage to make more profit? Which run worked better? Assess which strategies worked best and why.
3.6 Ratio analysis - notes
In the previous sections we looked at sources of finance and their suitability, used different methods of investment appraisal, defined working capital and prepared cash flow forecasts and explained the importance of budgets and calculated variances. We then constructed and explained final accounts and examined depreciation methods, intangible assets and stock valuation. We now move on to look at ratio analysis.

By the end of this section you should be able to:
- Calculate ratios
- Use the ratios to interpret and analyse financial statements from the perspective of various stakeholder

- Evaluate possible financial and other strategies to improve the values of ratios
Ratio analysis
 We have examined the purpose, layout and content of the balance sheet and profit and loss account. We have said that these documents contain a story of the business bit that this story is sometimes difficult to reveal. We need to find some way of bringing this information to life and to provide answers to stakeholders on a whole series of questions about the performance, efficiency and liquidity of the business. We can do this through the use of financial ratios. A ratio is simply a mathematical relationship between one figure and another. Financial ratios are relationships between quantities taken from the accounts.
Single balance sheets and profit and loss accounts tell us very little. If we are told that sales this year were $20m and profit rose to $5m, this information has limited meaning expressed as it is in absolute terms. What we want is some way to provide a relative comparison. Financial ratios offer a tool to do this, but are only of significant use when they are compared to other ratios. In practice, comparison will be between different years and between the firm and its competitors or industry averages (inter-firm comparisons). However, it is important that any comparison is between similar organisations. Comparing ratios of the local grocer's shop with multinational supermarkets will have little practical use.
What we are hoping to reveal are trends in performance or contrasts with similar organisations that may require further analysis. Ratios should help decision-makers and provide the information to set future policy
To help us understand more about the firms we are studying, we will be examining specific groups of ratios, namely:
- Profitability ratios examine profit in relation to other figures
- Liquidity ratios identify the ability of a firm to pay its current liabilities
- Financial efficiency ratios provide information on how effectively resource are used in the business
- The gearing ratio shows the long-term liquidity position of the business
- Shareholders ratios measure the returns to shareholders

These ratios are of interest to different groups of people. Who might be Interested Parties?

In Business and Management examinations you will be provided with the formula for all of the ratios, so you do not need to memorise them. However, the skill is in interpreting the ratios, rather than calculating them
In the following sections we will also examine the limitations of ratio analysis
Profitability ratios
Making profit is the main purpose for most business organisations, but what level of profit is acceptable?
Stakeholders look at profit for a number of reasons, but primarily to see if their investment is worth it. There are alternatives, such as depositing funds in the bank, so profit has to be compared in some way with bank interest.
Profitability brings together the two main accounts, the balance sheet and the profit and loss account. The P&L account gives the quantity of profit, in money terms. The balance sheet enables it to be expressed as percentages.
We have two terms to remember here,
- Profit
- Profitability

Write down the definitions of profit and profitability. See if you can explain the difference, then click Profit to compare your answer with ours.
Profit is shown in the profit and loss account in a number of ways. Profitability ratios show how profitable a firm is.
Profit margins
We can compare profits with sales revenue in two main ways:
Gross Profit margin.
This ratio compares the gross profit achieved by a firm to its sales revenue; in other words the percentage of the selling price that is gross profit and available to pay for the firm's overheads. The figure is expressed as a percentage. A figure of 20% is a benchmark for most industries, but will vary from industry to industry. Gross profit margin is basically the firms mark up on the items it buys in.
![]()
Firms that can turn stock over quickly may operate with relatively low gross profit margins. For example in a hypermarket, the gross profit margin on clothing is higher than on food sales.
If the ratio is falling over time this could be because of failing to pass on increases in the cost of sales to customers in higher prices or a change in the mix of goods on sale to lower margin products. A firm may improve its margin by reducing the direct costs of sales (possibly by buying in bulk or changing suppliers) or by increasing price. However, increasing prices may lead to a significant fall in sales volume if customers are price sensitive
Net profit margin
This ratio calculates the percentage of a product's selling price that is net profit. Again it is expressed as a percentage. It may be regarded as a better measure of a firm's performance than gross profit margin as it includes all of the firm's operating expenses. It measures how successful the firm is in controlling its expenses. A higher percentage is, therefore, preferable. This may be achieved by raising sales revenue, while maintaining existing expenses levels or simply reducing expenses.
![]()
A comparison of the two profit margins can raise questions about management efficiency. If, for instance, the gross profit was improving at the same time as the net profit margin declined, this would point to poor control of expenses (or increasing overhead costs) as an issue worthy of investigation.

REMEMBER: profit and cash are not the same.
Interpretation of profitability ratios
As always with ratios, you need a series of ratios and the equivalent data for other firms in the same industry to be able to make useful comparisons. You must also be sure which profit has been used to calculate the ratios. Remember, a firm may well make a gross profit, but this may become a loss when the value is converted to trading profit.
It is also useful to have the interest rate to hand, as this puts rates of profit into perspective. Is the return the firm is making more than the existing market rate of interest? In fact, the more you know about the state of the economy and how it has changed over the period of your comparisons the better.
Interpretation is all about trends and comparisons in context.
Improving the ratios
Profitability ratios are symptoms, so improvements in themselves mean little.
Profit margins can change in different ways as the result of a single action. Imagine the following scenario:
A firm reduces the price of its product and increases sales revenue as a result. The costs and expenses of the firm remained unchanged. The gross profit margin will fall, but the net profit margin will rise.

Calculation of ratios

Follow the link below to get the balance sheet and profit and loss account for Student Computers plc and use them to work out the gross profit margin and net profit margin ratios - it will be good practice. Jot down some notes on how well the firm has performed and the difference between the ratios. Once you have had a go, and then follow the answer link below to see how you got on. N.B. Calculate the ratios for both years to compare them.
Balance sheet and profit and loss account - Student Computers Plc
Answer - gross profit margin and net profit margin calculation
Profitability - examples

Supermarkets and fine art dealers
Profit and profitability vary considerably from industry to industry. Consider the example of a national supermarket, and a New York Fine Art Gallery. They differ in many ways shown in the table below
| Supermarket chain | Fine Art Dealer | |
|---|---|---|
| Turnover | Very high | Low |
| Profit to sales | Low | High |
| Capital employed | Low | High |
| ROCE | High | Low |
How well is each one doing? We need to see many accounts, plus information for other firms in the same industry. All ratios are relative.

Data
Now really is the time for you to go and collect some data. Work on the web and find the profitability ratios for as many firms as you can. One possible source to get hold of the ratios and some practice is the Biz/ed ratio analysis section. Pick ones in a range of industries. The shares page in a good newspaper will also give you a lead. Use their headings; there are many of them.
Liquidity ratios - introduction
 Liquidity ratios are concerned with the short term financial health of the business and whether the working capital of the business is being managed effectively. Working capital is the lifeblood of an organisation. Too little working capital and the firm may not be able to pay all of its debts, and ultimately this may result in closure. Too much working capital and the business may not be making the most efficient use of its financial resources for expansion.
Liquidity is the ability of a firm to meet its liabilities, to pay its bills. A firm is liquid if it can pay its bills, illiquid if it cannot. A firm may be illiquid for a time, but it may not matter. However, at another time a moment's lack of liquidity may be critical. It all depends (that phrase again!) which bill it is that the firm has to pay. The banks and the government pose the greatest problems, and particularly the government, as these payments are unavoidable. Thus there are some critical creditors who the firm must pay on time.
There is little liquidity information in the profit and loss account, but the balance sheet is more valuable. Liquidity is a short-term matter and can change very quickly, so it is always worth remembering that the balance sheet is simply a snapshot at a particular time.
Now, let's look at the balance sheet. The firm will have to meet its liabilities some time, but the current liabilities are the most important. As a reminder, current liabilities are:

Creditors
These are people, firms and organisations to which the firm owes money. Some are more important than others. The critical creditors are probably the tax authorities (which collect company tax, employees income tax and sales tax) and the banks. Payments are due on a set day, and failure to pay may lead to the closure of the firm.
Overdrafts
These are short-term borrowings from banks. Firms often use this as a means to make up for working capital shortages. They generally have to be cleared within 6 months.
Short-term loans
If these are from banks they have to be paid. If the firm is reliable enough it may be able to re-organise an overdraft or short-term loan into a long-term loan.
On the other hand, the firm has its current assets to help it pay its bills. A reminder that current assets are:
Cash
Clearly very useful for paying bills as it is the most liquid of funds.
Debtors
These are people or organisations, who owe the firm money. They should pay within the present financial year, depending on the credit terms given by the firm. They can be turned into cash quickly if it is necessary. The bills can be factored, that is sold to a firm, which will collect the revenue when they become due. Obviously, factoring companies will only pay a percentage of the value of the debts. Debtors are relatively liquid compared to other assets, but are not as good as cash.
Stock
These are assets of the firm and can, theoretically, be sold to raise cash. In reality, however, this may not always be the case. They may be out of season, unfashionable or even obsolete. They may not even be finished goods. Other firms or customers may not want them, and even if they do, only at a relatively low price. Stocks are considered to be the least liquid of the current assets.
There are two liquidity ratios:
- Current ratio
- Acid test ratio
Current ratio
One of the most universally known ratios, the current ratio reflects the working capital position and indicates the ability of a business to pay its short-term creditors from the realisation of its current assets, without having to resort to selling any of its fixed assets.
The current ratio is simply the ratio of all current assets to current liabilities. In other words:
![]()
![]()
Ideally the figure should always be greater than 1, which would indicate that there are sufficient assets available to pay liabilities, should the need arise. The general rule of thumb is that the figure should lie between 1.5 and 2.0. In other words, for every $1 of debts the firm will have between $1.50 and $2 in current assets to pay for this. The higher the figure the more liquid the business, but too high a figure may indicate that the firm is not investing sufficiently in higher earning assets.
In retail and manufacturing it would be expected that the current ratio would fall between1.1 to 1.5. Generally where credit terms and large stocks are normal to the business, the current ratio will be higher than, for example, a retail business where cash sales and high stock turnover are the norm.
The problem with the current ratio is that it includes stock, which may include slow moving or redundant stock that is not liquid at all. Accepting that stock is a liquid asset assumes:
- That a buyer is available. If the product is out of date then perhaps nobody else wants them.
- The firm will get a fair price for them. This is unlikely, especially once the word gets around that the firm needs cash quickly.
- Any buyer will pay cash at once for the materials. A credit sale is of no use.
At best the firm can expect only a very poor return. It is best to ignore stocks when looking at liquidity and calculating ratios - hence use the acid test ratio as the key liquidity ratio. When comparing the acid test and current ratios, be sure to make it clear what the limitations of the current ratio are and explain the differences between them.
Acid test ratio
The acid test ratio is the strictest test of liquidity. The term is derived from the use of nitric acid for testing gold.
![]()
OR
![]()
This ratio is a measure of risk, the risk of going bankrupt and failing. The risk increases as the value of the ratio falls. A value of 1.0 is considered to be satisfactory as this means that the firm has sufficient liquid assets to meets its liabilities. Much below 1.0 is generally dangerous, whilst ratios well above 1.0 may be a sign of poor cash management. A firm can be too liquid; it is then not using its resources well enough.
Be careful, though, as this ratio, like many others, is industry dependant. Look at the accounts for a major supermarket and you may find very 'poor' acid test scores, but there clearly is no real risk. They are strong companies which sell for cash, but get very good credit terms from their suppliers.
So, if you are trying to come to some conclusions about a company, get some accounts for other firms in the same industry. That will put the ratio into the correct context.
Calculation of ratios

Follow the link below to get the balance sheet for Student Computers plc and calculate the current and acid test ratios. When you have finished, follow the answer link below to see how you got on. N.B. Calculate the ratios for both years to compare them.
Balance sheet - Student Computers Plc
Answer - current and acid test ratios - Student Computers Plc

Perhaps now is the time to go and get some real Annual Reports and Accounts. They are free and easy to get. Write to the Company Secretary; get on the Internet, perhaps using one of the services like the one offered on the web by the Financial Times. Another useful site for accessing annual reports is CAROL. You have to register, but use of the service is free. These reports make interesting reading, especially if you pick household names.
How can a firm improve its liquidity ratios?
Mathematically, to increase a liquidity ratio, a firm must increase its current assets other than stock; reduce its current liabilities, or both.
The objective is to generate more cash, but with less outstanding short-term debts. Let's examine each in turn:
- Increase current assets - current assets are stock, debtors and cash. It is important to increase cash as a priority. This may be done through increased overdraft levels or additional loans. The firm may raise additional finance through share issues. All assets should be examined and unwanted ones sold, or turned into cash.
To improve the acid-test ratio, stock should be reduced and sold for cash. The firm may implement a just-in-time stock control system to lower tied up stock. All business activities and expenses can be examined and improvements in efficiency planned and put into action. Often, making staff redundant will reduce staff costs. Customers should be pressed to pay any outstanding accounts. Current assets should be made as liquid as possible, and increased.
- Decrease current liabilities - short-term loans and overdrafts may be rescheduled and converted into long-term loans. This will give the firm time. Dividends may be cut so as to conserve cash. Creditors can be contacted and payment terms re-organised.
Efficiency ratios
Efficiency ratios show how efficiently the business is using its resources. Shareholders in particular will want to know how well the firm is using their money! It is advisable for the business to get as much turnover from its assets as possible and at the same time it is not a good idea for it to have too many assets in the form of stock or debtors.
Financial efficiency can be examined by using the following ratios:
- Return on capital employed
- Asset turnover
- Stock turnover
- Debtor days
What do we mean by the term financial efficiency? A business uses capital - shareholders capital or that borrowed from the banks - to run its business. These stakeholders are entitled to know how well this capital is being used. In other words, is the company financially efficient? Are they growing the firm fast enough?
The last section showed how the acid test ratio could give an indication of financial performance. It only looked at the capital structure, though, and attempted to measure risk in some way. Other ratios are perhaps better at assessing performance, or use of money.
A firm uses capital to buy assets, stock and also 'lend' to its customers. How well it does this, may be checked by analysing the accounts.
Efficiency ratios - ROCE
All firms use capital to run the business and generate profit. This capital belongs to the owners, the shareholders, and the lenders, primarily the banks. They want to know how well their money is being worked and what the return they are achieving on their investment. It should be at least as high as the interest the firm could get from investing in the bank.
Return on capital employed (ROCE)
This is alternatively known as the primary efficiency ratio as it is regarded as the most important ratio of all.
![]()
Which net profit should you use? In your examinations, you will be expected to use operating profit or net profit before interest and tax (NPBIT). The management of a firm cannot control the level of taxation or interest rates and so judgment of profit made should be the profit that accrues from ordinary activities, before taxes and interest are deducted, as this is the value controllable by the management.
Total capital employed is given by the formula:
*shareholders' funds plus long-term liabilities

Be careful about the term capital employed. Some textbooks use this to mean shareholders' funds without long-term liabilities. *The IB uses the formula above.
What is a good ROCE? Certainly, the higher the value of the ratio the better as ROCE measures profitability and no shareholder will complain about too high levels of profit! If the ROCE is less than interest rates in the market it is bad news, as the firm (or shareholder) would have been better advised to leave the money in the bank.
A business could have difficulty servicing its borrowings if a low return is being earned for any length of time. So what is an acceptable level? In manufacturing it would be expected that ROCE is in excess of 10% rising to over 25% at the top end. In retail lower figures would be experienced, ranging between 5% and 15%. Most companies would regard 20% as an acceptable level, but like all accounting measures it will depend on a number of factors, such as:
- The industry
- The state of the economy
- The interest rate in the economy (short-term and long-term)
- The size and age of the firm. Established large firms will usually be making a high rate of return.
- The requirements of the firm itself. Here we meet the terms long-termism and short-termism. If you take a short-term view you want high rates of return, the firm want its money back quickly. If they take the opposite approach, they will demand less and be prepared to wait for the profit.
Just like other ratios, ROCE should be examined against previous returns achieved by the business. 20% may be acceptable, but if the firm has a history of achieving over 30%, this would represent a worsening level.
If the ROCE is falling, the firm may address this by:
- Increasing the profit generated by the same level of capital by becoming more efficient
- Maintaining the profits generated, but using less capital

The ROCE is often considered to be a profitability ratio as it measures the efficiency with which the firm generates profit from the funds invested in the business.
Efficiency ratios - asset turnover ratio

It is worth understanding this ratio even though it is not a requirement of the business and management syllabus.
The asset turnover indicates how efficient the company has been in generating sales from its assets. It is sometimes said that this involves the business 'sweating their assets' - i.e. making them work harder to generate sales revenue.
A low asset turnover figure would suggest either poor trading performance (which can be evaluated by the profit margin, sales per employee figures) or an over investment in costly fixed assets. The retail sector has an average asset turnover of 1.9, with poorer performers in the sector averaging 0.8 and the better ones showing an average of 3.2.
![]()
Net assets are defined as:
Total assets (FA + CA) less current liabilities (CL)

Some textbooks define Net Assets as Total Assets (FA + CA) less current liabilities (CL) less Long-term Liabilities (LTL) - in other words Shareholder Funds.
The ratio measures sales as units of net capital employed. The greater the numerical value of the ratio the better. A result of, say 3.5, tells you that the assets generated more than three times their value in sales for the period concerned.
A potential problem with this ratio is the valuation put on the assets; when were they last revalued? An under-valuation makes the ratio higher, and lulls the firm into thinking it is doing well. Equally, in the year when a revaluation takes place, the ratio will slump. Again, this is not a reflection on the performance of the firm. It shows that you must read accounts very carefully, especially the notes and the small print. Follow the link below for an illustration of this.
Sherston Antiques plc
Efficiency ratios - stock turnover ratio
This ratio measures a firm's success in converting stock into sales.
The ratio compares the value of stock with sales valued at cost. Stock is a specific and specialised asset. Why cost of sales? Stock is valued at 'cost or net realisable value'. To avoid inflating this ratio, we use cost of goods sold (cost of sales), without any profit margin. If the firm makes a profit on each sale, then the faster it sells it stock, the greater the profit it earns.
Too high a stock turn may indicate that a firm is selling out of stock and cannot match customer demand, which may lead to dissatisfaction and customers going elsewhere.
When examining this ratio it should be borne in mind that different companies will have varying levels of stock turnover depending on what they produce and the industry in which they operate. The figure varies hugely. A market trader selling fruit and vegetables may sell his stock every one or two days - approximately 110 times per year. A ship or plane manufacturer may have a much lower stock turn. Clearly though, the profit generated on a sale of a ship will be far higher than on an apple!
![]()
OR
![]()
The first equation measures how many times in a period (usually the financial year) the firm turns over its stock. If you imagine a stock cupboard in the classroom full of products, then stock turn is the number of times the entire cupboard is sold.
The second equation shows the time it takes in days to turn over the total stock - or to the time taken to sell that stock cupboard. Firms only earn profit when they sell goods, so clearly the firm would want the lowest possible figure which would allow it to restock and sell again.
The ratio can be improved by holding less stock or by increasing sales. The firm may employ better stock control methods such as just-in-time production.
Problems arise from stock valuation itself. Are the items in stock really usable, or should they be written off? You must know the business, though, before you make comments about the level of stock. In some businesses the raw materials are seasonal, and can only be obtained once per year or the firm may buy in bulk to maximise discounts. Stocks then will average half a year's sales, and will seem excessive. There is nothing that can be done about it, unless the firm starts developing new sources of supply.
A supermarket, on the other hand, wants to get stocks in quickly, and then sell them fast. It does not want huge stocks, especially perishable products such as chilled foods.

Some examples:
| Company X ($k) | Company Y ($k) | |
|---|---|---|
| Sales | 60,000 | 30,000 |
| Cost of sales | 30,000 | 10,000 |
| Stock | 1,000 | 5,000 |
| Stock turnover (days) | 12.1 days | 182.5 days |
| Stock turnover | x 30 | x 2 |
Debtor days
Efficiency ratios - debtor days (debtors' collection period)

Debtors are customers, who owe the firm money for the product they have bought on credit. Debtors should be kept as low as possible because they have the firm's products, but are yet to pay for them - a double bonus! However, it is tempting for the firm to increase sales revenue by selling on extended credit. Indeed it may be part of a firm's marketing strategy to capture market share by offering better credit terms than its competitors.
So, this ratio examines the average time in days taken to collect trade debts. It provides feedback on how well the level of debts is being managed. If debtors are taking too long to pay the firm may also experience difficulty in paying its debts. Apart from strictly cash businesses like supermarkets with virtually zero debtors, normal payment terms are at the end of the month following delivery, giving an average credit of between six and seven weeks.
![]()
Sales revenue is used, not cost of sales, since the goods or services have been sold and the price realised.
For this ratio we want the days to be as low a value as possible. Too high a figure may show the need for better credit control procedures.
Problems can arise over the debtor's figures. Some debtors will never pay, so should be written off. This will 'improve' the ratio but reduce the asset value of the firm. Writing off bad debts will then change a whole series of other ratios.


Creditor days

This ratio measures the length of time it takes the firm to pay its creditors.
![]()
In general the firm should seek to maximise the period that it takes to pay its debts. In this way it has the materials and the products it requires, but still has the money for these in its bank account gaining interest.
However, having a high creditor days figure may indicate that the firm is losing out on discounts for early repayment, meaning it is paying more for its materials than perhaps its competitors. Again it is important to place this ratio in the context of the industry in which it operates. For food retailers the creditor days' ratio may be as low as 8 - 12 days. In manufacturing, averages tend to be closer to 37 days.
There should be a link between debtors' days and creditors' days. Creditors' days should be at least as long (or short) as the debtor's days. One can finance the other.

Efficiency ratios - use and calculation
Use of the ratios
The individual ratio for a single year is of limited value. What are important are trends over time and comparisons with other firms in the same industry. These ratios are very industry specific.
As always, you need sets of ratios for a series of years, plus the corresponding information for the competition to really get value from the exercise.
Improving the ratios
Remember, there is little point in improving ratios as such. It is the business that is being improved, and the ratio values will reflect this improvement.
Asset turnover: Get sales up, assets down, or a combination of both.
Stock turnover: Get sales up, stock down, or a combination of both.
Debtor days: Get debtors down, sales up, or a combination of both.
Remember, ratios are like symptoms of a disease (or of health). You get nowhere treating symptoms; you must get to the root of the problem.

Calculation of ratios - asset turnover, stock turnover and debtor days
Follow the link below to get the balance sheet and profit and loss account for Student Computers plc and use them to work out the asset turnover, stock turnover and debtor days ratios - it will be good practice. Once you have had a go, and then follow the answer link below to see how you got on. N.B. Calculate the ratios for both years to compare them.
Student Computers Plc - balance sheet and profit and loss account
Answer -asset turnover, stock turnover and debtor day's ratios

Calculation of ratios - ROCE
Follow the link below to get the balance sheet and profit and loss account for Student Computers plc and use them to work out the ROCE - it will be good practice. Jot down some notes on how well the firm has performed. Once you have made your calculation, follow the answer link below to see how you got on. N.B. Calculate the ratio for both years to compare them.
Balance sheet and profit and loss account - Student Computers Plc
Answer - ROCE calculation
Financial efficiency ratios - examples

Supermarkets v fine art galleries
These very different industries will have very different ratios. Supermarkets sell a lot of goods cheaply and very quickly; fine art galleries sell a small number of goods infrequently for a high price. There is little credit in the supermarket, but that may not be the case with fine art. The result:
| Supermarket | Fine art gallery | |
|---|---|---|
| Asset turnover | Very high | Low |
| Stock turnover | Very high | Low |
| Debtor days | Very low | High |
A supermarket will typically sell its stock on average every 2 weeks; have debtor days of about 2, but creditor days of about 40/50. Think about it, great for CASH FLOW.
Shareholders' ratios

A share represents ownership of part of a company. A shareholder has two main reasons for buying shares in a company:
- Capital Gain. Shareholders hope that the market value of the share will increase over time, so if they choose to sell at a later date they will make a capital gain. However, investing in shares is not so different to gambling. Shares can increase, but also decrease, so it is quite possible to make a capital loss!
- Dividend. A dividend is payable to shareholders out of the after-tax profits of the company. The level of dividend is decided by the board of directors, but normally reflects the success of the business. The higher the profit levels, the higher the dividend. It is quite common for a firm to pay an interim dividend halfway through the financial year.
The company itself can only sell a share once, which forms the initial capital of the business. If a shareholder wants to later sell their shares they can only do this by finding another investor to take their place. Stock markets facilitate this trade in 'second hand' shares, e.g. Wall Street in USA, the London Stock Exchange and Frankfurt in Germany.
Shares in companies are only available for incorporated firms - private limited companies or plc's. They are not available for sole traders or partnerships, so the ratios have no meaning for these firms. Remember, also, that it is the shares of qualifying plc's that are sold on the main markets of a Stock Exchange, not those of limited firms. These have to be bought and sold by private arrangements.
Shareholders are the owners of a firm, and they may also be directors and/or employees. They look at a set of accounts in a different way to other stakeholders. They are still interested in profit and financial performance, but they are also interested in the dividend paid, the dividend history, and the future prospects for dividends. There are several shareholder ratios that can be calculated, but only two ratios are required for the IB programme:
Earnings per share (EPS)
![]()
Unlike most stakeholders, shareholders are interested in net profit after tax and interest, because this is the sum of money available for distribution.
By dividing the profits that are potentially available for distribution (net profit after interest and tax) as dividend by the number of shares, we get a figure of earnings per share. This can be used as a measure of the company's profit performance over time. It also shows the maximum potential for paying out a dividend to shareholders and how much each share has earned for its owner.
In reality, it would be unusual for a firm to distribute all the profit after tax, as this would mean there would be no funds to reinvest back into the business. It would not be in the long-term interest of the shareholders to pay out all profit as dividend as this would restrict the ability of the company to grow in the future.
The EPS ratio can only really be increased by increasing the level of profits made. It is only useful when compared with previous years, although the higher the figure the better for shareholders in the short-term.
Dividend yield
![]()
This ratio shows the percentage yield of the dividends in relation to the current market price an investor would have to pay for each share.
If the dividends per share is announced as $0.25 and the current market price of the share is
$5, then the dividend yield is:
![]()
This 5% can be compared with other similar companies (inter-firm comparison) or with previous yields (historical comparison).
The face value of a share is fixed - usually £1, but the market value of a share fluctuates in real time according to the demand for, and supply of, that share. The value is shown on a daily basis in the stock exchange listings. The higher the ratio the better, but since the dividend is fixed for the financial year once it is announced, any increase in the dividend yield, normally means that the market price of the share has reduced. Clearly shareholders will compare the dividend yield with no-risk investment opportunities such as banking the money.
As dividend yield is based partly on the market price of shares, anything that affects this price will affect the ratio. A higher value for the ratio can be achieved by the directors agreeing to distribute a higher proportion of profit after tax.
Dividends are important to shareholders. This can lead to a short-term approach by the Directors trying to keep the shareholders happy. There may be pressure to give high dividends today, possibly at the expense of high profits in the future as many shareholders (investors) are looking for good short-term returns.
Improving the shareholder ratios
This really means increasing dividends. This should come as a result of increased profits, but may be an action taken just to please shareholders.
A fall in share price, not necessarily as a consequence of anything the firm has done, will improve the dividend yield. Look at the performance of banks over recent years.

Factors affecting share prices
If you would prefer to view this interaction in a new web window, then please follow the link below:
Gearing
Once businesses are operating they have two main sources of reasonable sums of money for investment, growth and development of the firm:
- Loan capital from banks, and other institutions (Debt)
- Share capital and reserves, including retained profit (Equity)
Most firms operate using a mixture of borrowed capital and their own finance. There are advantages and disadvantages to both sources.
| Advantages | Disadvantages | |
|---|---|---|
| Loan capital | Once repaid, still have the assets bought. There are now no more charges to be met. | Have to pay interest, even if there is no profit. Interest payments reduce profit. |
| Share capital | No interest. Dividends optional. | Share issues to raise capital can be costly. The number of shares that can be sold is limited by regulations. An AGM is needed to increase the number available. |
Share capital and retained profits are free of fixed charges; only dividends need to be paid. However, this form of capital may be limited. Relying on it alone may slow growth.
Loans, however, cost a company money in interest payments, but a lack of loans can stifle growth.
The balance between loans and share capital is important. This leads to the concept of the gearing of a business.

Gearing
Gearing measures the proportion of capital employed that is provided by long-term lenders.
Which develops further into the gearing ratio.
Gearing ratio
This is sometimes known as the debt equity ratio.
![]()
What is loan capital? All monies that have been borrowed and interest has to be paid. It will include long-term bank loans, debentures, overdrafts etc. It does not include debtors or creditors; they are interest free.
The gearing ratio value can vary between 0 and 100%. What do individual results mean?
| Value | Meaning |
|---|---|
| 0 - 25% | Probably too low. Growth may be being slowed by a lack of capital. Firm could be planning a take-over, however. Look at the cash position. If this is high then a take-over or merger may well be round the corner. |
| 25 - 75% | Acceptable range |
| 75% + | Could be too high. Dangerous in difficult trading conditions. Any rise in interest rates could increase interest payments significantly. In the extreme this could lead a firm into liquidation. It is like a house-owner having too high a mortgage payment and having to sell up because they cannot afford the interest repayments. |
A firm is said to be highly geared if the gearing ratio is over 50%; in other words loans represent more than 50% of capital employed. The higher the gearing ratio: the higher the degree of risk. A lower geared company offers a lower risk investment and as a result they can normally negotiate additional loans more easily and at a lower interest rate than highly geared company.
 Improving the ratio
Remember, gearing is a symptom: so changing it in its own right has little value. Obviously, its improvement will depend whether it is currently too high or too low.
Too low: The firm could borrow more money provided there is a suitable investment. Is the real problem behind the low gearing ratio a lack of research or product ideas?
Too high: the firm should attempt to pay off some loans, or raise more share capital. Perhaps the firm is trying to expand too fast.
The gearing ratio of a business will change with time, usually on a regular cyclical basis. It will grow as it invests to expand, and then fall as the retained profits increase as a result of the growth. It will then grow again as the process is repeated with new products etc.
Sources of finance
Sources of finance for a firm will be of one of two types, those that change gearing and those that do not. Some sources will increase gearing; others will reduce it.
1. Methods that change gearing
a) Those that increase gearing:
- Bank loans - Short- or long-term loans from banks. Interest is paid, but the bank has no say in the running of the firm (unless they buy shares, or manage to get a director on the board).
- Commercial paper - a special form of loan where bonds or debentures are bought by specialist financial firms.
- Debentures - a loan instrument.
b) Those that decrease gearing:
- Sale of shares, sometimes at a premium. This will increase shareholders funds. However, the number of shares available to be sold is limited by the regulations of the company which set out its 'authorised share capital'.
- Rights issues. This is where existing shareholders are given the 'right' to buy new shares at a 'special' price.

2. Methods that do not change gearing
- Leasing - the firm does not own the asset; they just rent it. No capital involved, so the balance sheet is unchanged. Costs increase, so profits will fall on the P&L account.
- Sale and leaseback - here the firm sells an asset, and so release cash or capital. The firm leases the asset back, at a cost to the P&L account, but now have the capital to invest in other opportunities.

Follow the link below to see an example of sale and leaseback.
Supermarket expansion- sale and leaseback example
- Debt factoring - this is a short term, one off operation. Instead of waiting for debtors to pay, as per their purchasing contract, the firm sells sell the debt to a factor company, which pays the firm a proportion of the debt in advance. The remainder of the debt is kept as their fee for providing the service and taking the risk of the debt 'going bad'. In many ways it can be considered a sign of weakness, not strength.
Notice that when a business raises more finance, how it achieves this increase will change its gearing. Remember the following:
- Loan capital can be expensive. Interest has to be paid regardless of the market or profit. Repayments have to be made. Eventually, though, when the loan is repaid the firm still has the asset and is now much more profitable. The lender is not an owner, however, so has no say in the running of the business.
- Share capital never has to be repaid and dividends are paid only when there is a profit. Shareholders are owners, however, so sales of additional shares may result in a loss of control over the business.
The implications for gearing must be considered when deciding how to finance an expansion.
Limitations of gearing
As always a series of ratios is required to analyse the situation of the firm fully, plus knowledge of its history. It is very important to know why the ratio has changed.

Calculation of ratios
Follow the link below to get the balance sheet for Student Computers plc and work out the gearing ratio - it will be good practice. Once you have calculated the ratio, follow the answer link below to see how you got on. N.B. Calculate the ratio for both years to compare them.
Balance sheet - Student Computers Plc
Answer - gearing ratio calculation
Ratio analysis - A summary
Ratio analysis has been covered on an individual basis in the previous units. Use the table of contents on the left and look at the pages for individual ratios if you are not sure about any of them.
This page simply gives an overall summary of the use and limitations of ratio analysis. In the questions section of the module there is a case study where you can practise all the knowledge gained in this unit so far. The case study is called Stortford Yachts and it also has the answers for you to see how you got on.
 Ratios are a powerful tool in the interpretation of the accounts and can discover issues and problems not immediately evident from the accounts and financial information provided in the annual report. The can provide the basis for inter-firm comparisons allowing managers to benchmark the performance and efficiency of the firm against its competitors. Trends can then be examined and analysed. Stakeholders may use ratios to support their decision making. Employees, for example may use profit ratios to support pay claims and creditors can use liquidity ratios to evaluate whether debts will be repaid.
Further limitations:
- However other types of analysis exist, which are not based solely on financial performance.
- Ratios are based on data published in public financial accounts. Only financial data is used, so non-financial factors are not included. It cannot be concluded that all the data needed is published, so it is hard to draw solid conclusions from the ratios alone.
- Analysis is only of real use if there are a series of accounts available.
- Access to the equivalent information for other firms in the same industry is needed so inter-firm comparisons can be made.
- Ratios are always looking at historical data, and so the situation the firm is facing may have changed significantly between publication of the accounts and analysis of them.
3.6 Ratio analysis - questions
In this section are a series of questions on the topic - Ratio analysis. The questions may include various types of questions. For example:
- Self-test questions - on-screen questions that give immediate marking and feedback
- Short-answer questions - a series of short-answer questions to help you check your understanding of the topic
- Case study - a case study with associated questions
- In the news - questions based around a topical business news article
Click on the right arrow at the top or bottom of the page to work through the questions.
Profitability ratios - short answer questions

Question 1
Outline the factors that should be taken into consideration when examining a firm's ROCE.
Question 2
Explain the primary efficiency ratio for a firm.
Question 3
Explain the differences between profit and profitability.
Question 4
Discuss how a short term or a long term approach to business influences the level of ROCE that will be considered acceptable by a firm and its stakeholders.
Profitability ratios - memorandum

Produce a short memorandum outlining whether or not falling profit margins are a serious cause for concern. Your report should arrive at an overall conclusion.
Use the following format for the memorandum:
To:
From:
Date:
Subject:
Profitability - numerical questions

Question 1
Examine the data below, which is extracted from the accounts of Rattlebone Automobiles over a number of years.
| Year | 2005 | 2006 | 2007 | 2008 | 2009 | 2010 |
|---|---|---|---|---|---|---|
| (Units $k) | ||||||
| Sales | 12,000 | 13,000 | 12,000 | 10,000 | 12,000 | 15,000 |
| Gross profit | 5,000 | 5,000 | 6,000 | 4,000 | 5,000 | 8,000 |
| Net (trading) profit | 2,000 | 2,500 | 1,500 | (1,000) | 1,000 | 2,500 |
| Net capital employed | 22,000 | 23,500 | 25,000 | 25,000 | 24,000 | 26,000 |
Calculate the profitability ratios for each of these years.
Question 2
You have obtained the profitability figures for two other firms in the car business, and these are given below. The firms are Ocelot plc, a manufacturer of hand-made luxury sports cars, and Bridge plc, a mass producer of small family cars. Comment on your findings, and on the comparisons you can make.
At least all the data relates to the same industry, the car industry. Comparisons should be valid, therefore.
| Year | 2007 | 2008 | 2009 | 2010 |
|---|---|---|---|---|
| Ocelot plc | ||||
| ROCE | 8% | 8% | 7.5% | 4% |
| Gross profit margin | 55% | 60% | 50% | 50% |
| Net profit margin | 22% | 16% | (5%) | 12% |
| Bridge plc | ||||
| ROCE | 11% | 11% | 9% | 10% |
| Gross profit margin | 30% | 34% | 22% | 30% |
| Net profit margin | 8% | 7% | 5% | 8% |
| Interest rate | 5% | 7% | 10% | 6% |
Question 3
Jeremy Waite runs a small antiques shop. He is a sole trader and views the shop as a 'hobby more than a job'. He is curious about the financial performance of the shop and has provided extracts from two years' final accounts. He would like you to analyse the accounts to assess the profitability of the firm. The sales and balance sheet extracts are as follows:
| 2010 | 2011 | |
|---|---|---|
| $ | $ | |
| Sales | 16,544 | 14,870 |
| Cost of goods sold | 9,536 | 8,390 |
| Gross profit | 7,008 | 6,480 |
| Overheads | 3,119 | 4,890 |
| Net profit | 3,889 | 1,590 |
| Capital employed | 59,490 | 57,980 |
Required
(a) Calculate for both years the following ratios:
(i) Return on capital employed
(ii) Gross profit percentage
(iii) Net profit percentage
(b) Using your results from (a), analyse the profitability of the shop.
Liquidity ratios - short answer questions

Question 1
Explain why stock is not included as a current asset in the acid test ratio.
Question 2
Distinguish between the current ratio and the acid test ratio.
Question 3
Analyse methods by which a firm can improve its acid test ratio.
Question 4
Explain why a large cash holding in a company can be considered inadvisable and even potentially dangerous.
Liquidity ratios - memorandum

Produce a short memorandum outlining whether or not an acid test ratio of 0.5 means action will have to be taken to improve the liquidity position of this firm.
Use the following format for the report:
To:
From:
Date:
Subject:
Liquidity ratios - numerical questions

Question 1
Examine the following table of data, and then answer the question that follows.
| Extract from the accounts of Sherston Logistics plc (Units $k) |
|---|
| Year | 2007 | 2008 | 2009 | 2010 | 2011 |
|---|---|---|---|---|---|
| Stock | 100 | 120 | 140 | 160 | 160 |
| Creditors | 60 | 70 | 80 | 80 | 90 |
| Cash | 100 | 70 | 60 | 80 | 100 |
| Overdrafts | 60 | 80 | 100 | 110 | 120 |
| Debtors | 100 | 130 | 100 | 80 | 70 |
| Short-term loans | 40 | 40 | 30 | 40 | 60 |
For each year, calculate and comment on the firm's acid test ratio.
Question 2
Frank Wright runs a small bakery. He is concerned with the liquidity position of his firm as he has heard that liquidity problems are one of the most frequent explanations for business failure. The following data is available:
| $ | |
|---|---|
| Stock | 14500 |
| Debtors | 8409 |
| Bank | 3200 |
| Creditors | 9310 |
Required
(a) Calculate the current ratio and liquidity (acid test) ratio based on the above data.
(b) Give a brief evaluation of the liquidity position of Frank Wright's bakery
Question 3
Hi-Sounds, a small audio equipment retailer, has just completed the second year of trading. Profits are up, but the manager is slightly concerned. She feels that the firm could face liquidity problems in the near future. The data for this claim is as follows:
| As at 31 December: | 2010 | 2011 |
|---|---|---|
| $ | $ | |
| Stock | 14500 | 7568 |
| Debtors | 6662 | 9871 |
| Bank | 3200 | |
| Creditors | 9310 | 7845 |
| Bank overdraft | 2489 |
Required
(a) Calculate the current ratio and liquidity ratio based on the above data.
(b) Should the manager be concerned with the liquidity position? Give a balanced argument.
Efficiency ratios - short answer questions

Question 1
Explain why the 'cost of sales' is used to determine stock turnover.
Question 2
Describe why a high stock turnover is considered to be a good thing.
Question 3
Define the term 'bad debt'. Explain how the recognition of bad debts will affect the debtors days ratio for a firm.
Question 4
Explain why a high debtor days' ratio figure is considered a bad thing for a company.
Question 5
'Ratios are symptoms of a situation'. Discuss.
Financial efficiency ratios - numerical questions

Question 1
The following data has been extracted from the accounts of a company.
| Year ($k) | 1 | 2 | 3 | 4 | 5 |
|---|---|---|---|---|---|
| Net capital employed | 2,000 | 2,200 | 2,000 | 2,500 | 2,700 |
| Sales revenue | 10,000 | 11,000 | 11,000 | 10,000 | 12,000 |
| Cost of sales | 6,000 | 6,500 | 7,000 | 5,500 | 6,000 |
| Stocks | 1,000 | 1,000 | 1,500 | 1,000 | 800 |
| Debtors | 1,500 | 1,500 | 1,800 | 2,000 | 1,500 |
- Calculate the asset turnover ratio, the stock turnover ratio, and debtor's days for the company over the five year period.
- Analyse the results and comment on your findings.
Question 2
The following information is available for the last two years.
| For year ended 31 March 2010 | For year ended 31 March 2011 | |
|---|---|---|
| $ | $ | |
| Turnover | 125,000 | 160,000 |
| Purchases | 80,000 | 128,000 |
| As at 31 March 2010 | As at 31 March 2011 | |
| Trade debtors | 13,500 | 31,000 |
| Balance at bank | 8,000 | 4,000 |
| Trade creditors | 11,800 | 15,600 |
- Calculate both the debtors' collection period and the creditors' payment period for each of the two years. State the formulae used.
- Calculate the acid test ratio for each of the two years. State the formulae used.
Gearing - short answer questions

Question 1
Distinguish between share and equity capital.
Question 2
Explain why share capital is considered as free capital.
Question 3
Explain what is meant by a 'bad' gearing ratio.
Question 4
Examine whether a company can be under geared.
Question 5
Explain the term 'sale and leaseback'.
Gearing - numerical questions

Question 1
Examine the data below, which is extracted from the accounts of Forlorn Holdings plc. (Units; $k)
| Year | 2005 | 2006 | 2007 | 2008 | 2009 | 2010 | 2011 |
|---|---|---|---|---|---|---|---|
| Overdrafts | 100 | 120 | 140 | 100 | 80 | 100 | 120 |
| Short-term loans | 200 | 150 | 200 | 250 | 250 | 300 | 250 |
| Debtors | 300 | ||||||
| Long-term loans | 200 | 200 | 150 | 200 | 250 | 300 | 400 |
| Share capital | 500 | 500 | 500 | 500 | 550 | 550 | 550 |
| Revaluation reserve | 200 | 200 | 200 | 200 | 200 | 250 | 250 |
| Retained profits | 200 | 220 | 200 | 250 | 270 | 300 | 300 |
Calculate the gearing ratio for each of the years, and then try to explain what may be behind the changes.
Shareholders' ratios - short answer questions


Question 1
Explain the difference between dividend and dividend yield.
Question 2
Identify the factors that influence the price of a share.
Question 3
Explain why the price of a share may not be a good indication of a firm's performance.
Question 4
Where can you buy and sell shares of a sole trader?

Shareholder ratios - numerical questions


Question 1
Bodgers Engineering plc have been listed on the Stock Exchange for a number of years. The following is an extract from their accounts, with additional information
| Year | 2005 | 2006 | 2007 | 2008 | 2009 | 2010 | 2011 |
|---|---|---|---|---|---|---|---|
| Share price ($) | 1.27 | 1.38 | 1.24 | 1.03 | 1.35 | 1.75 | 1.25 |
| Dividend (p/share) | 10 | 12 | 14 | 14 | 14 | 15 | 16 |
| Stock Market indices | 4000 | 4500 | 5000 | 6000 | 5,000 | 3,800 | 4,000 |
| Interest rate | 8% | 10% | 8% | 7% | 5% | 4% | 3.5% |
- Calculate the shareholders ratios for the above firm.
- Using all the data above, comment on your findings.
Question 2
Heskey plc has an ordinary share capital of 500,000 $1 shares. Below is a profit and loss account extract taken from the annual report. The market price of the share on 31 December 2011 was $1.85.
| Heskey plc - profit and loss account (extract) for the year ended 31 Dec 2011 |
|---|
| $ | $ | |
|---|---|---|
| Profit after taxation | 105,000 | |
| Less: | ||
| Transfers to reserves | 15,000 | |
| Dividends | 55,000 | 70,000 |
| Profit c/f | 35,000 |
From the above profit and loss account extract, calculate the following ratios:
- Earnings per share
- Dividends per share
- Dividend yield
Question 3
Owen plc has an ordinary share capital of 1,000,000 50c ordinary shares.
Below is a profit and loss account extract taken from the annual report. The market price of the share on 31 December 2011 was $0.78.
| Owen plc - profit and loss account (extract) for the year ending 31 Dec 2011 |
|---|
| $ | $ | |
|---|---|---|
| Profit after taxation | 43,500 | |
| Less: | ||
| Transfers to reserves | 8,000 | |
| Dividends | 12,000 | 20,000 |
| Profit c/f | 23,500 |
From the above profit and loss account extract, calculate the following ratios:
- Earnings per share
- Dividends per share
- Dividend yield
Question 4
From the following data, calculate the following ratios:
- Earnings per share
- Dividends per share
- Dividend yield
| Profit after tax | $550,000 |
|---|---|
| Ordinary dividends | $230,000 |
| Number of ordinary share issued | 2,500,000 |
| Market price of share | $2.30 |
Question 5
From the following data, calculate the following ratios:
- Earnings per share
- Dividends per share
- Dividend yield
| Profit after tax | $4,600,000 |
|---|---|
| Ordinary dividends | $1,850,000 |
| Number of ordinary share issued | 5,000,000 |
| Market price of share | $5.60 |
Question 6
From the following data, calculate the following ratios:
- Earnings per share
- Dividends per share
- Dividend yield
| Profit after tax | $459,884 |
|---|---|
| Ordinary dividends | $333,451 |
| Number of ordinary share issued | 1,500,000 |
| Market price of share | $4.40 |

Ratio analysis - limitations - report

Produce a short report outlining three limitations of ratios. Credit will be given if the limitations are illustrated with an example.
Ratio analysis - limitations

This is an opportunity to consolidate, and review progress to date in this long, complex unit. The following case study covers all of the topics covered in this unit so far. It is a good revision exercise.
Sherston Antiques plc
 Sherston Antiques have been trading for 10 years. Their accounts for the last four years are shown below.
The business grew quickly, but like many small businesses they have had some financial issues along the way. They are now looking to raise capital for a further expansion through a rights issue. The proposal is a 2 for 1 deal, at a price of 40 cents per share.
They have been able to revalue their properties as a result of the housing boom in the recent years. However, they have been hit by a series of bad debts in Latin America markets.
The company has built up a very good reputation, and its logo is well known, and has become a sign of quality and value. The CEO is proposing at the next Board Meeting that this should now be recognised in the accounts by the inclusion of an entry for intangible assets.
You are a shareholder of Sherston Antiques and have just received the latest Annual Report and Accounts, and the papers for the rights issue. Examine the accounts, and then answer the following questions.
Accounts summary for Sherston Antiques plc
| Year | 1 | 2 | 3 | 4 |
|---|---|---|---|---|
| Sales revenue | 1,000 | 1,200 | 1,100 | 1,500 |
| Cost of sales | 500 | 600 | 600 | 700 |
| Gross profit | 500 | 600 | 500 | 800 |
| Other costs | 200 | 250 | 300 | 360 |
| Depreciation | 50 | 50 | 60 | 60 |
| Profit before interest and tax | 250 | 300 | 140 | 380 |
| Interest | 50 | 50 | 100 | 80 |
| Taxation | 40 | 50 | 20 | 200 |
| Profit after interest and tax | 160 | 200 | 20 | 100 |
| Dividends | 80 | 80 | 80 | 80 |
| Retained profits | 80 | 120 | (60) | 40 |
| Fixed assets | ||||
|---|---|---|---|---|
| Buildings | 1000 | 1000 | 1950 | 1950 |
| Others | 4300 | 4420 | 4370 | 4410 |
| Intangibles | 0 | 0 | 0 | 0 |
| 5300 | 5420 | 6320 | 6360 | |
| Current assets | ||||
| Stock | 200 | 250 | 350 | 250 |
| Debtors | 250 | 250 | 110 | 250 |
| Cash | 100 | 110 | 100 | 80 |
| 550 | 610 | 560 | 580 | |
| Current liabilities | ||||
| Creditors | 100 | 80 | 60 | 40 |
| Overdrafts | 100 | 120 | 140 | 160 |
| 200 | 200 | 200 | 200 | |
| Net current assets | 350 | 410 | 360 | 380 |
| Net assets | 5650 | 5830 | 6680 | 6740 |
| Financed by: | ||||
| Share capital | 3000 | 3000 | 3000 | 3000 |
| Revaluation reserve | 500 | 500 | 1500 | 1500 |
| Retained profits | 1000 | 1120 | 1060 | 1100 |
| Long-term liabilities | ||||
| Loans | 500 | 1210 | 1020 | 1040 |
| Debentures | 650 | 0 | 100 | 100 |
| Capital employed | 5650 | 5830 | 6680 | 6740 |
| Share price | 1.00 | 1.05 | 0.94 | 1.05 |
Note: There are 3 million shares sold, with a face value of 10c, on the market today. The sale of another 2 million shares is already authorised.

Question 1
Explain the term 'rights issue'.
Question 2
Identify when:
- Sherston Antiques revalued their buildings
- wrote off their bad debts
Question 3
Explain the consequences of these actions on the ratios of the company.
Question 4
Analyse the benefits of the rights issue for Sherston Antiques.
Question 5
Discuss the advantages and disadvantages of including intangible assets in company accounts.
Ratio analysis - summary questions

Question 1
Consider the accounts of Hope Ltd.
| Hope Ltd - profit & loss account for year ended 31 December 2011 |
|---|
| $000 | |
|---|---|
| Turnover | 400 |
| Gross profit | 280 |
| Net profit | 120 |
| Dividends | 80 |
| Hope Ltd - balance sheet as at 31 December 2011 |
|---|
| $000 | $000 | |
|---|---|---|
| Fixed assets | 1,200 | |
| Current assets | 620 | |
| Creditors (amounts falling due within one year) | 310 | |
| Net current assets | 310 | |
| Total assets less current liabilities | 1,510 | |
| Creditors (amounts falling due after more than one year) | ||
| Debentures | 560 | |
| 950 | ||
| Ordinary shares of $1 each | 500 | |
| Reserves | 250 | |
| 950 |
Additional information:
- The value of closing stock as at 31 December 2011 was $250,000.
- The market price of an ordinary share on 31 December 2011 was $2.25.
From the above information, calculate the following ratios:
- Gross profit margin
- Net profit margin
- Return on capital employed
- Acid test
- Current ratio
- Dividend yield
- Price earnings ratio
- Gearing
Question 2
Consider the accounts of Harker Ltd.
| Harker Ltd - profit & loss account for year ended 31 December 2011 |
|---|
| $000 | |
|---|---|
| Turnover | 320 |
| Gross profit | 195 |
| Net profit | 54 |
| Dividends | 26 |
| Harker Ltd - balance sheet as at 31 December 2011 |
|---|
| $000 | $000 | |
|---|---|---|
| Fixed assets | 420 | |
| Current assets | 175 | |
| Creditors (amounts falling due within one year) | 140 | |
| Net current assets | 35 | |
| Total assets less current liabilities | 455 | |
| Creditors (amounts falling due after more than one year) | ||
| Debentures | 100 | |
| 355 | ||
| Ordinary shares of $1 each | 280 | |
| Reserves | 75 | |
| 355 |
Additional information:
- The value of closing stock as at 31 December 2011 was $48,000.
- The market price of an ordinary share on 31 December 2011was $1.12.
From the above information, calculate the following ratios:
- Gross profit margin
- Net profit margin
- Return on capital employed
- Acid test
- Current ratio
- Dividend yield
- Price earnings ratio
- Gearing
Ratio analysis - case study - Stortford Yachts Limited

 This case study is intended as a self-test exercise on all of ratio analysis. The answers are given as popup boxes to each question. However, do try to work through them all first before submitting to temptation. The more you practise calculating ratios, the easier it gets - we promise!
Paul Marriot is the director of Stortford Yachts Ltd. The company has traded for 30 years and has in the past achieved very good levels of growth and return on capital, but this is now changing. In recent time it has failed to introduce new product lines, relying on traditional products and little has been invested in Research or Product Development.
You are a business planning consultant for a firm of Management Consultants. Stortford Yachts is one of your clients. In recent times the business has experienced increased turnover but a downturn in overall performance.
Paul Marriot has had a meeting with your Director and he has stated that he wants to introduce tighter management control within the company by introducing a system of responsibility accounting.
You receive the following memo from your Director, Pauline Changer, regarding this case.
Memorandum
To: Business Planning Assistant
Date: 21st May 2011
From: Pauline Changer, Director
Subject: Stortford Yachts Ltd. - accounts information
You are aware that I met with Paul Marriot yesterday and that he is concerned with the latest results shown in the final accounts that have recently been prepared at year end.
The file attached contains a summary of the company's abbreviated profit statements and balance sheets for the past three years; together with additional information and performance indicators for their business sector as a whole for the period under review.
I would like you to examine this information and meet with me on Friday morning to discuss the form and presentation of a detailed financial analysis of the company over the three-year period.
Signed: P. Changer
Financial information on Stortford Yachts Ltd.
1. Summary profit statements
| $m | $m | $m | |
|---|---|---|---|
| 2009 | 2010 | 2011 | |
| Sales turnover | 4.90 | 5.30 | 6.60 |
| Operating costs | 4.17 | 4.43 | 5.82 |
| Operating profit before tax | 0.73 | 0.87 | 0.78 |
| Taxation | 0.24 | 0.30 | 0.27 |
| Profit after tax | 0.49 | 0.57 | 0.51 |
| Dividends | 0.12 | 0.16 | 0.16 |
| Retained profit | 0.37 | 0.41 | 0.35 |
N.B. The firm's detailed breakdown of costs is as follows:
| Years | 2009 | 2010 | 2011 |
|---|---|---|---|
| Labour costs | 0.93 | 0.98 | 1.25 |
| Distribution costs | 0.44 | 0.49 | 0.61 |
| Administration costs | 0.19 | 0.22 | 0.27 |
2. Summary balance sheets
| $m | $m | $m | |
|---|---|---|---|
| 2009 | 2010 | 2011 | |
| Fixed assets | 2.40 | 2.77 | 2.88 |
| Current assets | |||
| Stocks: | |||
| Raw materials | 0.09 | 0.12 | 0.15 |
| Finished goods | 0.40 | 0.43 | 0.45 |
| Debtors | 1.14 | 1.32 | 1.84 |
| Bank | 0.03 | 0.04 | 0.05 |
| 1.66 | 1.91 | 2.49 | |
| Less Current liabilities | 1.35 | 1.56 | 1.90 |
| Net current assets | 0.31 | 0.35 | 0.59 |
| 2.71 | 3.12 | 3.47 | |
| Capital and reserves | 0.5 | 0.91 | 1.26 |
| Bank loans | 2.21 | 2.21 | 2.21 |
| 2.71 | 3.12 | 3.47 |
3. Yacht Builders Federation
Average ratios for federation members 2011
| % Return on capital employed | 26.0% |
|---|---|
| Asset turnover | 1.79 times |
| Net profit margin | 14.5% |
| Current ratio | 1.5:1 |
| Acid test ratio | 1.03:1 |
| Debtors collection period | 83 days |
| Gearing ratio | 32.0% |
| Labour cost % of sales | 18.1% |
| Operating cost % of sales | 85.5% |
| Distribution costs % of sales | 9.5% |
| Admin costs % of sales | 4.5% |

Questions
In your role of planning assistant you are to prepare an analysis of the company's figures over the three-year period using the performance criteria listed in the inter-firm comparison table.
1. Calculate all the ratios given in the average ratios for federation members for 2009, 2010 and 2011.
2. Prepare a detailed report on the company's performance in terms of profitability and liquidity compared with the average of the sector over the period.
Answers
1. Calculate all the ratios given in the average ratios for federation members for 2009, 2010 and 2011.
Answers - question 1
Follow the links below for the answers to each of the ratio calculations:
(i) Return on capital employed
(ii) Asset turnover ratio
(iii) Net profit margin
(iv) Current ratio
(v) Acid test ratio
(vi) Debtors collection period
(vii) Gearing ratio
(viii) Labour cost as % of sales
(ix) Operating costs as % of sales
(x) Distribution costs as % of sales
(xi) Administrative costs as % of sales
Total: 30 marks
2. Prepare a detailed report on the company's performance in terms of profitability and liquidity compared with the average of the sector over the period.
Summary of ratios
| Ratio | 2009 | 2010 | 2011 | Industry Average | See Notes |
|---|---|---|---|---|---|
| % Return on capital employed | 26.9 | 27.9 | 22.5 | 26% | 1 |
| Asset turnover (times) | 1.81 | 1.70 | 1.90 | 1.79 times | 2 |
| Net profit margin (%) | 14.9 | 16.4 | 11.8 | 14.5% | 3 |
| Current ratio | 1.23:1 | 1.22:1 | 1.3:1 | 1.5:1 | 4 |
| Acid test ratio | 0.87:1 | 0.87:1 | 0.99:1 | 1.03:1 | 5 |
| Debtors collection period (days) | 85 | 91 | 102 | 83 days | 6 |
| Gearing ratio (%) | 81.5% | 70.8% | 63.7% | 32% | 7 |
| Labour costs as % of sales | 18.9 | 18.5 | 18.9 | 18.1% | 8 |
| Operating costs as % of sales | 85.1 | 83.6 | 88.2 | 85.5% | 9 |
| Distribution costs as % of sales | 8.98 | 9.24 | 9.24 | 9.5% | 10 |
| Administration costs as % of sales | 3.87 | 4.15 | 4.09 | 4.5% | 11 |
Follow the link below to see some possible commentary on the ratios.
Answers - question 2
Profiting from mobiles
 The news
Motorola's strategy may be starting to pay off as the company announced a surprise profit and topped forecasts for the first quarter. On Thursday, the company said it earned $69 million, or 3 cents per share, in the quarter. During the same quarter a year ago, it lost $231 million, or 13 cents per share. Analysts had expected Motorola to lose 1 cent to 3 cents a share in the first quarter.
The handset maker has been trying to turn around its business for the past couple of years. Ever since its Razr phone commanded consumer attention, Motorola has had a hard time finding a new hit. The company has been shifting its strategy and has started focusing more on smartphones. Motorola co-chief CEO Sanjay Jha said demand has been outstripping supply for the 'Droid X,' one of its smartphones powered by Google's Android operating system.
'As we continue to execute on our business strategy, we are in a strong position to continue improving our share in the rapidly growing smartphone market and improving our operating performance,' Jha said.
Motorola sold 2.3 million smartphones in the first quarter. Previously, it had said that it would sell fewer than 2 million such phones. The smartphone focus, in addition to stronger sales in non-phone products, helped lift the company to profitability.
That said, Motorola's new strategy has resulted in fewer phone sales overall. In fact, in the first quarter, the company ceded its title as the largest maker of cell phones to Apple. Motorola sold a total of 8.5 million phones in the quarter. Apple sold 8.8 million iPhones. When the Razr was in its heyday four years ago, Motorola sold 46.1 million phones in the first quarter, the Associated Press reported.
While the sales volume is lower, the company can charge more for its higher-end handsets. But the price difference isn't enough to offset the losses in revenue; at least not yet.
"The world economies are today showing some underlying signs of a rebound, which, if not significantly disrupted by world events, could have a favourable impact on our markets as customers move towards renewing their capital spending," said the chairman and chief executive.
The theory
All companies are required by law to keep full and accurate records of their financial transactions. In this article we can see the key figures from Motorola's accounts being announced. We are interested in two parts of a company's accounts, namely its balance sheet and its profit and loss account. For more details on these accounts, follow the links below.
The balance sheet
The profit and loss account
Use of accounts
Ratios
Liquidity ratios
Gearing ratio
Questions
- Explain what is meant by the term 'operating profit'.
- Examine how Motorola might have improved its operating profit over the last twelve months.
- Explain why the acid test and gearing ratios would be of interest to prospective investors in Motorola.
- Analyse whether the growth in consumer capital spending will help Motorola increase its profitability.
Suggested answers
3.6 Ratio analysis - simulations and activities
In this section are a series of simulations and activities on the topic - Ratio analysis.
DragIT - Profitability ratios
In the image below, try clicking on the arrows beside each variable to see the impact of changes on the profitability ratios. Once you have done that, you may like to have a go at the questions below.

1 |
Profitability ratiosAn increase in expenses will lead to a fall in gross profit. |
2 |
Profitability ratiosA decrease in the cost of goods sold will lead to an increase in net profit. |
3 |
4 |
Net profit marginWhich of the following will increase the net profit margin? |
DragIT - Build the profitability ratios

Are you confident that you know the formulae for the profitability ratios? See if you can construct the ratios below. Drag the appropriate blue button from on the right to the orange target area to build the formula. Try and get it right first time rather than by trial and error. Click on 'Check answer' once you are confident the answer is right. If you want another go, simply click on 'Reset'.
ROCE
Gross profit margin
Net profit margin
DragIT - Liquidity ratios
In the image below, try clicking on the arrows beside each variable to see the impact of changes on the liquidity ratios. Once you have done that, you may like to have a go at the questions below.

1 |
Stock changes - acid test ratioWhen stocks increase the value of the acid test ratio will fall. |
2 |
Stock changes - current ratioWhen stocks increase the value of the current ratio will fall. |
3 |
Current ratioWhich of the following is the correct formula for the current ratio? |
DragIT - Build the liquidity ratios

Are you confident that you know the formulae for the liquidity ratios? See if you can construct the ratios below. Drag the appropriate blue button from on the right to the orange target area to build the formula. Try and get it right first time rather than by trial and error. Click on 'Check answer' once you are confident the answer is right. If you want another go, simply click on 'Reset'.
Acid test ratio
Current ratio
DragIT - Balance sheet
In the image below, try clicking on the arrows beside each variable to see the impact of changes on the efficiency and liquidity ratios.
DragIT - Efficiency ratios
In the image below, try clicking on the arrows beside each variable to see the impact of changes on the efficiency ratios. Once you have done that, you may like to have a go at the questions below.

1 |
Stock changes - stock turnoverWhen stocks increase the value of the stock turnover ratio will fall. |
2 |
Debtor changes - debtor days ratioWhen debtors fall the value of the debtor days ratio will fall. |
3 |
Current ratioWhich of the following is the correct formula for the stock turnover ratio? |
4 |
Efficiency ratiosMatch the formulae with the appropriate ratios. |
DragIT - Build the financial efficiency ratios


Are you confident that you know the formulae for the financial efficiency ratios? See if you can construct the ratios below. Drag the appropriate blue button from on the right to the orange target area to build the formula. Try and get it right first time rather than by trial and error. Click on 'Check answer' once you are confident the answer is right. If you want another go, simply click on 'Reset'.
Asset turnover ratio
Stock turnover ratio
Debtor days ratio
Creditor days ratio

DragIT - Build the shareholder ratios


Are you confident that you know the formulae for the shareholder ratios? See if you can construct the ratios below. Drag the appropriate blue button from on the right to the orange target area to build the formula. Try and get it right first time rather than by trial and error. Click on 'Check answer' once you are confident the answer is right. If you want another go, simply click on 'Reset'.
Dividend per share
Dividend yield

DragIT - Gearing ratio
In the image below, try clicking on the arrows beside each variable to see the impact of changes on the gearing ratio. Once you have done that, you may like to have a go at the questions below.

1 |
Loan capital changes - gearingWhen loan capital increases the value of the gearing ratio will fall. |
2 |
Gearing ratio valueA high gearing ratio is good for a firm as it will ensure they have funds for expansion. |
3 |
Sources of finance and gearingWhich of the following sources of finance will increase the gearing ratio? |
4 |
Sources of finance and gearingWhich of the following sources of finance will reduce the gearing ratio? |
DragIT - Build the gearing ratio

Are you confident that you know the formulae for the gearing ratio? See if you can construct the ratios below. Drag the appropriate blue button from on the right to the orange target area to build the formula. Try and get it right first time rather than by trial and error. Click on 'Check answer' once you are confident the answer is right. If you want another go, simply click on 'Reset'.
Gearing ratio
DragIT - Ratio analysis
In the image below, try clicking on the arrows beside each variable to see the impact of changes on the profitability ratios. Once you have done that, you may like to have a go at the question below.

1 |
Ratio analysisMatch the formulae below to the ratio which they calculate. |