Economic growth and the aggregate supply curve
Syllabus: Explain,
using an LRAS diagram, economic growth as an increase in potential
output caused by factors including increases in the quantity and
quality of resources, leading to a rightward shift of the LRAS curve.
You can use aggregate demand and supply diagrams to illustrate economic growth.
Increasing Potential Economic Growth (Capacity)
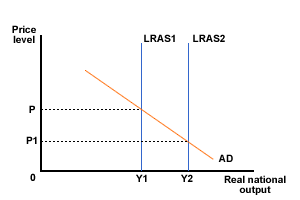
An increase in potential economic growth will cause the long
run aggregate supply curve to shift to the right as in figure 1 below.
Remember economic growth is often associated with increases in Real
Investment which increases the Quantity and Quality of Factors of
Production, a key element of this is investment in infrastructure (see Supply Side Policies).
Neoclassical LRAS

LRAS Curve shifts to the right showing Full Employment
(capacity or potential production if all resources are used
efficiently) has increased from Y1 to Y2
Figure 1 - Increase in long-run aggregate supply Neoclassical

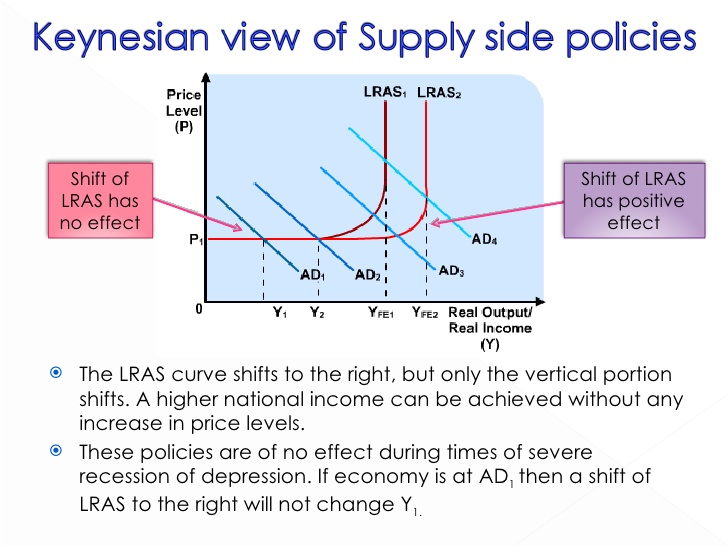
Figure 2 - Increase in long-run aggregate supply Keynesian
Again LRAS Curve shifts to the right (but different representation) showing Full Employment (capacity or potential production if all resources are used efficiently) has increased from Yfe1 to Yfe2
If you wish to see more about Supply Side Policies open Page 165 onwards
Actual Economic Growth is shown by the change in equilibrium output in either diagram so just to be clear - shifting the LRAS itself shows changes in potential growth (Full Employment, Capacity etc changes) and actual growth is shown where AD and AS interact to set the equilibrium which may not be at full employment according to keynesian Economists and policy makers.