Price controls - short answer

Question 1
The table below gives the levels of demand and supply for a good.
| Price (£) | Demand ('000 per month) | Supply ('000 per month) |
|---|---|---|
| 11 | - | 200 |
| 10 | 30 | 180 |
| 9 | 60 | 160 |
| 8 | 90 | 140 |
| 7 | 120 | 120 |
| 6 | 150 | 100 |
| 5 | 180 | 80 |
| 4 | 210 | 60 |
| 3 | 240 | 40 |
| 2 | 270 | 20 |
| 1 | 300 | - |
(a) Draw the demand and supply curves on a graph.
(b) What is the equilibrium price and quantity?
(c) If the government supports a minimum price of £10, by how much does supply exceed demand?
(d) If the government controls the price at a maximum of £3, by how much does demand exceed supply?
(e) If the government placed a subsidy of £5 per unit on this good, what would be the new equilibrium price and quantity?
(f) How much would this subsidy cost the government per month?
Question 2
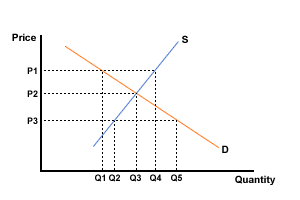
The diagram below represents the market for olives.

The market for olives
The Italian government decides to protect the production of olives and they agree to set a minimum price. Any olives that are left unsold at the minimum price, the government will buy at that price.
(a) What is the equilibrium price in the absence of any intervention?
(b) If the government set a minimum price of P3, what would be the equilibrium market price?
(c) What would be the level of demand at this price?
(d) If the government set a minimum price of P1, what would be the market price?
(e) What would be the level of olives demanded at this price?
(f) What would be the level of olives supplied at this price?
(g) How many olives would the government have to buy if the minimum price was P1?
(h) Copy the diagram and shade the area that represents the total spending by consumers on olives at a price of P1.
(i) On the same diagram, show the level of government spending on excess olive production.
