Inflationary and deflationary gaps
Syllabus: Explain, using a diagram, that if the economy is in equilibrium at a level of real output below the full employment level of output, then there is a deflationary (recessionary) gap.Syllabus: Discuss why, in contrast to the monetarist/new classical model, the economy can remain stuck in a deflationary (recessionary) gap in the Keynesian model.
If you would prefer to view this interaction in a new web window, then please follow the link below:
- Demand deficient unemployment is the same as cyclical unemployment
- The actual Deflationary gap is measured between Y* and Yfe and should be labelled on your diagram
- The definition of a Deflationary Gap is the difference between equilibrium level of GDP and the Full Employment level of GDP
Syllabus: Discuss why, in contrast to the monetarist/new classical model, increases in aggregate demand in the Keynesian AD/AS model need not be inflationary, unless the economy is operating close to, or at, the level of full employment.
If you would prefer to view this interaction in a new web window, then please follow the link below:
Important points:
- Demand Pull Inflation is when there is excess demand in the economy pulling prices upwards
- The actual Inflationary gap on this diagram is measured between P and P1 and should be labelled on your diagram
- The definition of a Inflationary Gap is the difference between equilibrium level of GDP and the Full Employment level of GDP
 You can even draw this with a Keysian LRAS but I cannot find an example on Google images
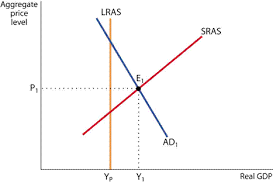
Figure 1 Inflationary gap is from Yf to Y1
In Figure 1 the short run equilibrium is at Y1 which is a greater level of real output being produced than full employment: The economy is booming and labour and capital are being used beyond what is sustainable in the long run (workers are on overtime - at overtime rates, and factories are being used in shifts - operating beyond normal hours - so little or no down time for maintainance). This situation caused costs of production to rise and therefore the price of goods and services (Inflationary) rise. The inflation causes consumer real income to decrease (cannot buy as much due to higher prices) and AD decreases moving along AD1 until a new equlibrium is reached on the LRAS at higher price level.
Economic Growth Changes
Any fluctuations in growth must be caused either by changes on the demand-side or changes on the supply-side of the economy. So what can cause these demand-side or supply-side changes?
1. Demand-side shocks (Shocks are sudden changes)
These might be caused by a variety of different events, but they all cause demand to change more suddenly than had been expected. A downturn is normally more usual and the more difficult to deal with, although excessive growth may result in inflationary pressures. Such shocks might have resulted from policies to deal with a previous bout of inflation, or a subsequent rise in unemployment or any event that reduces consumer confidence and causes demand to fall. An example is the impact of bird flu in a country. A negative demand-side shock is illustrated by shifting AD left.
2. Supply-side shocks
Supply-side shocks can be just as devastating, though, as their name suggests, they are the result of something happening on the other side of the economic equation. It could be a war, drought, natural catastrophe or anything that causes the supply chain to be adversely affected. A supply-side shock is illustrated by shifting AS left.
Remember business and economic planners like stability and certainty, so any 'surprise' event can cause expectations, calculations and confidence to be blown off course.
Other possible causes of a cyclical pattern of growth could be:
- Policy-induced changes - politicians have often been known to put in place policies to boost the economy. It could be cynical to suggest that this often occurs around election time, but then again it does. This can lead to booms which lead to the incoming government having to deflate to slow the economy down again. There is much evidence to suggest the existence of an electoral cycle.
- Imported cycles - if the rest of the world is growing in cycles, then this will affect particular countries. Exports may fluctuate, which means that aggregate demand will change and therefore growth changes
- Expectations - expectations can have a powerful effect on growth. For example if firms expect there to be a slowdown, they may delay investment plans. If they do that, then aggregate demand will fall. If aggregate demand falls, so does growth.