Topic pack - Macroeconomics - introduction
Welcome to this Triple A Learning topic pack for Macroeconomics. The pack has a wide range of materials including notes, questions, activities and simulations.
A few words about Navigation
So that you can move to the next page in these notes more easily, each page has navigation tools in a bar at the top and the bottom. These tools are shown below.
![]() The right arrow at the top or bottom of the page will take you to the next page of content.
The right arrow at the top or bottom of the page will take you to the next page of content.
![]() The left arrow at the top or bottom of the page will take you to the previous page.
The left arrow at the top or bottom of the page will take you to the previous page.
![]() The home button will take you back to the table of contents for the pack.
The home button will take you back to the table of contents for the pack.
The pack is split into a series of sections and to access each section, the easiest way is to use the table of contents on the left-hand side of the page. To return to the full table of contents, please click on the 'home button' at any stage.
Higher level extension material
Some of the material in this pack relates to the higher level extension topics in the Economics guide. This material is marked by icons as follows:

This icon indicates the start of the higher level extension material.

This icon indicates either:
- The higher level extension material continues on the next page or
- The higher level extension material continues from the previous page

This icon indicates the end of the higher level extension material.
To start viewing the contents of the pack, please click on the right arrow at the top or bottom of the page.
Key terms - the level of economic activity
One of the key things you need to be sure to know are the definitions of all key macroeconomics terms. In this section we give you explanations and definitions of terms relevant to the level of economic activity.

If you would prefer to view this interaction in a new web window, then please follow the link below:
Key terms - aggregate demand and supply
One of the key things you need to be sure to know are the definitions of all key macroeconomics terms. In this section we give you explanations and definitions of terms relevant to aggregate demand and supply.

If you would prefer to view this interaction in a new web window, then please follow the link below:
Key terms - macroeconomic objectives
One of the key things you need to be sure to know are the definitions of all key macroeconomics terms. In this section we give you explanations and definitions of terms relevant to macroeconomic objectives.

If you would prefer to view this interaction in a new web window, then please follow the link below:
Key terms - macroeconomic policy
One of the key things you need to be sure to know are the definitions of all key macroeconomics terms. In this section we give you explanations and definitions of terms relevant to macroeconomic policy.

If you would prefer to view this interaction in a new web window, then please follow the link below:
Aims of the economics course
The aims of the economics course at HL and SL are to enable students to:
- develop an understanding of microeconomic and macroeconomic theories and concepts and their real-world application
- develop an appreciation of the impact on individuals and societies of economic interactions between nations
- develop an awareness of development issues facing nations as they undergo the process of change.
Assessment Objectives
Having followed the economics course at HL or SL, students will be expected to:
- AO1 Demonstrate knowledge and understanding of specified content
- Demonstrate knowledge and understanding of the common SL/HL syllabus
- Demonstrate knowledge and understanding of current economic issues and data
- At HL only: Demonstrate knowledge and understanding of the higher level extension topics
- AO2 Demonstrate application and analysis of knowledge and understanding
- Apply economic concepts and theories to real-world situations
- Identify and interpret economic data
- Demonstrate the extent to which economic information is used effectively in particular contexts
- At HL only: Demonstrate application and analysis of the extension topics
- AO3 Demonstrate synthesis and evaluation
- Examine economic concepts and theories
- Use economic concepts and examples to construct and present an argument
- Discuss and evaluate economic information and theories
- At HL only: Demonstrate economic synthesis and evaluation of the extension topics
- AO4 Select, use and apply a variety of appropriate skills and techniques
- Produce well-structured written material, using appropriate economic terminology, within specified time limits
- Use correctly labelled diagrams to help explain economic concepts and theories
- Select, interpret and analyse appropriate extracts from the news media
- Interpret appropriate data sets
- At HL only: Use quantitative techniques to identify, explain and analyse economic relationships
Section Two Structure
Unit two has four core sub-topics and one HL extension.
Using the pack
Questions

At the end of the section there are a number of questions you can attempt to check your understanding of the concepts involved. When attempting a question you should always be clear about what the question is actually asking you to do. A key to doing this is to look for the command term that starts the question. This command term will tell you whether the question needs an explanation, requires some analysis or expects you to offer some insights or draw conclusions of your own. In may sound obvious but always remember that the success of passing an examination or test is to ensure that the answer you give corresponds to the question that is being asked!
Pauses for thought

Throughout the pack there will be times when you are asked to think about some issues relating to macroeconomics in a broader sense. This may involve you reflecting upon the validity of the information you have found or been given or encourage you to make connections with other areas of knowledge. You may want to talk about some of these issues with other students family members or friends as some of the ideas can be quite contentious and lead to some interesting discussions.
2.1 The level of overall economic activity (notes)
In this section, we consider the level of overall economic activity.
By the end of this section you should be able to:

- Describe, using a diagram, the circular flow of income between households and firms in a closed economy with no government.
- Identify the four factors of production and their respective payments (rent, wages, interest and profit) and explain that these constitute the income flow in the model.
- Outline that the income flow is numerically equivalent to the expenditure flow and the value of output flow.
- Describe, using a diagram, the circular flow of income in an open economy with government and financial markets, referring to leakages/withdrawals (savings, taxes and import expenditure) and injections (investment, government expenditure and export revenue).
- Explain how the size of the circular flow will change depending on the relative size of injections and leakages.
- Distinguish between GDP and GNP/GNI as measures of economic activity.
- Distinguish between the nominal value of GDP and GNP/GNI and the real value of GDP and GNP/GNI.
- Distinguish between total GDP and GNP/GNI and per capita GDP and GNP/GNI.
- Examine the output approach, the income approach and the expenditure approach when measuring national income.
- Evaluate the use of national income statistics, including their use for making comparisons over time, their use for making comparisons between countries and their use for making conclusions about standards of living.
- Explain the meaning and significance of "green GDP", a measure of GDP that accounts for environmental destruction.
- Explain, using a business cycle diagram, that economies typically tend to go through a cyclical pattern characterized by the phases of the business cycle.
- Explain the long-term growth trend in the business cycle diagram as the potential output of the economy.
- Distinguish between a decrease in GDP and a decrease in GDP growth.

- Calculate nominal GDP from sets of national income data, using the expenditure approach.
- Calculate GNP/GNI from data
- Calculate real GDP, using a price deflator.
Overall economic activity - introduction
 In this section, we consider the following sub-topics in detail:
- Economic activity
- Circular flow of income model
- Measures of economic activity
- The business cycle
- Short term fluctuations and long term trend
Peoples' living standards are clearly dependent upon the amount of goods and services that they are able to consume. Therefore, the production and exchange of these goods and services in the economy, the level of economic activity, will directly affect peoples' wellbeing. A major aim of governments is to improve the living standards of its citizens by increasing the amount of economic activity and the rate at which this activity grows.
To get a better understanding of the nature of economic activity, we will explore a simple model of an economic system - the circular flow of income. This will enable us to see the various elements of the economy and how they relate to each other. As will all economic models, it will be based on a number of simplifying assumptions. The use of assumptions it allows us to make some simple predictions that relate to the real world.

Pause for thought
Economics is considered by many to be a social science. It uses models based on simplifying assumption as tools to help understand complex systems, and problems, and to make predictions about the real world. Is this approach used in other subjects you study? If not, why not?
A main aim of government is to increase the wealth of the economy by maintaining or increasing the level of economic growth. Economic growth is measured in terms of the increase in national income over a period of time. What do we understand by the term National Income and how do we measure it? In this section we look at the issues relating to national income and its measurement.
One of the other interesting things about economic activity is, that over time, it constantly changes. These changes can occur from year to year as the economy moves through a business cycle, but also over the longer term as the economy experiences growth or decline.
The circular flow of income model (1)
If you would prefer to view this interaction in a new web window, then please follow the link below:
Circular flow - two sector closed
If you would prefer to view this interaction in a new web window, then please follow the link below:
Circular flow - two sector open
If you would prefer to view this interaction in a new web window, then please follow the link below:
Circular flow - three sector open
If you would prefer to view this interaction in a new web window, then please follow the link below:
Circular flow - government
How important is the role of government in the economy?
In the 3-sector open economy circular flow of income, we could also represent the government separately in this circular flow - here's an alternative representation of the 3-sector open economy circular flow. It shows exactly the same flows, but represents them a little differently.

Figure 1 Circular flow - 3 sector, open economy
In this diagram, why a big box in the middle for government? Just how big a player do you think the government is in the economy?

Useful Internet sites for research are:
- The World Bank site. To access details about countries and economies, follow this link.
- The OECD statistics portal.
- Identify the proportion of national income represented by government expenditure in your country.
- Identify the proportion of national income taken up by government spending for the following countries
- USA
- Tanzania
- Sweden
- Cuba
- Hong Kong
- Considerthe differences in the proportion of national income represented by government spending in the countries above and with your country.
- Reflect on the reasons for these differences and remember these findings as you work your way through the macroeconomics pack.
The circular flow of income model (2)
In a centrally planned economy, where the government takes direct responsibility for planning, producing and distributing goods and services to the population, what will the circular flow look? Think about this, then click CENTRALLY PLANNED to see how our answer matches with yours.
Yes, this is an example of a 2-sector economy. The government is the same as firms, since all firms are owned by the government (state). However, the economy may still be open or closed.
Look again at the circular flow model for a three-sector economy.
Figure 5 Circular flow: A 3 sector, open economy
Circular flow - a summary
A reminder:
The leakages (W) from the circular flow are:
- Savings (S)
- Taxation (T)
- Purchase of imported goods and services (M) (goods and services in, but money out - national firms pay overseas ones for goods and services)
The injections (J) are
- Investment (I) - expenditure on capital goods
- Sale of exports (X) (goods and services out, but money now flows in)
- Government Expenditure (G)
An economy is in equilibrium when injections (J) match the leakages (W).
The standard codes used in this model, and in economics in general, are:
Y = National Income
C = Domestic Consumption
S = Savings
M = Imports
T = Taxation
I = Investment
X = Exports
G = Government Spending
The circular flow model of an economy is very useful within the study of economics. We will be looking at the actions and behaviour of firms and households, and how governments interact with them. We will also look at how changes in the leakages and injections affect the stability of an economy.
Some mathematics

Economists offer try to use mathematics to simplify the analysis of the circular flow of income model. Income is passed on in the circular flow of income through consumer spending or leaked out though savings, taxation or spending on imports. The proportion of national income spent on consumption is called the average propensity to consume (APC)
![]()
The proportion of national income save is called the average propensity to save (APS)
![]()
Economists have a penchant for what happens at the margin, or when variables change in an incremental way. Anytime there is an incremental change in national income consumption, savings, taxation and imports will also change by a certain proportion. Whereas average propensity is concerned with the proportion of total national income that is passed on or leaked from the circular flow of income, marginal propensity is used to describe the proportion of an incremental change in income that is passed on or leaked from the circular flow of income, .
We can, therefore, identify the marginal propensity to consume as the proportion of a change in national income that is spent on consumption
![]()
Similarly, the proportion of a change in national income that is saved, is called the marginal propensity to save (MPS)
![]()
The proportion of a change in national income that is paid to the government in tax, is called the marginal rate of taxation (MRT)
![]()
The proportion of a change in national income that is spent on imported goods, is called the marginal propensity to import (MPM)
![]()

Now have a go at the following questions:
- Assuming a two sector closed economy and that the APC = 0.6 and national income is $1000, calculate the:
- level of consumer spending
- level of savings in the economy.
- Assuming a three sector open economy and that the MPS and MRT and MPM are all 0.2, and national income changes by £2000, calculate the change in the level of:
- consumer spending
- tax revenue
- import spending
- Assuming a three sector open economy (however would also be the case for a two sector closed and open economy) the MPC is 0.5, and national income falls by £1500, calculate:
- the change in the amount of money that leaks out of the circular flow of income
- the change in the amount of consumer spending.
These concepts will be revisited later in later section when we look at what causes national income to change.
Measures of economic activity
In the last section, we looked at the circular flow of income and established that the total flow of income around the economy arising from economic activity is called National Income. There are three different ways of measuring this income. First let's remind ourselves of the circular flow.
Figure 1 Circular flow of income
We can measure national income in three different ways. We could look at the total level of expenditure on goods and services being produced by firms. This would include consumer expenditure (C), investment expenditure (I), government expenditure (G) and net export spending (X-M) i.e. C + I + G + (X-M).
Alternatively, we could look at the total level of income generated. This would include all factor incomes - wages, profit, rent and interest. A final possibility is to measure the total level of output produced by firms.
All three of these are methods of calculating national income:
- Total expenditure
- Total income and
- Total output
Each should give the same result, because each is measuring essentially the same thing; i.e. a flow of income over a period of time. The logic of this is that, for the economy as a whole, the value of all output equals what is spent on the output, and what is spent on the output becomes income to those who have produced the output. Thus NATIONAL INCOME = NATIONAL OUTPUT = NATIONAL EXPENDITURE.

For an excellent review of the operation of the Circular Flow of Income, watch the video on YouTube by Paj Holden.
Examining the three methods of calculating national income
Theoretically a government can attempt to find out the level of economic activity by trying to measure the total amount of output produced (the output method) or the income generated from producing it (the income method), or the total expenditure on purchasing it (the expenditure method). Governments try to calculate how much output, income, and expenditure takes place within one year.

To get a basic overview of national income accounting, and in particular the three methods used to measure national income, review the following sites:
- Wikipedia - Measures of national income and output
- Tutor 2U - Measuring national income

- Describe the three methods of calculating national income and explain why they should, in theory, produce the same result
- Identify the problems encountered when measuring national income using the three methods.
- Exaplain how these problems are overcome.

To find national income account data relating to these three accounting methods for countries within the Organization for Economic Cooperation and Development (OECD), the StatExtracts site is particularly useful.. You can see the site in the web window below, or follow the previous link to open the site in a new web window.
Find the national accounts link by scrolling down the list on the left hand navigational bar and examine the different measures of national income.
However, in practice a number of difficulties arise when trying to ascribe an accurate monetary value to income, output and expenditure. These difficulties include:
- The unofficial, shadow or informal economy - in which the output is not declared. This is because some producers do not want to pay tax or may be involved in illegal operations. If we look at the expenditure and income methods of measuring national income, we can get some idea of how much undeclared work might be happening. Some of us will be spending income we have not declared! Whatever the scale of this shadow economy, it means that a part of the GDP is understated. The size of the unofficial economy will vary from country to country.
-
 Non-marketed goods and services - some transactions do not involve money changing hands. For example, people undertaking voluntary work or helping decorate a friend's house does not appear as earned income, but it can be argued to be part of the production of the economy. Similarly, in less developed countries, much economic activity is part of the subsistence economy in which people grow/make things for themselves and the goods are not sold for money in markets. It has been argued passionately by some that women who stay at home to look after children should have this service valued and included in national income.
 - Government spending - in the expenditure method of calculating national expenditure, government spending on goods and services is included. However, some government expenditure goes to producing public goods, for example defence, which are not sold. So there is a problem in ascribing an appropriate value to these goods for national income calculation.
What is GDP? (video)

For a basic introduction to GDP watch the video below - What is GDP? (You can do this in the web window below or follow the previous link to open the page in a new web window)
Different national income measures
Gross National Product (GNP) and Net National Product (NNP) - gross and net measures
Just as the national assets (the capital stock) work towards creating new wealth, so some of them wear out and need to be replaced (this wearing out is called depreciation). Unless worn out capital is replaced, the national capital stock shrinks and negative economic growth could be recorded. To stop this from happening, part of national income each year must be invested to repair, replace and make good that part of the capital stock, which ceases to be adequate for use.
When we mention Gross National Product (GNP), we are referring to national income BEFORE the amount needed to replace capital has been deducted. This amount is called capital consumption (or depreciation) and, once this has been deducted, we call the figure Net National Product (NNP).

Net National Product
Net National Product is calculated using the following formula:
NNP = GNP minus capital consumption
Increasingly gross national product (GNP) is being referred to a gross national income (GNI). So remember if you are given GNI data it is the same at GNP!
Gross Domestic product (GDP) and Gross National Product (GNP) - national and domestic
Gross Domestic Product (GDP) is similar to Gross National Product (GNP/GNI), but it only measures the flow of output produced within the country. GNP/GNI adds in property income flowing to domestic economic agents from their investments outside the country. It also includes a deduction of those sums that flow out of the country. Property income is income derived from the ownership of assets in the form of profits, interest and rent.

Net National Product
Gross National Product is calculated using the following formula:
GNP/GNI = GDP + net property from abroad (or minus net property income paid abroad)
Although this may appear to be a rather dry, inconsequential topic, the question of property income flows is often of life and death significance for millions of people in the developing countries. While net property income is often positive for developed countries, the figure will inevitably be negative for many of the poorest countries of the world. This reflects their indebtedness to the financial institutions and governments of the industrialised countries and manifests itself in the form of large outflows of interest repayments. It often also reflects the domination of less developed countries by multinational corporations who repatriate profits made from these countries to their centre of operations, inevitably somewhere in the richer part of the world. The impact on living standards of the peoples of these countries is dramatic. These issues are discussed in more detail in section 4.5
Real v money data
One of the most crucial things to look at whenever you look at growth and GDP figures is whether they are in real terms.

Real terms
If a variable is in real terms this means that the effects of inflation have been removed.
If they are not in real terms, then they are described as being in nominal or money terms. This means that they are valued at the same value as money was worth at the time the data was recorded.
However, just to muddle things, the data may not be described as being in real terms. The expression that is often used is that the data is at constant prices. This means that the whole series is expressed at the prices that were ruling in a particular year, e.g. at 2008 prices. If the data is expressed in nominal or money terms, then it may be described as being valued at current prices. So, remember:
Current prices - includes the impact of inflation, as output is valued at prices currently prevailing in markets.
Constant prices - the effect of inflation has been removed and the variable is in real terms.
GDP at constant and current prices - Italy
GDP at constant and current prices - Turkey
The brown line shows GDP at current prices, and this clearly grows a lot faster than GDP at constant prices. The difference between the two datasets is simply inflation. In this graph, GDP is expressed at the prices ruling in the base year of the index.
So, first thing when you look at a piece of data - is it in real or nominal terms?
Current and constant prices

The GDP deflator is a broader index of price increases than the consumer price index. It includes the prices of capital goods as well as consumer goods. It can be used to calculate real changes in the level of GDP. We say that it is used to convert GDP at current prices to GDP at constant prices.
The following table show the GDP deflator indices for two countries, Italy and Turkey
| 2000 | 2001 | 2002 | 2003 | 2004 | 2005 | 2006 | 2007 | 2008 | 2009 | |
|---|---|---|---|---|---|---|---|---|---|---|
| Italy | 100.00 | 102.96 | 106.32 | 109.63 | 112.52 | 114.84 | 116.95 | 119.96 | 123.26 | 125.91 |
| Turkey | 230.07 | 351.67 | 483.28 | 595.74 | 669.62 | 717.05 | 783.96 | 832.73 | 932.61 | 980.65 |
The formula for the GDP deflator is as follows:
![]()
Hence to calculate Real GDP the formula can be rearranged as follows
![]()

Task
- Calculate the increase in the overall level of price increases between 2000 and 2009 for both countries. This will give you a clue why nominal GDP has increased over the period.
- The table below shows the GDP figure at current prices in US $.
| Country Name | 2000 | 2001 | 2002 | 2003 | 2004 | 2005 | 2006 | 2007 | 2008 | 2009 | 2010 |
|---|---|---|---|---|---|---|---|---|---|---|---|
| Italy | 1,097,344,131,196 | 1,117,358,481,432 | 1,218,921,247,883 | 1,507,171,243,792 | 1,727,825,472,922 | 1,777,693,953,639 | 1,863,380,936,371 | 2,116,201,719,593 | 2,296,628,950,818 | 2,112,780,152,061 | .. |
| Turkey | 266,567,531,990 | 196,005,288,838 | 232,534,560,775 | 303,005,302,818 | 392,166,274,991 | 482,979,839,238 | 530,900,094,505 | 647,155,131,629 | 730,337,495,198 | 614,603,094,839 | .. |
- For the above nominal GDP data calculate the real GDP and add it to a spreadsheet
- Plot the GDP at current prices (nominal) and the GDP at constant prices (real) for both countries between 2000 and 2009. Time should be plotted along the X axis.
- Are there any differences between the two graphs for each country?
- What accounts for the difference between the two sets of data?

Using index numbers

Much of the data you will come across in your course is presented in the form of index numbers and index series. Let's review how index numbers work.
| 2000 | 2001 | 2002 | 2003 | 2004 | 2005 | 2006 | 2007 | 2008 | 2009 | |
|---|---|---|---|---|---|---|---|---|---|---|
| Italy | 89 | 91 | 93 | 96 | 98 | 100 | 102 | 104 | 107 | 108 |
| Turkey | 29 | 45 | 66 | 82 | 91 | 100 | 111 | 120 | 133 | 141 |
The following shows the consumer price index for two countries, Italy and Turkey. The consumer price index is a number calculated every year, which indicates how much on average consumer prices have risen since the previous year.
If we look at prices in Italy between 2000 and 2001 we can see that the consumer price index has increased from 89 to 91. The first point to note is that this DOES NOT MEAN that prices have gone up by 2%. That is not how index numbers work!
To calculate the increase in consumer prices we would need to find the percentage change between these two index numbers.
![]()
In the above example
![]()
We can say, therefore, that the prices have gone up by 2.3% over the two years.

Now it's your turn
Calculate the increase in consumer prices:
- from 2003 and 2007 for both countries
- from 2001 to 2009 for both countries
- from 2008 to 2009 for both countries
NB The index number in 2005 for both countries is 100. This means that the index has been calculated in such a way that all prices are being compared with those that existed in 2005. 2005 is referred to as the base year. Therefore, when you use an index, it is said that you are valuing something in terms of constant prices i.e. in the case of the example, all prices are benchmarked against those that existed in 2005.

Total and per capita
 So far we have been talking about national income as the total amount of income earned by the economy and this is an important measure. However, if we want to compare national income between countries, we need to adjust the measure.
For example, we would expect the USA to have a higher national income than France, for example, as they have approximately five times the population and more people means the USA should be able to produce more goods and servies. However, what is more important is whether, on average, each person in the USA produces more in value more than each person in France. To calculate this figure, we divide the national income by the population to get 'national income per person' or 'per capita'. Using this measure we are in a better position to compare standards of living between countries. However, when using national income per capita to make international comparisons of welfare, there are still a number of additional factors that need to be taken into account.
Case study - rapid economic growth

 China's development could be advanced considerably if the government and the people abandoned their unhealthy fixation on the rise of gross domestic product.
A recent edition of The South China Morning Post carried a feature expressing the point in a particularly enlightening fashion.
What's so great about rapid economic growth anyway?
For the princely sum of 14,500 yuan (HK$16,800), the magazine's Beijing correspondent joined 30 or so mainlanders for a gruelling 10day, five-country coach tour of Europe.
Watching cultures collide - even at second hand - is always illuminating. No doubt the speed at which the tourists swept past the architectural and artistic glories of Paris, pausing only to snap the obligatory photographic record of their presence before heading off for an orgy of handbag shopping, would have raised some supercilious French eyebrows.
But equally, for their part the visitors were taken aback by the leisurely pace of life in Europe, where the locals linger over coffee, prohibit bus drivers from working more than 12 hours a day, and even stop their cars for pedestrians.
"With a pace like that, how can their economies keep growing?" the Chinese guide asks. "Only when you have diligent, hardworking people will the nation's economy grow."
It's a theme that recurred constantly as the group tore around Europe, with the visitors marvelling at the willingness of French workers to go on strike, and at how many years the Italians take to build a new highway. "If this were China, it would be done in six months," one says. "That's the only way to keep the economy growing."
What's remarkable here is not that the Chinese tourists found Europe slow-moving - Americans have been saying the same for decades - but that their automatic assumption that fast growth is the best, indeed the only, measure of a country's economic success.
This begs the question: what's so great about rapid growth anyway?
That might sound like a dumb thing to ask, but the more you think about it, the more the question makes sense.
The growth our tourists were talking about was in gross domestic product (GDP), which measures the final value of all goods and services produced by an economy.
GDP was developed in the US during the Great Depression, and came into its own during the second world-war as a measure of how many guns, ships and planes the US economy was able to produce. It has been the standard measure of economic strength ever since.
But GDP measures quantity, not quality. In other words, although it says a great deal about how much stuff you can churn out, it tells you very little about the state of your economic development.
For example, GDP counts all investment as positive, whether or not that investment turns out to be productive in the longer run.
So if a country pours resources into building pyramids, its GDP will rise sharply while they are under construction. But considering that pyramids, once complete, add nothing to the economy (except maybe generating tourist revenues four millennia later), it is difficult to claim that their construction furthers economic progress.
This consideration is especially important for China. Although the country's leaders aren't building pyramids, they may be doing the modern equivalent: building hundreds of expensive airports, high-speed rail lines and glittering financial centres that can never hope to generate a return on the investment involved. These projects add to GDP growth in the short term but do nothing to advance economic development.
Similarly, GDP fails to account for the costs of environmental damage. All production is regarded as positive, even if the pollution it causes reduces the productive capacity of the agricultural sector and pushes up health care costs.
Again, this is important for China. A few years ago, the State Environmental Protection Administration did try to factor pollution costs into the country's GDP figures. But when it found that including environmental costs would have reduced growth by at least a third, the attempt was quickly discontinued. That shouldn't have been too surprising given that maintaining high headline GDP growth has become an obsession with China's leaders, who tout rapid growth as the justification for their authoritarian rule.
And as our travellers' comments show, their message resonates strongly with China's people, or at least those rich enough to take package tours round Europe.
But unfortunately the GDP measure by which both China's government and its travelling classes set such store is a deeply flawed measure of true economic progress.
As Simon Kuznets, the US economist who originally developed the idea of gross domestic product, warned: "Distinctions must be kept in mind between quantity and quality of growth, between its costs and return, and between the short and the long run. Goals for more growth should specify more growth of what, and for what."
It's a message China and its leaders would do well to heed.
That's not to say China should immediately embrace a European lifestyle - heaven forbid - but it does mean that the country's economic development could be advanced considerably if only its government and people were to abandon their unhealthy fixation on the rapid growth of GDP.
South China Morning Post (25 May 2011) by Tom Holland (reproduced here with permission of the author)
If you would prefer a pdf version of the original article, please follow the link below:

- Summarize the arguments for slowing down the rapid growth of GDP?
- To what extent do you agree with these arguments?
- Explain the counter arguments in favour of increasing the level of a country's GDP.
Using national income data
 It is recommended that you review section 4.2 which looks at the problems of measuring development. Living standards and welfare are considered to be key concepts in economic development. In the previous section we noted that using national income data to measure living standards, and to measure how these change over time, is fraught with potential hazards. Similarly, using national income data to compare the living standards in different countries can also be problematic. In particular, governments have problems:
- measuringliving standards of the population
- measuring how living standards change over time
- comparing international living standards
Can you remember the issues associated with using national income data such as GDP to measure living standards?
- The unofficial, shadow or informal economy - in which the output is not declared.
- Non-marketed goods and services - some transactions do not involve money changing hands.
- Government spending -some government expenditure goes to producing public goods, for example defense, which are not sold.
Can you remember the issues associated with using national income data such as GDP to measure how living standards change over time?
- Population numbers change
- income flows to and from abroad change
- Prices change
- It does not take account how income is distributed
When comparing GDP figures between countries, think about the following (Section 4.2 explores many of these issues in more detail):
- How the GDP is distributed
- The type of economy under consideration, e.g. developed or developing
- The costs of basic commodities in certain economies, e.g. housing in UK against an African country
- How taxes are charged and who actually pays them
- What level of social benefits are paid and to whom
- Life expectancy, protein intake and years in education
- Access to basic amenities, such as clean water
- The proportion of goods and services that are not traded, e.g. home-grown food, bartered services. The presence of these can distort national income figures significantly as they will not appear.
- The problem of comparing national incomes expressed in different currencies and the use of the exchange rate for this purpose.
- The composition of the output, e.g. in terms of armaments and welfare services.
- The extent to which additional output has generated negative externalities which may affect the quality of life.
Purchasing power of GDP
Allowances for differences in purchasing power when comparing welfare between countries
 We saw in the previous section, that GDP alone is not a completely adequate measure of the standard of living, though it is often used as a proxy for it. If we do use GDP as a measure of standard of living, then we also need to take account of differences between the purchasing power of GDP. If you have travelled, you will be aware that prices of goods in other countries often appear cheaper / more expensive. This may appear the case to us, but not to the people living there.
It may be that a lower GDP per capita nevertheless gives the same standard of living, because the same level of income can buy more in a particular country. When comparing GDP between countries, we need to try to adjust for the purchasing power of the GDP. Differences in purchasing power often relate to exchange rate differentials. Although purchasing power is one factor affecting exchange rates, there are many others as well if a country's exchange rate is out of line with what is called the purchasing power parity exchange rate.
When comparing GDP levels between countries, we should try to compare GDP per capita translated at purchasing power parity rates.

Task
- Visit the World Bank data site and find the most recent GDP per capita for the following countries:
- Australia
- US
- Japan
- Thailand
- Italy
- India
- Uganda
- Search the web to identify factors causing the differences between the GDP per capita figures you have found. Present evidence to support your findings.
Alternative measures of GDP
 We have seen already that GDP is a rather narrow measure of living standards. There are alternative measures of living standards, such as the Human Development Index of the United Nations Development Programme (UNDP). This index includes development indicators, such as life expectancy and access to education, as well as GDP. In addition, there are a number of single and composite indicators we can use as measures of development. These are explored in more detail in Section 4.2
The Green GDP
national income statistics provide a rather limited measure of living standards and wellbeing and do not take environmental concerns, such as the depletion of natural resources, into account. In response to this omission, the United Nations and the World Bank introduced the idea of Green GDP. In essence, 'Green GDP' highlights both the contribution of natural resources to economic development and the costs caused by pollution or resources degradation. By including both the use and depletion of natural resources in economic growth, this measure tells us more about the quality of the growth in terms of sustainable development.
Green GDP = GDP -Depletion of Natural Resources - Cost of Pollution
Index of Sustainable Economic Welfare (ISEW)
Another measure of development is the ISEW This provides a fuller picture of economic welfare because, like the MEW, this index adjusts the GDP figure to allow for actors ignored by GDP. These include:
- Environmental costs - pollution and other environmental costs will be negative figures and therefore reduce economic welfare.
- Defensive expenditures - increased air pollution has in many countries led to greater lung diseases, like asthma. This requires greater government spending, but cannot be said to be positive, so the ISEW adjusts for this.
- Inequality - the greater the level of inequality in an economy, the more the figure for consumption will be reduced. The ISEW adjusts for this inequality.
- Household production - family members who care for elderly relatives or dependents do not get paid for their 'work'. However, their contribution to society is significant. If they did not care, then the bill would be picked up by government or charity, and so their contribution is added back into the ISEW.
- Resource depletion - where resources are used up, this will reduce economic welfare and so, like environmental costs, the ISEW counts this as a negative, whereas GDP counts it as part of economic growth.
After these adjustments are made, we get the ISEW figure which will be a better representation of economic welfare than GDP alone.
While GDP provides a somewhat limited measure of economic growth and living standards, it does have the advantage of being fairly easily obtained and is based on three variables only - income, expenditure and output. In contrast to this, as can be seen from the HDI, MEW and ISEW, development is a multi-dimensional, complex process which can only be judged against a variety of criteria, using composite indices. This may give rise to various problems involving subjective, value judgements on behalf of the statisticians who construct the indices. For example, how should factors such as life expectancy and literacy be weighted within an index? Which factors should be included and which should be excluded? While the HDI, for example, may provide a fairly sophisticated indicator of living standards, it omits some very important components, such as environmental quality; but to construct a development index, which is all-embracing, would be a statistically awesome task!
Case Study

Grossly distorted picture

Read the article Grossly distorted picture. You can do this in the web window below, or follow the previous link to open the article in a new web window.
Having read this article organize a debate about the meaning of quality of life or standard of living. You will need to think through how to word the motion. It should be somewhat contentious to give those debating something to get their teeth into. For example it could be:
"This house believes that the chief aim of a thriving economy is to raise the material living standards of its citizens."
Short term fluctuations and long term trends
If you would prefer to view this interaction in a new web window, then please follow the link below:

Business cycle
The business cycle, also often known as the trade cycle, is the tendency of economies to move, over time, through periods of boom and slump. In other words, the business cycle represents the fluctuations in the rate of economic growth that take place in the economy.

What the data says (1)
- Visit the World Bank Data site and examine GDP data for your own country over the last 20 years. Using this data, identify the years when the economy was in periods of boom, recession, slump and recovery.
- Explain why governments might want to predict where a country is in its business cycle?.

What the data says (2)
- Import the GDP data for your own country and three others from different continents into a spreadsheet and plot the data. Using this date, comment on whether it is possible to determine a longer term trend in economic activity. If it is possible, construct a trend line to show whether the economy is growing or declining over the longer term.
- Discuss whether the long term trends for all four countries are broadly the same or, whether there differences.
The business cycle in history

The following article explores the business cycle in the UK over the last 300 years. As you read the article, reflect on whether the business cycle has changed over the centuries and consider factors that may underpin cyclical activity in the UK.
The business cycle is explored in more detail in sections 2.2 and 2.4. Specifically, we try to understand what causes the cycle, once it has started, to continue or to change direction.
2.1 The level of overall economic activity (questions)
In this section are a series of questions on the topic - the level of overall economic activity. The questions may include various types of questions. For example:
- Short-answer questions - a series of short-answer questions to help you check your understanding of the topic
- Case studies - questions based around a variety of information
- Long answer - questions requiring an extended/essay type response
- Data response - responding to data or topical economics news articles
Click on the right arrow at the top or bottom of the page to work through the questions.
Self-test questions

1 |
Trade cycleIn which phase of the trade cycle is inflation most likely to emerge? |
2 |
Trade cycleWhich of the following is not a phase of the trade cycle? |
3 |
Trade cycleIn which phase of the business cycle is unemployment most likely to rise? |
Short questions

Question 1
Distinguish between saving and investment.
Question 2
"Saving is a leakage from, and investment is an injection into, the circular flow of income." Identify:
(a) two further examples of a leakage
(b) two further examples of an injection
Question 3
Using a three sector open circular flow of income model:
(a) Explain what is meant by equilibrium
(b) Describe the conditions for the circular flow of income to be in equilibrium
Question 4
Explain what you would expect to happen to the size of the circular income flow if there was an increase in the amount of government spending into the flow.
Question 5
Explain why GDP may not always be the best measure of economic welfare.
Question 6
Analyse two possible factors that will lead to GDP understating the level of economic welfare.
Question 7
Analyse two possible factors that will lead to GDP overstating the level of economic welfare.
Question 8
Explain the main problems with using GDP as a measure of economic welfare.
Question 9
Evaluate two measures of economic welfare and compare these to GDP.
Data response (1)

Read the article Sarkozy seeks le feel-good factor (you can do this in the web window below or follow the previous link to open the article in a new web window) and then answer the questions below.

Question 1
Define Gross Domestic Product.
Question 2
Examine the view that GDP is a useful indicator of living standards.
Question 3
Identify, and evaluate, alternative measures to GDP as indicators of the quality of life of a country.
Question 4
Examine the problems associated with using indicators of living standards, such as GDP across national boundaries.
Data response (2)

Read the following article written by a Ugandan coffee farmer:
And then answer the questions below.

Question 1
Define the term 'buffer stocks.
Question 2
To what extent is Gross Domestic Product is an effective measure of the standard of living on Ugandans.
Question 3
Explain whether an annual growth rate of 5.1% in 2010 means that Ugandans livings standards have increased by an equivalent amount.
Question 4
Disuss the reasons behind the fluctuations in the Gross Domestic Product of Uganda.
Long Questions

Question 1
(a) Explain what is meant by the circular flow of income.
(b) Using diagrams to illustrate your answers, explain the conditions necessary for the circular flow of income of a country to be in equilibrium.
Question 2
(a) Describe the methods by which Gross Domestic Product can be measured.
(b) To what extent can Gross Domestic Product be used as a reliable indicator of living standards, both nationally and internationally?
Section 2.2 Aggregate demand and supply (notes)
In the previous section we considered the level of overall economic activity.
In this section, we examine the concepts of aggregate demand and aggregate supply.
By the end of this section you should be able to:

- Distinguish between the microeconomic concept of demand for a product and the macroeconomic concept of aggregate demand.
- Construct an aggregate demand curve.
- Explain why the AD curve has a negative slope.
- Describe consumption, investment, government spending and net exports as the components of aggregate demand.
- Explain how the AD curve can be shifted by changes in consumption due to factors including changes in consumer confidence, interest rates, wealth, personal income taxes (and hence disposable income) and level of household indebtedness.
- Explain how the AD curve can be shifted by changes in investment due to factors including interest rates, business confidence, technology, business taxes and the level of corporate indebtedness.
- Explain how the AD curve can be shifted by changes in government spending due to factors including political and economic priorities.
- Explain how the AD curve can be shifted by changes in net exports due to factors including the income of trading partners, exchange rates and changes in the level of protectionism.
- Describe the term aggregate supply.
- Explain, using a diagram, why the short-run aggregate supply curve (SRAS curve) is upward sloping.
- Explain, using a diagram, how the AS curve in the short run (SRAS) can shift due to factors including changes in resource prices, changes in business taxes and subsidies and supply shocks.
- Explain, using a diagram, that the monetarist/new classical model of the long-run aggregate supply curve (LRAS) is vertical at the level of potential output (full employment output) because aggregate supply in the long run is independent of the price level.
- Explain, using a diagram, that the Keynesian model of the aggregate supply curve has three sections because of "wage/price" downward inflexibility and different levels of spare capacity in the economy.
- Explain, using the two models above, how factors leading to changes in the quantity and/or quality of factors of production (including improvements in efficiency, new technology, reductions in unemployment, and institutional changes) can shift the aggregate supply curve over the long term.
- Explain, using a diagram, the determination of short-run equilibrium, using the SRAS curve.
- Examine, using diagrams, the impacts of changes in short-run equilibrium.
- Explain, using a diagram, the determination of long-run equilibrium, indicating that long-run equilibrium occurs at the full employment level of output.
- Explain why, in the monetarist/new classical approach, while there may be short-term fluctuations in output, the economy will always return to the full employment level of output in the long run.
- Examine, using diagrams, the impacts of changes in the long-run equilibrium.
- Explain, using the Keynesian AD/AS diagram, that the economy may be in equilibrium at any level of real output where AD intersects AS.
- Explain, using a diagram, that if the economy is in equilibrium at a level of real output below the full employment level of output, then there is a deflationary (recessionary) gap.
- Discuss why, in contrast to the monetarist/new classical model, the economy can remain stuck in a deflationary (recessionary) gap in the Keynesian model.
- Explain, using a diagram, that if AD increases in the vertical section of the AS curve, then there is an inflationary gap.
- Discuss why, in contrast to the monetarist/new classical model, increases in aggregate demand in the Keynesian AD/AS model need not be inflationary, unless the economy is operating close to, or at, the level of full employment.

- Explain, with reference to the concepts of leakages (withdrawals) and injections, the nature and importance of the Keynesian multiplier.
- Calculate the multiplier using formulae.
- Use the multiplier to calculate the effect on GDP of a change in an injection in investment, government spending or exports.
- Draw a Keynesian AD/AS diagram to show the impact of the multiplier.
Aggregate demand and supply - introduction
 In this section we consider the following topics in detail:
- Aggregate demand
- Aggregate supply
- Equilibrium
- The Keynesian multiplier
As economists we want to be able to model what is happening in an economy - particularly in the macroeconomy. This enables us to analyse what causes changes in the economy at the macro level and to develop appropriate policies to achieve our macro goals.
In managing a country's economy, governments are usually aiming to:
- Maintain high levels of employment or full employment
- Maintain price stability - low and consistent levels of inflation
- Maintain a satisfactory balance of payments
- Maintain high levels of economic growth
There will always be trade-offs between these macroeconomic goals, because it can be difficult to maintain all of them at once; governments will, as a result, face decisions on acceptable levels for each target.
In trying to understand the various macroeconomic problems a country might face, and the policies that its government may adopt in response, it is useful to look at one of the most common theoretical frameworks for analysing the macroeconomy; those of aggregate demand and supply. These are similar to the concepts of demand and supply that we considered in Section 1, but with the addition of the word 'aggregate'. Agregate means 'the sum of', so we are now looking at total demand and supply in the whole economy, instead of demand and supply of goods and services in individual markets.
The AD/AS model
The AD/AS model is central to macro-economic analysis, because it focuses on the determination of the equilibrium level of real output and the level of prices.
Using AD and AS curves, allows us in a relatively simple way, to illustrate complex inter-relationships and linkages, that are characteristic of market economies.

Why is the AS/AD model important for exam success?
It is relevant across a wide area of macro-economics and allows you to tackle a variety of macro-economic questions using a formalised mode of analysis, rather than relying purely on descriptive or ad hoc approaches. It is, therefore, an excellent tool for accumulating marks in HL and SL economics exams.
What are the differences between the AD/AS model and the D&S model?
Figure 1 Demand and supply and AD/AS compared
Aggregate demand curve
If you would prefer to view this interaction in a new web window, then please follow the link below:
Changes in aggregate demand
If you would prefer to view this interaction in a new web window, then please follow the link below:
N.B. A change in the price level will simply be represented by a movement along the AD curve.
Short-run aggregate supply (SRAS)
If you would prefer to view this interaction in a new web window, then please follow the link below:
Changes in SRAS
If you would prefer to view this interaction in a new web window, then please follow the link below:
Long run aggregate supply (LRAS) - classical
The neo-classical approach
If you would prefer to view this interaction in a new web window, then please follow the link below:
Changes in LRAS - classical
The neo-classical approach
If you would prefer to view this interaction in a new web window, then please follow the link below:
Long run aggregate supply (LRAS) - Keynesian
If you would prefer to view this interaction in a new web window, then please follow the link below:
Aggregate supply changes
Many economists argue that the LRAS curve is vertical, which means that any increase in AD will lead to an increase in prices. They feel that a time lag exists between the level of demand increasing and the supply sector of the economy being able to expand to meet this. They argue that only through increases in LRAS will such rises in AD be met without inflationary pressures.
Supply-side policies may enable the economy to expand in a non-inflationary way, as shown in Figure 1 below.
Figure 1 Impact of supply-side policies
Full employment level of national income
As we have seen in previous sections, national income can be calculated by measuring the total level of output of the economy. Generally speaking, the more the economy produces, the more people will be needed to produce the goods and services. However, there will be a maximum level of output where everyone available is employed and no more output can be produced. This level of output is called the full employment level of national income. At this level of income, everyone who wants a job will have a job and there is no shortage of demand in the economy.
We can see the level of full employment income in Figure 1 below - Yfe.
Figure 1 Full employment national income (Yfe) - Keynesian and Neo-classical
In practice, there may still be some unemployment at this level of income, but this would be caused by institutional factors like the level of social security payments or perhaps seasonal factors. However, at the full employment national income the economy is producing as much as it is able to in current circumstances.
Equilibrium national income
If you would prefer to view this interaction in a new web window, then please follow the link below:
The essentials of AD and AS
As is said in their titles, both aggregate demand and supply curves are aggregates - that is, they are the total of either all demand or supply within the economy. Aggregate demand slopes downwards as any other demand curve and shows that as the aggregate demand for real output increases, the average price level in the economy falls. This is the same relationship you studied when looking at individual demand. As with effective demand for individual products, a change in any of its components will SHIFT the AD curve to a new position. So, if a country becomes more successful in exporting its products to other countries, the AD line will shift to the right as in the diagram below (Figure 2). A similar situation will arise if the government stimulated the economy via expansionary fiscal or monetary policy.
Figure 2 Increased aggregate demand
The aggregate supply curve shows the total output of goods and services, which the firms or producers or suppliers will, or plan to supply, at a given price level. As we saw previously, a change in any of the determinants of AS, apart from the price level, will shift the AS curve to a new position.
If, or when, any of these change the curve can shift. In the diagram below (Figure 3), import prices have fallen and so too have the costs of production - the AS curve has therefore moved to the right (outwards).

Figure 3 Increased aggregate supply
Have a go at shifting the AD/AS curves for each of the changes below, draw original equilibrium AD and AS curves and show how the equilibrium has changed. Once you have answers to the outlined changes, follow the links to see if your answers agree with ours.
Illustrate the effect on equilibrium of the following:
- The central bank is concerned about future inflation and so increases interest rates.
- The exchange rate depreciates, leading to a fall in export prices and an increase in import prices.
- Consumers are concerned about high levels of debt and so reduce spending and increase saving to try to reduce their indebtedness.
Answer 1
Answer 2
Answer 3
Changes in short-run equilibrium - summary
If you would prefer to view this interaction in a new web window, then please follow the link below:
If you would prefer to view this interaction in a new web window, then please follow the link below:
If you would prefer to view this interaction in a new web window, then please follow the link below:
If you would prefer to view this interaction in a new web window, then please follow the link below:
Equilibrium in the long run?
If you would prefer to view this interaction in a new web window, then please follow the link below:
Non-inflationary growth
LRAS can be shifted through supply-side policies, and free market economists argue that, if these are used, the economy can grow in a non-inflationary way as in Figure 1 below. We will look at these policies in more detail in the next section.

Figure 1 Impact of supply-side policies
It is generally accepted that there is a relationship between output and employment and, that as output increases, so employment will rise. This seems easier to prove in the short term than it is in the long term. For example, if we make a major breakthrough in technology then output will certainly increase, but will it lead to a similar reaction in employment?
Equilibrium in the Keynesian model
If you would prefer to view this interaction in a new web window, then please follow the link below:
Inflationary and deflationary gaps
If you would prefer to view this interaction in a new web window, then please follow the link below:
If you would prefer to view this interaction in a new web window, then please follow the link below:
Any fluctuations in growth must be caused either by changes on the demand-side or changes on the supply-side of the economy. So what can cause these demand-side or supply-side changes?
1. Demand-side shocks
These might be caused by a variety of different events, but they all cause demand to change more suddenly than had been expected. A downturn is normally the more difficult to deal with, although excessive growth may result in inflationary pressures. Such shocks might have resulted from a previous bout of inflation, or a subsequent rise in unemployment or any event that reduces consumer confidence and causes demand to fall. An example is the impact of the swine flu in a country. A demand-side shock is illustrated by shifting AD left.
2. Supply-side shocks
Supply-side shocks can be just as devastating, though, as their name suggests, they are the result of something happening on the other side of the economic equation. It could be a war, drought, natural catastrophe or anything that causes the supply chain to be adversely affected. A supply-side shock is illustrated by shifting AS left.
Remember business and economic planners like stability and certainty, so any 'surprise' event can cause calculations and confidence to be blown off course.
Other possible causes of a cyclical pattern of growth could be:
- Policy-induced changes - politicians have often been known to put in place policies to boost the economy. It would be cynical to suggest that this often occurs around election time, but it does. This can lead to booms which lead to the incoming government having to deflate to slow the economy down again. There is much evidence to suggest the existence of an electoral cycle.
- Imported cycles - if the rest of the world is growing in cycles, then this will affect particular countries. Exports may fluctuate, which means that aggregate demand will change and therefore growth changes
- Expectations - expectations can have a powerful effect on growth. For example if firms expect there to be a slowdown, they may delay investment plans. If they do that, then aggregate demand will fall. If aggregate demand falls, so does growth.
Keynes vs. Hayek (video)

For a slightly different summary of the arguments between the Keynesian and Neo Classical economists why not watch and listen to the video clip. It presents a hip hop song imagining a debate between John Maynard Keynes and Friedrich Hayek. Try to follow the argument.
The Keynesian multiplier


Multiplier
The multiplier refers to the phenomenon, whereby a change in an injection of expenditure (either investment, government expenditure or exports), will lead to a proportionately larger change (or multiple change) in the level of national income i.e. the eventual change in national income will be some multiple of the initial change in spending.
 We need to be aware that changes in any of the components of AD (e.g. investment) may have a larger effect on GDP than just the value of the change. This is known as the multiplier effect. Let's look at what may happen if there was an injection of extra money into government-provided health care in an economy. Certainly, some of the money will go to doctors and nurses in the form of a salary increase or to employ new doctors and nurses, but new building and equipment will probably also be bought. This will boost sales of those making such items and so allow them to consume more. This 'first round effect' is the big boost to spending within the economy.
However, doctors eat, drink and consume just like the rest of us, and they will choose to spend some of their additional salary, known as their marginal propensity to consume (MPC) and save the rest, known as their marginal propensity to save (MPS). So, if a doctor was awarded an extra $100 in salary and chose to spend $80 of this, his or her MPC would be 0.8 and his or her MPS would be 0.2. MPC and MPS must add up to 1, since additional money can only be saved or spent.
The producers of the goods and services that the doctor now buy buy will take on more labour to cope with the extra demand and these new employees will also spend part of their additional income and so it goes on. The amount that is passed on will diminish in each successive round of spending but the overall injection into the economy will be greater than the first sum that was put into it. The size of the multiplier can be worked out by dividing the increase in national income that eventually occurs by the increase in injections that caused it.
![]()
So, for example, if an increase in government spending of $10m caused GDP to rise by $50m, this would be a multiplier of 5. This would be found by dividing $50m (the change in GDP) by $5m (the initial change in injection of expenditure).
The key determinants of the value of the multiplier are:
- The size of the savings ratio - the more people save of any increase in income (MPS), the less the increase in spending at each stage of the process.
- The amount spent on imports - if a lot of the extra spending created goes on imported goods and services, then this money will be lost out of the country and not passed on within the economy (the marginal propensity to import or MPM).
- The level of taxation - any increase in income will also mean higher tax revenue. However, if the government use this extra revenue to spend on public sector investment and employment, then this may help the process continue.
Overall, the value of the multiplier therefore depends on the amount of any increase in income that is spent by the people receiving it. The higher the MPC, the higher the value of the multiplier will be.

Marginal propensity to consume (MPC)
The marginal propensity to consume is the proportion of each extra dollar of income spent by households. For example, if a person earns $1 more and consumes 70c of it, then the MPC is 0.7.
The value of the multiplier can be calculated from the following formula:
![]()
Where MPC is marginal propensity to consume and MPS is marginal propensity to save.
But, how exactly is the multiplier determined?

Section 2.2 Aggregate demand and supply (simulations and activities)
In this section are a series of simulations and activities on the topic - aggregate demand and supply. These simulations and activities might include:
- Interactive diagrams - diagrams where you can drag curves or sliders to see the impact of the changes on the diagram
- PlotIT - a chance to build diagrams from data
- Step-by-step - diagrams built up step by step to help you see how to draw them and understand the principles behind the diagram
Click on the right arrow at the top or bottom of the page to move on to the next page.
Diagram toolkit
In the diagram toolkit you get given a panel showing possible curves and labels and you then drag these curves onto targets on the diagram to try to build an appropriate diagram.
There are a number of sections. Follow the links below to access the different sections or use the table of contents on the left.
- National income equilibrium (1)
- National income equilibrium (2)
- National income equilibrium (3)
- National income equilibrium (4)
Why not try the one below as some practice? Drag curves and labels onto the targets on the diagram to build a demand and supply diagram showing a market in equilibrium. Once you think the diagram is right, click 'Check answer'. To see the correct answer, click the 'Feedback' button.
Click on the right arrow to start trying out the diagram toolkit.
National income equilibrium (1)
On the diagrams below, drag curves and labels from the panel on the right to build the appropriate diagram. Once you think the diagram is right, click 'Check answer'. To see the correct answer, click the 'Feedback' button.
Number 1
Number 2
Number 3
Number 4
Click on the right arrow try some further examples.
National income equilibrium (2)
On the diagrams below, drag curves and labels from the panel on the right to build the appropriate diagram. Once you think the diagram is right, click 'Check answer'. To see the correct answer, click the 'Feedback' button.
Number 1
Number 2
Number 3
Number 4
Click on the right arrow try some further examples.
National income equilibrium (3)
On the diagrams below, drag curves and labels from the panel on the right to build the appropriate diagram. Once you think the diagram is right, click 'Check answer'. To see the correct answer, click the 'Feedback' button.
Number 1
Number 2
Number 3
Number 4
Click on the right arrow try some further examples.
National income equilibrium (4)
On the diagrams below, drag curves and labels from the panel on the right to build the appropriate diagram. Once you think the diagram is right, click 'Check answer'. To see the correct answer, click the 'Feedback' button.
Number 1
Number 2
Number 3
Number 4
DragIT - Aggregate demand and supply
The above diagram shows an aggregate demand curve and an aggregate supply curve, with equilibrium real national income (Ye) and the price level (Pe) where the two curves intersect.
First, drag the two lines in turn to show the influence of (a) increased aggregate demand and (b) increased costs on the price level and national income.
Second, click the 'Rotate AS line' button so that the AS curve becomes more elastic and then again drag the two lines in turn and note the effects on Ye and Pe.
Referring to the above diagram, are the following statements true or false? In each case assume that nothing else changes. (Try dragging the lines to check on your answer.)
1 |
Shifts in aggregate supply and demandAn increase in aggregate demand will cause higher inflation. |
2 |
Shifts in aggregate supply and demandAn increase in costs will make the aggregate supply curve more inelastic. |
3 |
Shifts in aggregate supply and demandThe less responsive is AS to a rise in AD, the more prices will rise for a given increase in AD. |
4 |
Shifts in aggregate supply and demandAn increase in expenditure tax will shift both the aggregate demand and supply curves to the left. |
5 |
Shifts in aggregate supply and demandAn improvement in productivity will shift both the aggregate demand and supply curves to the right. |
2.2 Aggregate Demand and Aggregate Supply (questions)
In this section are a series of questions on the topic - aggregate demand and supply. The questions may include various types of questions. For example:
- Short-answer questions - a series of short-answer questions to help you check your understanding of the topic
- Case studies - questions based around a variety of information
- Long answer - questions requiring an extended/essay type response
- Data response - responding to data or topical economics news articles
Click on the right arrow at the top or bottom of the page to work through the questions.
AD/AS - self-test questions

1 |
Shifts in aggregate demandWhich of the following would NOT cause a shift in AD? |
2 |
3 |
Shifts in aggregate supplyWhich of the following would NOT cause a SHIFT in AS? |
4 |
Shifts in aggregate supplyIf the price of imports rose, caused by a change in the value of the pound then the AS would shift to the: |
5 |
Shifts in aggregate supply
Which of the following might have caused the shift in aggregate supply shown in the diagram below? Tick all the answers that apply.
|

6 |
Determinants of exportsA key determinant of exports is: |
7 |
Shifts in aggregate supply and demand
Which of the following would cause the shift shown in the diagram below? Tick all the answers that apply.
|

8 |
AD/AS analysisWhen using AD/AS analysis to illustrate changes within an economy, which of the following would NOT need to be considered when looking at changes to economic growth? |
9 |
Aggregate supplyWhich of the following is a major influence on AS? |
10 |
11 |
Shifts in aggregate supply and demandAn increase in aggregate demand (given no change in aggregate supply) will cause higher inflation. |
12 |
Shifts in aggregate supply and demandAn increase in costs will make the aggregate supply curve more inelastic. |
13 |
Shifts in aggregate supply and demandThe less responsive is AS to a rise in AD, the more prices will rise for a given increase in AD. |
14 |
Shifts in aggregate supply and demandAn increase in expenditure tax will shift both the aggregate demand and supply curves to the left. |
15 |
Shifts in aggregate supply and demandAn improvement in productivity will shift both the aggregate demand and supply curves to the right. |
16 |
Increase in ADWhich of the following is likely to result from a rapid rise in aggregate demand? |
Short questions

Question 1
Explain the main aims of government macro-economic policy.
Question 2
Assess the view that the control of inflation should be the main priority of any government.
Question 3
Explain why the AD curve slope downwards.
Question 4
Describe the main determinants of consumer spending.
Question 5
Identify the factors that might cause a shift in AD.
Question 6
Identify the factors that influence long run AS.
Question 7
Define the term 'aggregate supply'.
Question 8
Use an AD/AS diagram to explain the likely effects of a general increase in raw material and wage costs in the economy.
Question 9
Which component(s) of AD is/are likely to be affected in each case (C, I, G, X - M)?
(a) An increase in the money supply
(b) An increase in income tax
(c) An increase in house prices
(d) A decrease in the rate of interest
(e) A decrease in the population
(f) Greater pessimism about the future among consumers
(g) Improved business expectations
(h) A government decision to reduce capital spending on roads
(i) A fall in incomes abroad
(j) A fall in the UK exchange rate
(k) Greater spending on imports
Question 10
Identify whether the short run aggregate supply curve (SRAS) will shift to the left, or to the right, given the following circumstances:
(a) A decrease in wage rates
(b) An increase in raw material prices
(c) A decrease in import costs
(d) An increase in indirect taxation/taxation of company profits
Question 11
Identify whether the short run aggregate supply curve (LRAS) will shift to the left, or to the right, given the following circumstances:
(a) An increase in the skills of the workforce
(b) A decrease in the labour force
(c) A decrease in net investment
(d) Improvements in health care
(e) Advances in technology
Data response (1)

Read the article:
and then answer the questions below.

Question 1
Explain what is meant by the multiplier principle
Question 2
Explain the reasons why there has been a shift in the thinking of many leading economists about the merits of fiscal policy.
Question 3
Using aggregate supply and demand diagrams, examine the factors that determine the size of the multiplier effect following an increase in government spending.
Question 4
Assess whether an increase in government spending and taxation by equivalent amounts will leave national income unchanged?
Data response (2)

Read the article China's capital spending could soon be bigger than America's (you can do this in the web window below or follow the previous link to open the article in a new web window) and then answer the questions below.

Question 1
Define the terms:
- consumption
- investment
- government spending
Question 2
Analyse the effect of the Chinese government increasing the amount of public sector investment on the level of aggregate demand, output, employment and income in the short run.
Question 3
Examine the effect of the increase in Chinese public sector investment on long run aggregate supply.
Question 4
Explain how the multiplier and accelerator principles are connected and influence the level of economic activity.
Long questions

Question 1
(a) Explain why the value of the multiplier may vary over time and from country to country.
(b) Explain how the multiplier and the accelerator principles help understand the dynamics of the business or trade cycle.
Question 2
(a) Using aggregate demand and supply diagrams to aid your analysis, explain the difference between an inflationary and deflationary gap.
(b) Evaluate the policy options open to a government that wants to close a deflationary gap and reduce unemployment.
2.3 Macroeconomic objectives (notes)
In the previous section we considered the level of overall economic activity and examined the concepts of aggregate demand and aggregate supply.
In the following section we concentrate on the role of macroeconomic objectives in the development of government policies.
Macroeconomic objectives - introduction
 In this section, we consider the following sub-topics in detail:
- Low unemployment
- Low and stable rate of inflation
- Economic growth
- Equity in the distribution of income
Government macroeconomic policy aims to achieve a number of macroeconomic objectives.The major objectives usually targeted by all governments include maintaining or creating:
- low levels of unemployment or perhaps full employment
- price stability - low and stable rates of inflation
- a satisfactory balance of payments
- high levels of economic growth
- a satisfactory distribution of income

For an excellent review of the operation of the macroeconomic goals of government, watch the video on YouTube by Paj Holden.
Low Unemployment
By the end of this section you should be able to:

- Define the term unemployment.
- Explain how the unemployment rate is calculated.
- Explain the difficulties in measuring unemployment, including the existence of hidden unemployment, the existence of underemployment, and the fact that it is an average and therefore ignores regional, ethnic, age and gender disparities.
- Discuss possible economic consequences of unemployment, including a loss of GDP, loss of tax revenue, increased cost of unemployment benefits, loss of income for individuals, and greater disparities in the distribution of income.
- Discuss possible personal and social consequences of unemployment, including increased crime rates, increased stress levels, increased indebtedness, homelessness and family breakdown.
- Describe, using examples, the meaning of frictional, structural, seasonal and cyclical (demand-deficient) unemployment.
- Distinguish between the causes of frictional, structural, seasonal and cyclical (demand-deficient) unemployment.
- Explain, using a diagram, that cyclical unemployment is caused by a fall in aggregate demand.
- Explain, using a diagram, that structural unemployment is caused by changes in the demand for particular labour skills, changes in the geographical location of industries, and labour market rigidities.
- Evaluate government policies to deal with the different types of unemployment.

- Calculate the unemployment rate from a set of data.
Low Unemployment
 There will always be trade-offs between different macroeconomic objectives as it can be difficult to satisfy all of them at once and so governments will face decisions on acceptable levels for each target. The trade-off is particularly apparent, between reducing unemployment and achieving stable price levels.
Governments perceive high unemployment as a waste of resources; the economy is operating within its production possibility boundary and as a result could potentially produce a more goods and services. However, the government is aware that stimulating an economy to lower unemployment can cause inflation, which is undesirable because it makes a country less competitive and is destabilising. In addition, consumers do not like prices going up all the time and firms face less r and this may make the government unpopular.
We often tend to look at unemployment and inflation together because if one target is hit, the other may be missed. If economic growth is healthy, this may help keep unemployment low, but it may also add to inflationary pressures. If the government 'cools' the economy to reduce inflation using fiscal and/or monetary policy, increased unemployment may be the result.
What the data says

Task
Investigate the levels of unemployment in your country over the last 20 years, by accessing the World Bank Catalogue through this link and then follow the steps below:
- Choose the World Development Data set
- Click on Indicators
- Type unemployment into the search engine.
- Save the unemployment data in a spreadsheet
- Plot the data over the 20 years using a graph

- Describe the data you have plotted focusing on short term patterns, long term trends, and relationships between variables.
Repeat the exercise for two other countries from different continents.
- Identify similarities and differences between the three sets of unemployment data.
- Analyse the factors that might account for the similarities and differences you have identified. (You may want to revisit this answer once you have completed this section).
The meaning of unemployment
What is unemployment?
Since the late 1970s, full employment has not meant that everyone is employed. It now means the number of people wishing to work at the agreed wage rate is equal to the number of employees firms are willingto hire at that rate. If there are still people who want to work at the existing wage rate, and are willing and available to work, this is described as unemployment.

Unemployment
Unemployment is where individuals are able and willing to work, but do not have a job.
Employment rate
The employment rate is the percentage of the labour force in work.
Unemployment rate
The unemployment rate is the percentage of the labour force who are out of work.
Underemployment
Underemployment refers to those people, who can only find part-time employment, although they want full-time employment..
The official definition of unemployment may differ from country to country. National definitions vary as regards age limits, reference periods, the criteria for seeking work, treatment of persons temporarily laid off and of persons seeking work for the first time. The International Labour Organisation (ILO) definition is commonly employed.
In addition, countries will often distinguish between those who are classified as unemployed, and those who claim some form of unemployment-related benefits because they have no job; the latter being referred to as the claimant count. An explanation of this difference with reference to the UK can be found on the UK government website.
Hidden Unemployment
Hidden unemployment is the unemployment, or underemployment of workers, that is not reflected in official unemployment statistics, because of the way they are compiled. Only those who have no work, but are actively looking for work, are counted as unemployed. Those who have given up looking, those who are working less than they would like, and those who work at jobs in which their skills are underutilized are not officially counted among the unemployed, though in a sense they are. These groups constitute hidden unemployment.
Source: answers.com
Getting a full picture of the rate of unemployment is difficult. In addition to the problems of underemployment and other examples of hidden unemployment, a single national unemployment rate does not take into account any regional, ethnic, age and gender disparities. All of these may be of importance to the government when considering policy measures.
Case study - regional variation

Regional variation in unemployment in the UK
Have a look at the Economy tracker in the BBC website. You can see how unemployment in the various UK regions has changed significantly over the last 6 years. (You can do this in the web window below or follow the previous link to open the site in a new web window)
Government policy will usually aim to get rid of this unemployment as it represents a waste of resources. Those people could be producing and boosting the national income of the economy. Not only that, but they are likely to be claiming unemployment benefits or social security payments and so the government budget is taking a double hit - no tax return and social security payments being made. This is not good news for governments under pressure to deliver better and better public services.
Consequences of unemployment
 The main cost of unemployment is a personal one to those who are unemployed. However, if they suffer as individuals, then it is likely that the whole economy suffers as a consequence. Individuals may become dispirited by unemployment and lose their self-esteem and confidence. This may affect their motivation to work. The longer individuals are unemployed, the more they may lose their skills and which is bad for the economy as well. On top of that, the problems associated with unemployment may result in the unemployed being less healthy, which leads to health-related costs. Areas of high unemployment and social deprivation may also experience higher crime levels. Certainly, both the national economy, and society in general, suffers from high rates of unemployment.
As well as these microeconomic effects, there will also be macro effects. These will include:
- Loss of output to the economy - the unemployed could be producing goods and services and if they are not, then GDP is lower than it could be.
- Loss of tax revenue - unemployed people are not earning and not paying tax. The government has reduced revenues to spend on public services.
- Increase in government expenditure - the government has to pay out benefits to support the unemployed.
- Loss of profits - with higher employment firms are likely to do better and make higher profits. If they make less profit because of unemployment, they may have less funds to invest.
The true impact of unemployment will depend on two factors. These are:
- Its rate
- Its duration
Normally, the longer an individual is unemployed, the more difficult it is to find work. Similarly, a large number of unemployed people cause more problems than a small number.
Unemployment has individual consequences. Some of those who are unemployed may seek a career change, whilst others may enjoy their additional leisure time! However, for the majority, there will be a fall in disposable income, since unemployment-related benefits seldom pay as much as salaried employment. Living standards will fall and some of the unemployed might be forced to extend credit and loan-financed purchases. The longer they remain unemployed, the less training and development they are receiving and the more unemployable they become.
For businesses, unemployment means lower demand for some products and employee morale may suffer. Productivity could fall, as workers fear that they are next for the unemployment pile. However, a larger pool of unemployed will exist, so some employers might find hiring new labour easier (and perhaps cheaper).
The economy might also suffer as output falls (and therefore tax revenue falls) and government expenditure on benefits increases. Opportunity cost decisions will have to be made. The distribution of income will become more uneven, but unemployment might cause downward pressure on wage levels, as workers fear pricing themselves out of a job.
When unemployment exists, it means lost output, as the economy will be working below full potential and tax revenues will be lower. As unemployment rates increase more state benefits have to be paid, which involves a further economic opportunity cost. We have also noted the potential for social difficulties.
Case study - tougher for men

Unemployment is tougher for men

Read the article Unemployment is tougher for men and then answer the questions below. (You can read the article in the web window below, or follow the previous link to open it in a new web window)

- Identify the psychological effects of being unemployed.
- Explain the differences between these effects on men and women.
- Analyse the economic effects of having a high rate of unemployment.
Types and causes of unemployment
If you would prefer to view this interaction in a new web window, then please follow the link below:
Disequilibrium unemployment
If you would prefer to view this interaction in a new web window, then please follow the link below:
Equilibrium unemployment
If you would prefer to view this interaction in a new web window, then please follow the link below:
Policies to reduce unemployment
If unemployment is cyclical or demand-deficient, then the best policy to get rid of it will be to boost the level of aggregate demand. Sounds easy, but how can the government achieve this? actually do it? It is likely to use expansionary monetary policy and/or fiscal policy. This could mean:
- Cutting interest rates - this should encourage consumption and investment and, therefore, boost aggregate demand.
- Increasing government expenditure - government spending is a crucial component of aggregate demand and so increasing spending, perhaps on education, health or roads, will help boost aggregate demand and reduce unemployment.
- Cutting taxes - government could cut direct and/or indirect taxes; both of these actions should encourage consumption . Higher consumption should mean more employees are required to make the additional goods and services demanded. A reduction intaxes on profits might also encourage investment.
These expansionary fiscal or monetary policies should increase aggregate demand and shift the aggregate demand curve to the right as in figure 1 below.

Figure 1 Expansionary fiscal/monetary policy
This solution appears to be quite simple, but in macroeconomics things are rarely as simple as they first appear! As we already know, policy conflicts can arise, especially the possible adverse effects on inflation of higher aggregate demand. So, a mixture of monetary policy, fiscal policy and supply-side policies would normally be used. Governments hope that supply-side policies will boost the capacity of the economy and enable higher aggregate demand, but without the associated inflationary pressures.
In the long run, if there is no shortage of aggregate demand, the cause of the unemployment is likely to lie with supply-side problems, such as geographic and occupational immobility of labour, lack of appropriate skills and training or a lack of information. This type of unemployment can be tackled by application of appropriate supply-side policies, as previously identified in Section 2.6.
Low and stable inflation
By the end of this section you should be able to:

- Distinguish between inflation, disinflation and deflation.
- Explain that inflation and deflation are typically measured by calculating a consumer price index (CPI), which measures the change in prices of a basket of goods and services consumed by the average household.
- Explain that different income earners may experience a different rate of inflation when their pattern of consumption is not accurately reflected by the CPI.
- Explain that inflation figures may not accurately reflect changes in consumption patterns and the quality of the products purchased.
- Explain that economists measure a core/underlying rate of inflation to eliminate the effect of sudden swings in the prices of food and oil, for example.
- Explain that a producer price index measuring changes in the prices of factors of production may be useful in predicting future inflation.
- Discuss the possible consequences of a high inflation rate, including greater uncertainty, redistributive effects, less saving, and the damage to export competitiveness.
- Discuss the possible consequences of deflation, including high levels of cyclical unemployment and bankruptcies.
- Types and causes of inflation
- Explain, using a diagram, that demand-pull inflation is caused by changes in the determinants of AD, resulting in an increase in AD.
- Explain, using a diagram, that cost-push inflation is caused by an increase in the costs of factors of production, resulting in a decrease in SRAS.
- Evaluate government policies to deal with the different types of inflation.

- Construct a weighted price index, using a set of data provided.
- Calculate the inflation rate from a set of data.
- Discuss, using a short-run Phillips curve diagram, the view that there is a possible trade-off between the unemployment rate and the inflation rate in the short run.
- Explain, using a diagram, that the short-run Phillips curve may shift outwards, resulting in stagflation (caused by a decrease in SRAS due to factors including supply shocks).
- Discuss, using a diagram, the view that there is a long-run Phillips curve that is vertical at the natural rate of unemployment and therefore there is no trade-off between the unemployment rate and the inflation rate in the long run.
- Explain that the natural rate of unemployment is the rate of unemployment that exists when the economy is producing at the full employment level of output.
Low and stable inflation (notes)
 Stabilising the level of prices (or reducing inflation) is another macroeconomic objective that most governments set as a priority. In some cases, a deflationary situation exists and there is downward pressure on prices and output.
In this section, the following topics will be covered:
- The meaning and measurement of inflation and deflation
- Consequences of inflation and deflation
- Types and causes of inflation
- Possible relationships between unemployment and inflation
The meaning and measurement of inflation

Inflation
Inflation is a persistent increase in the general level of prices.

What the data says
Identify the main inflation measure in your country by accessing the World Bank Catalogue though this link.
- Choose the World Development Data set
- Click on Indicators
- Type the term 'inflation' into the search engine.
- Save the inflation data in a spreadsheet
- plot the data over a 20 year period using a graph

- Describe the data you have plotted focusing on short term patterns, long term trends, and relationships between variables.
Repeat the exercise for two other countries from different continents.
- Identify similarities and differences between the three sets of unemployment data.
- Analyse the factors that might account for the similarities and differences you have identified. (You may want to revisit this answer once you have completed this section).
A consumer price index
 In most countries inflation is measured by using a weighted price index. This may be called something like the 'Consumer Prices Index'.
However, what do we mean by a weighted index and why does it need weighting? Well, prices of all goods change, but some goods are more important than others. If the price of a major food item goes up by 10% and the price of shoelaces goes up by 100%, we don't want them to have the same impact on inflation. This is because we spend a large proportion of our income on food and usually hardly any on shoelaces. We therefore weight each price change to reflect its importance in our spending. Prices of goods which we spend a lot on get higher weights. Those that are relatively less important get lower weights.
There are THREE main stages to calculating a weighted index. These are:
- The use of a survey to decide on the weights to be used. The survey will usually try to measure the way in which families spend their income so that the weights can reflect average spending patterns on a typical basket of consumer goods.
- The recording of price changes. This is often done monthly to get a figure for inflation and a number of prices may be collected for the same good. This is to reflect regional differences or differences resulting from selling it in different locations.
- Each price is then multiplied by its weight. This ensures that the inflation measure is appropriate for the way in which the people in the economy spend their money.
Finding out more about consumer price index weights

Search the web or the site of the statistics office for the country where you are and see if you can find the weights for the main inflation measure.
The OECD website is a good place to start for many countries. (You can look at this site in the web window below or follow the previous link to open it in a new web window)

- Identify the most important item where you are.
- Note down the figures for the weights and record them on your inflation spreadsheet.
Problems with measuring inflation
 There are several problems when trying to measure inflation. These include:
- Changes in the quality of the goods and services included in the index. As technology feeds into the construction of many goods, so their inherent quality increases, but this is not always reflected in price levels.
- Special offers, which are now a feature of 'high street shopping' do not feature in the index and so people may be buying some products for a significantly lower price than the index is showing.
- We also change our expenditure patterns. Although the weighting patterns are reviewed annually modern marketing can result is quick changes in consumer tastes.
- The index is based on a sample and these can always be less accurate than was hoped. This introduces sampling errors into the figures.
- Weighting is based on 'average' spending patterns. Thus the more a person deviates from the average, the less meaningful will be the official inflation rate for them. For example, food and heating and lighting costs may account for a much larger proportion of the income of low income groups than high income groups, so any price inflation of these items will disproportionately affect the poor. For example, a published rate of inflation of 3% may mean an effective rate of inflation of 10% for the less well off.
Inflation - videos

Watch the following video clips and reflect upon the questions following each video:
Video 1 (BBC) - the effects of inflation:

- Identify the winners and losers from inflation.
- Explain why consumer price indices are weighted.
Video 2 - changing CPI weightings in China
Video 2 shows a news clip about attempts by the Chinese government to change the consumer price index weighting

- Explain what the government of China has done to the weighting of the consumer price index.
- Identify the effect of this change on the reported level of inflation.
- Analyse the reasons why the Chinese government has made this change.
Video 3 - problems of a CPI in the US
Video 3 is a presentation considering the problems of constructing a consumer price index in USA

- Summarise the main problems associated with calculating a consumer price index.
Consequences of inflation
 The effects of a period of inflation depend on:
- The rate at which prices are rising
- Whether the rate is accelerating or not
- Whether the rate is that which was expected
- How the rate compares with other countries, in particular the main trading partners.
Anticipated inflation
The seriousness of the costs of inflation depends mainly on whether it is anticipated (expected) or not. If people anticipate the inflation rate, then the effects will be less as they will build these expectations into their behaviour. The costs of anticipated inflation may include:
- Costs to firms - called menu costs as firms will need to keep changing their prices on retail shelves, in catalogues and on price lists.
- Costs to individuals - called shoe-leather costs - individuals will be less likely to hold as much cash, as it loses its value quicker when there is inflation. This means going to the bank more often to get cash out - hence the term shoe-leather costs. It would, perhaps, be truer these days to call them car tyre costs, or perhaps even telephone/internet costs given the arrival of telephone and internet banking, but the expression 'shoe-leather costs' has stuck in economic theory.
- Distortions to the tax system - both direct and indirect taxes are affected by inflation. Many indirect taxes are for a fixed amount. This is often true of taxes on cigarettes, petrol and alcohol. If the amount is fixed, then inflation will gradually erode the amount the government receives in real terms. The price of the good will be going up, but the tax will not. Income tax is also affected, and in this case it individuals and firms that suffer rather than the government. As incomes increase, so individuals and firms may pay more tax. If tax thresholds are not increased in line with inflation, then fiscal drag arises. This is when people are dragged into higher tax bands, or dragged over the threshold for starting to pay tax.
Unanticipated inflation
The costs are more serious if the inflation is unanticipated. The main costs of unanticipated inflation are:
- Uncertainty - inflation makes life very difficult for firms, which want to plan ahead as much as possible. This uncertainty may particularly affect their investment plans. Many investment projects take a long time before they generate returns. If the level of inflation is unpredictable, then firms will find it more difficult to work out if the investment will be profitable. In that case, they may simply not bother to take the risk. So higher inflation may adversely affect investment, and this will slow down economic growth in the long run.
- Wage distortions - some groups will have more power to increase their wages to reflect changing inflation than others and unanticipated inflation is likely to lead to the less well-off in society being hit harder than the better-off, not least because a wage increase of, say, 5% of £10,000 is a lot less than 5% of £100,000.
- Resource costs- if you see that the price of something that you buy has gone up, then that causes a dilemma. Is it just that thing that is more expensive? Or is it all the other brands as well? In other words, has there been a relative price increase (one thing relative to others), or a general price increase (everything increasing in price). If it is a general price increase then you would probably just buy it anyway and then moan about inflation. However, if it is a relative price increase you may want to switch brands. Inflation may therefore distort the price signals in the economy. These price signals are fundamental to the efficient workings of markets and inflation can adversely affect them. Unanticipated inflation can therefore cause allocative inefficiency.
- Redistribution - inflation creates an arbitrary redistribution of income, and is unfair. People who have borrowed money will be better off as they have less to pay back in real terms. Savers, on the other hand, will be worse off as inflation is eroding the value of their savings. People on fixed incomes or with fixed savings, like pensioners, may be the worst off. It can be really demoralising to have saved all your life for retirement, only to find that the money saved is worth less and less every year because of inflation.
- Balance of payments / competitiveness - markets are becoming increasingly globalised and firms have to compete with other firms all over the world. If a country's inflation rate is faster than other countries, then it makes it much more difficult to compete. This will tend to make exports suffer, but at the same time imports become relatively cheaper. Overall, the balance of payments is likely to worsen. The uncertainty that normally accompanies inflation may discourage capital and financial investment from coming into the country as well.
The higher the level of inflation, the more difficult it is to predict. This will almost certainly lead to higher costs.
Hyperinflation
In some cases inflation can rise to such a level that it becomes known as hyperinflation.

Watch the video clip about the hyperinflation in Zimbabwe and the attempts by the government to reduce it. Once you have watched the video, answer the questions below.

- Find a definition for hyperinflation and record this definition in your notes.
- Distinguish 'hyperinflation' from 'normal' inflation.
- Analyse the effects of hyperinflation on the Zimbabwean economy.
- Explain how the Zimbabwean government attempted to reduce the level of inflation.
- To what extent to you think they have been successful? If not, why not?
The consequences of deflation

Deflation
Deflation is a persistent decrease in the price level or a situation in which output and employment are falling as a result of a fall in AD.
The term deflation is often used in a broad sense to describe a process in which there is a fall in aggregate demand leading to lower levels of output, employment, investment and possibly profits and prices.
Costs of deflation
- The problem of deflationary expectations - deflation may cause people to postpone their spending in the expectation of even lower prices in the future. When this happens, aggregate demand falls, businesses are unable to sell their goods, make profits or meet their debt repayment obligations and, as a consequence, may be forced to cut output and employment of workers. A downward spiral becomes established in which aggregate demand falls even further leading to even lower prices. As Japan has discovered in the mid-1990s, once a downward deflationary spiral sets in, it may be exceedingly difficult to reverse.
- Deflation increases the value of real debt - with some inflation in the system, borrowers experience a fall in the real value of their debt over time. However, with falling prices borrowers will experience an increase in the real value of their debt and in such a climate, companies and individuals with debt may struggle. This in itself may exert a further twist to the downward deflationary spiral.
Types and causes of inflation: demand-pull inflation
Demand-pull inflation

Demand-pull inflation
A term used in Keynesian economics to describe the scenario that occurs when price levels rise because of an increase in aggregate demand, caused by factors such as greater government expenditure and increases in the money supply. When aggregate demand in an economy strongly outweighs aggregate supply, prices will increase. Economists will often say that demand-pull inflation is a result of 'too much money chasing too few goods'.
Demand-pull inflation happens when the level of aggregate demand grows faster than the underlying level of aggregate supply. This may be easier to imagine, if you think of supply as the level of capacity. If the capacity to produce in an economy is growing at 3%, and the level of demand grows at the same rate, or slower, then the country does not have a problem, as it can produce all it needs. However, if capacity grows at 3%, but demand grows faster, then there is a problem. In effect, the country has too much demand relative to supply, and it cannot produce all that is demanded. The economic effect is that prices are forced up, causing inflation. We can see this in Figures 1 (Keynesian) and 2 (Classical) below. As the aggregate demand curve shifts to the right, the price level rises - inflation.
Figure 1 Demand-pull inflation - Keynesian diagram
Figure 2 Demand-pull inflation - Classical
There are a variety of possible reasons for the increase in aggregate demand, and to look at these in more detail we will look at the components of aggregate demand. Aggregate demand is made up of all spending in the economy. It is represented by the following formula:
AD = C + I + G + (X-M)
where C is consumer expenditure, I is investment, G is government expenditure, X is exports and M is imports
An increase in aggregate demand could, therefore, be because consumers are spending more, possibly because interest rates have fallen or taxes have been cut or, simply, because there is a greater level of consumer confidence. It could also be that firms are investing more in the expectation of future economic growth, or the government is boosting spending on defence, health, education. An external factor may begreater demand for exports from overseas buyers - in other words exports are rising Whatever is the cause, it will be inflationary if demand grows faster than supply.
Types and causes of inflation: cost-push inflation

Cost-push inflation
A sustained increase in the prices of goods and services brought about by rising input costs and a decrease in aggregate supply. There are a number of factors that can contribute to cost-push inflation, including increases in:
- wage rates
- prices of raw materials (possibly as the result of currency depreciation)
- corporate taxes
For inflation to be cost-push in nature, increases in input prices must affect a large proportion of producers, forcing up the general price level as demand stays constant in the short-run.
Cost-push inflation
Cost-push inflation happens when costs increase independently of aggregate demand. It is important to look at why costs have increased, as quite often costs are increasing simply due to the economy booming. When costs increase for this reason it is generally just a symptom of demand-pull inflation and not cost-push inflation. For example, if wages are increasing because of a rapid expansion in demand, then they are simply reacting to market pressures. This is demand-pull inflation causing cost increases. However, if wages rise because of greater trade union power pushing through larger wage claims - this is cost-push inflation. Cost-push inflation is shown on the diagram below. The aggregate supply curve shifts left, because of the cost increase, pushing prices up.
Figure 5 Cost-push inflation
So why might costs get pushed up, causing inflation? There are a number of possible sources of rising costs.
Wages
If trade unions gain more power, they may be able to push wages up independently of consumer demand. Firms then face higher costs and are forced to increase their prices to pay the higher claims and maintain their profitability.
Profits
If firms gain more power and are able to push up prices independently of demand to make more profit, then this is considered to be cost-push inflation. This is most likely when markets become more concentrated and move towards a monopoly or perhaps an oligopoly position.
Imported inflation
Economies operate within a global contxt and many firms import a significant proportion of their raw materials. If the cost of these increase for reasons beyond their control, then firms may increase prices to pay these higher raw material costs, although this will depend upon elasticities of demand. Highr raw material costs may happen for several reasons:
- Exchange rate changes - if there is a depreciation in the exchange rate, a country's exports will become cheaper abroad, but its imports will become more expensive; firms will be paying more for their overseas raw materials.
- Commodity price changes - if there are price increases on world commodity markets, firms will be faced with higher costs if they use these commodities as raw materials; particulalry important markets will include the oil market and metals markets.
- External shocks - this could as the result of natural reasons or because a particular group or country has gained more economic power. An example of the first cause was the 2011 earthquake and tsunami in Japan, which disrupted production of Japanese goods and services for a prolonged period. An example of the second cause was when OPEC forced up the price of oil four-fold in the early 1970s.
Exhaustion of natural resources
As resources run out, their price will inevitably rise. This will increase firms' costs and may push up prices until they find an alternative source of raw materials (if they can). This has happened with fish stocks. Over-fishing has put many types of fish and fish-based products under extreme pressure, forcing their price up. In many countries, equivalent problems have been caused by erosion of land as forests are cleared resulting in the land becoming unsuitable for agriculture.
Taxes
Changes in indirect taxes (taxes on expenditure) increase the cost of living and push up the prices of products in the shops.
Expectations
Another factor that can accelerate cost-push inflation is a poulation's expectation of inflation. This sounds odd, but when you consider that employees build their expectation of inflation into their wage claims, you can see that this in itself can be a cause of inflation. If employees expect inflation to be 5%, they may expect a wage rise equal to, or in excess of, this level. If employees manage to obtain that wage increase, then this may cause further cost-push inflation as firms are face higher production costs, which firms attempt to pass on to consumers by charging higher prices. The higher inflation may then raise people's expectations further causing a vicious cycle or inflation spiral. Expectations can be a bit like a self-fulfilling prophecy. Higher expectations can actually cause higher inflation.
Excess monetary growth
It is also important to look at the role of the amount of money (money supply) in the economy. Monetarist economists believe that increased growth in the money supply can cause inflation. This happens because the extra money boosts the level of demand, and so causes demand-pull inflation.
Case Study - car prices in Trinidad

Read the article Quake pushes up Japanese car prices in Trinidad and then consider answers to the questions below. (You can read the article in the web window below, or follow the previous link to open it in a new web window).

- Describe the type of inflation the tsunami and earthquake might lead to in Jamaica.
- Explain how the Japanese tsunami and earthquake has affected the price of cars in Jamaica.
- Examine the effect of imported inflation on the economy of Jamaica.
Possible relationships between unemployment and inflation
As we have seen, it is very important for a government to achieve its objectives. However, we are also now aware that these economic objectives are closely related and that, a movement in one, may cause an opposite movement in another. Such movements need not be beneficial to the economy. For example, a large balance of payments deficit might cause a fall in the exchange rate and thereby impact on the rate of inflation. So, it is very much a 'balancing act' for government, whose policies can get blown off course by events beyond their control, such as a war in another country or a natural disaster.
If you would prefer to view this interaction in a new web window, then please follow the link below:
Up until the recent 'credit crunch' in 2008, many economies were experiencing both low inflation and low unemployment. Improvements in technologies which have lowered costs, and globalization which lowered import prices were two factors thought to be responsible for this. However, in the 1970s the curve broke down as the economies suffered from unemployment and inflation rising together (stagflation). This caused governments many problems and economists struggled to explain the situation. One of the most well-known explanations came from Milton Friedman - a monetarist economist. He developed a variation on the original Phillips Curve called the 'long-run' or 'expectations-augmented' Phillip's Curve, which is explained in the following pages.
PlotIT - Phillips curve
In the short run, there seems to be an inverse relationship between inflation and unemployment. During the expansionary phase of the business cycle, unemployment falls but inflation rises. During the contractionary or slowdown phase, inflation falls but unemployment rises. This inverse relationship can be shown in a Phillips curve.
The period from 1987 to 1993 illustrates these effects. The UK economy was growing rapidly from 1987 to 1989, but then moved into recession. The following table shows inflation and unemployment in that period.
| 1987 | 1988 | 1989 | 1990 | 1991 | 1992 | 1993 | |
|---|---|---|---|---|---|---|---|
| Inflation (%) | 4.1 | 4.9 | 7.8 | 9.5 | 5.9 | 3.7 | 1.6 |
| Unemployment (%) | 10.3 | 8.6 | 7.2 | 6.9 | 8.8 | 10.1 | 10.4 |
Plot the above figures on the following diagram by clicking on the diagram at the appropriate point for each part. When you have done this, click on 'Reveal' to show how a line of best fit can be plotted from this scatter of points.
Phillips curve - long-run
If you would prefer to view this interaction in a new web window, then please follow the link below:
Some criticisms of the Friedman analysis
- Keynesians would maintain that there is nothing natural about the natural rate of unemployment. The level of employment in the economy is something, which can be crucially determined by government policies designed to influence the level of aggregate demand. If inflationary tendencies set in as a result of an expansionary impetus, the rise in prices may be checked through a variety of policies.
- Marxists would maintain that the analysis merely perpetuates bourgeois ideology in that unemployment is made to appear as something that is part of the natural order of the universe and as such to be accepted without question. In Marxist analysis, unemployment is 'natural' only to the economic system known as capitalism. It stems from the historic tendency of capitalism towards profits crisis, and is necessitated by the desire of the owners of the means of production to restore profitability and to maintain a reserve army of unemployed. In a planned socialist society, with the means of production commonly owned and production undertaken for need, not profit, unemployment would be unnecessary and indeed irrational. The monetarist's analysis places the responsibility for unemployment on workers rather than the system itself.
Natural rate of unemployment
Monetarists believe that in the long run real output tends to an equilibrium level, because employment tends to an equilibrium level. The level of unemployment that exists in equilibrium is referred to as the natural rate of unemployment, which is the amount of structural and frictional unemployment which is left in the economy when supply and demand are in balance. For monetarists, the natural rate of unemployment is the full employment rate and would be consistent with stable wages and prices.
The monetarist view of the labour market differs from the Keynesian view in that it considers unemployment from the supply-side of the economy, rather than resulting from deficient demand.
The labour market is considered like any other market where the equilibrium price, i.e. the wage rate, is determined by demand and supply. The amount of labour demand by employers will depended on the level of real wages.
Hence the higher the real wage, the lower the demand for labour
the lower the real wage, the higher the demand for labour
the higher the real wage, the higher the supply of labour
the lower the real wage, the lower the supply of labour
The equilibrium real wage will be established where demand for labour is equal to the supply of labour.
Any unemployment remaining, when the labour market is in equilibrium, is referred to as the natural rate of unemployment.
Figure 1 Natural rate of unemployment
With reference to figure 1, the labour market is in equilibrium at OM, with a real wage of OW. If the real wage was above the equilibrium, then excess supply of labour would result as the supply of labour is greater than the demand.
The implication from this is that unemployment is caused by real wages being too high, and that the cure for unemployment is for workers to accept lower real wages. Monetarists would say that any unemployment above OM is voluntary, and occurs because workers are not willing to work for a low enough wage. Thus any unemployment at OM is referred to as the natural rate of unemployment, and is the unemployment which remains when the labour market is in equilibrium.
What determines natural rate and how can it be reduced?
The natural rate of unemployment cannot be defined as some percentage of the labour force. It depends on a number of factors which are liable to change over time. For example:
- Technology and information
- Comparative advantage and international trade
- The degree of occupational and geographical mobility
- Information regarding job opportunities
- Restrictive practices imposed by trade unions
According to monetarists it would, therefore, follow that the natural rate of unemployment could be reduced by removing 'frictions' or obstacles to supply. This could be achieved by various supply-side measures, such as:
- Reducing the power of trade unions to resist reductions in real wages and to impose minimum wage rates (i.e. unions should be made more docile and accepting of the conditions which owners of capital wish to impose on them!).
- A combination of reduced benefits and lower taxes to induce the unemployed to take lower paid jobs.
- Increasing geographical and occupational mobility (e.g. with retraining).
- Establishing an efficient system of information flows.
NAIRU
 The concepts of the natural rate of unemployment and NAIRU are quite close and are often used interchangeably, but there is a slight difference between the two.
- Natural rate of unemployment (NRU) is a neo-classical, or monetarist concept, which is the rate of unemployment when the demand for labour equals the supply of labour, and the labour market 'clears'. Any worker who is unemployed at the NRU is deemed to be voluntarily unemployed, in the sense that people who are available for, and seeking work, choose not to accept employment at the going market wage.
- Non-accelerating inflation rate of unemployment (NAIRU) is a neo-Keynesian concept, which is the level of unemployment at which wage and price setting are mutually consistent and the inflation rate is constant. In the case of the NAIRU, market clearing in the competitive sense is not involved, so that equilibrium for firms and workers involve mutual accommodation of each other's requirements through collective bargaining. Here labour market conditions, as reflected in unemployment, have only an indirect impact on the wage bargain. It is also likely that the level of unemployment implied by the NAIRU will be higher than at the NRU - if collective bargaining is successful at bringing about a wage that would be higher than the free market one, this may be at the expense of the level of employment.
Economic growth
By the end of this section you should be able to:

- Define economic growth as an increase in real GDP.
- Describe, using a production possibilities curve (PPC) diagram, economic growth as an increase in actual output caused by factors including a reduction in unemployment and increases in productive efficiency, leading to a movement of a point inside the PPC to a point closer to the PPC.
- Describe, using a PPC diagram, economic growth as an increase in production possibilities caused by factors including increases in the quantity and quality of resources, leading to outward PPC shifts.
- Describe, using an LRAS diagram, economic growth as an increase in potential output caused by factors including increases in the quantity and quality of resources, leading to a rightward shift of the LRAS curve.
- Explain the importance of investment for economic growth, referring to investment in physical capital, human capital and natural capital.
- Explain the importance of improved productivity for economic growth.
- Discuss the possible consequences of economic growth, including the possible impacts on living standards, unemployment, inflation, the distribution of income, the current account of the balance of payments, and sustainability.

- Calculate the rate of economic growth from a set of data.
Economic growth (notes)
The meaning of economic growth

Economic growth
This occurs where there is an increase in the productive potential of the economy and is best measured by the increase in a country's real level of output over a period of time, i.e. the increase in real Gross Domestic Product ('real' meaning adjusted for inflation).
As we saw in the previous section, there are various measures of national income; GDP and GNP being two of these. GDP considers all output that has been domestically produced, whereas GNP takes into account net property income from abroad or paid abroad.
Causes of economic growth
 For economic growth to take place either, or both, of the following must happen
- An increase in resources (natural, human and or capital) available to a country
- An increase in the efficiency with which a country's resources are used in the production process.
Have a look at section 4.1 on growth and development for a more detailed view of how these increases can happen. Although this section focuses on developing countries, the factors influencing the level of economic growth will be the same. Clearly, the role of investment is essential in increasing the amount of resources available bringing about economic growth. This investment may be in:
- physical capital, e.g. building nuclear power stations, roads or wind farms
- human capital, e.g. building more schools and universities
- natural capital (or the stock of natural ecosystems that yields a flow of valuable ecosystem goods or services into the future), e.g. establishing more national parks, sustainable forests
It is usual to distinguish between actual growth and potential growth.
- Actual growth is the percentage annual increase in national output actually produced
- Potential growth is the percentage annual increase in the capacity of the economy to produce
Economic growth and the PPF (1)
Economic growth can be shown graphically using the production possibility curve. Consider the two graphs below.
If you would prefer to view this interaction in a new web window, then please follow the link below:
Economic growth and the PPF (2)
If you would prefer to view this interaction in a new web window, then please follow the link below:

The above analysis raises two questions for governments.
- How do they move the economy from operating at the point inside the production possibility curve to a position on the production possibility curve?
- In the longer term how do they bring about a shift of the production possibility curve from curve 1 to curve 2? In other words how can a government encourage economic growth? Ultimately, it can only do so by increasing the amount of resources, or finding ways of using the resources more efficiently.
Economic growth and the business cycle
We saw in section 2.1 that economic activity measured by GDP and GDP per capita is prone to short term cyclical fluctuations. This was referred to as the of business or trade cycle. The figures below show the various stages of the trade cycle and can also be used to illustrate whether an economy is experiencing economic growth. To observe this we can look at the trend line. If the trend shows GDPincreasing over time, then the economy will be experiencing economic growth. The trend line can also slope downwards, in which case the economy is experiencing economic decline or negative economic growth.
Economic growth - what the data says

Identify the levels of GDP per capita in your country by accessing the World Bank Catalogue though this link.
- Choose the World Development Data set
- Click on Indicators
- Type the term 'GDP per capita' into the search engine.
- Save the GDP per capita data in a spreadsheet
- plot the data over a 20 year period using a graph
- try to draw a trend line
- if you have managed to establish a trend line - is this upward, or downward sloping?

1. Describe the data you have plotted. Identify whether there is evidence of a business or trade cycle.
Repeat the exercise for two other countries from different continents.
2. Identify similarities and differences between the three sets of GDP data.
3. Analyse the factors that might account for the similarities and differences you have identified. (You may want to revisit this answer once you have completed this section).
Economic growth and the aggregate supply curve
Finally, we can use the aggregate demand and supply diagrams to illustrate the effect of economic growth. An increase in economic growth will cause the long run aggregate supply curve to shift to the right as in figure 1 below.
Figure 1 - Increase in long-run aggregate supply
Consequences of economic growth

Pause for thought
Economic growth is often seen as an economic goal to which all countries and governments should aspire. . However, economic growth can be a double-edged sword in that it can have both distinct advantages, but create problems as well. You might want to work with fellow students to consider what these pros and cons might be. Follow the links below to compare your responses.
Equity in the distribution of income
By the end of this section you should be able to:

- Explain the difference between equity in the distribution of income and equality in the distribution of income.
- Explain that due to unequal ownership of factors of production, the market system may not result in an equitable distribution of income.
- Analyse data on relative income shares of given percentages of the population, including deciles and quintiles.
- Draw a Lorenz curve and explain its significance.
- Explain how the Gini coefficient is derived and interpreted.
- Distinguish between absolute poverty and relative poverty.
- Explain possible causes of poverty, including low incomes, unemployment and lack of human capital.
- Explain possible consequences of poverty, including low living standards, and lack of access to health care and education.
Equity in the distribution of income (notes)
 In this section, we move on to look at the distribution of income within a society. Market economies often lead to a very unequal distribution of income. The economically strong will tend to be rewarded with more income, but the economically weak may lose out - the rich get richer, the poor get poorer.
Government policy will often be aimed at reducing these disparities in income distribution, and in this section we look at the ways taxes and benefits can be used to achieve this.
Indicators of income equity
If you would prefer to view this interaction in a new web window, then please follow the link below:

Task
Use the web and perhaps the web site of the statistics office for the country where you live to try to find Gini coefficient data. This may be difficult and if you can't find it, try broadening the search for any other country to compare it with the sample UK data given above.
Poverty
The United Nations defines poverty as:
"a denial of choices and opportunities, a violation of human dignity. It means lack of basic capacity to participate effectively in society. It means not having enough to feed and clothe a family, not having a school or clinic to go to, not having the land on which to grow one's food or a job to earn one's living, not having access to credit. It means insecurity, powerlessness and exclusion of individuals, households and communities. It means susceptibility to violence, and it often implies living in marginal or fragile environments, without access to clean water or sanitation."
Poverty is usually expressed as either absolute or relative poverty.
- Absolute poverty is generally regarded as the lack of sufficient resources with which to keep body and soul together. Those in absolute poverty struggle just to meet their basic needs. Absolute poverty usually refers to a set standard, which is consistent over time and between countries. The World Bank defines extreme poverty as living on less than US $1.25 per day, and moderate poverty as less than $2.
- Relative poverty refers to income or resources in relation to the average within a country. It is concerned with the absence of the material needs to participate fully in accepted daily life. Relative poverty is sometimes defined as where income is half the national average, or less.
The poverty line: An Indicator of Relative poverty
The poverty line used in the UK is 60 per cent of the median UK income, after housing costs have been paid. Below this amount, a household is described as living in income poverty. The poverty line is adjusted to take into account how expenditure needs differ between types of households.
UK poverty line for a range of households, 2009/10
| Household type | Poverty line: Household income, £ a week |
| Single person, no children | £124 |
| Couple with no children | £214 |
| Lone parent with two children (aged 5 and 14) | £256 |
| Couple with two children (aged 5 and 14) | £348 |
Source: http://www.cpag.org.uk/povertyfacts/

Questions for consideration
- Explain why the poverty line varies according to family circumstances.
- Find out the median income for your country. To what extent do you think 60% of this figure is an acceptable indicator of poverty?
The causes of poverty
Section 4 of the pack considers a number of issues relating to the causes of absolute poverty in developing countries.
As far as the causes of relative poverty are concerned, read the following resource provided by Child Poverty Action Group (You can read this in the web window below or follow the previous link to open the site in a new web window).

Watch the following video clip on poverty in the USA and answer the following questions.

- Identify the extent of relative poverty in the USA.
- Describe the main causes of relative poverty in the USA.
- Analyse the impact of being in relative poverty in the USA.
The role of taxation in promoting equity
By the end of this section you should be able to:

- Distinguish between direct and indirect taxes, providing examples of each, and explain that direct taxes may be used as a mechanism to redistribute income.
- Distinguish between progressive, regressive and proportional taxation, providing examples of each.
- Explain that governments undertake expenditures to provide directly, or to subsidize, a variety of socially desirable goods and services (including health care services, education, and infrastructure that includes sanitation and clean water supplies), thereby making them available to those on low incomes.
- Explain the term transfer payments, and provide examples, including old age pensions, unemployment benefits and child allowances.
- Evaluate government policies to promote equity (taxation, government expenditure and transfer payments) in terms of their potential positive or negative effects on efficiency in the allocation of resources.

- Calculate the marginal rate of tax and the average rate of tax from a set of data.
The role of taxation in promoting equity (notes)
 It is argued by some economists and politicians, that one of the purposes of taxation is to help bring about a more equitable distribution of income.
Canons of taxation
The 'canons of taxation' were first developed by Adam Smith as a set of criteria, by which to judge the efficiency and equity of taxes. These canons are still widely accepted as providing a good basis for such a judgment.
Smith's four canons were:
- The cost of collection must be low relative to the yield
- The timing and amount to be paid must be certain to the payer
- The means and timing of payment must be convenient to the payer
- Taxes should be levied according to ability to pay
Modern economists added three more canons to update and extend them to reflect contemporary issues:
- A tax must not hinder efficiency, or should involve the least loss of efficiency
- A tax should be compatible with foreign tax systems
- Tax should automatically adjust to changes in the rate of inflation (particularly important in high inflation economies)
A good tax should meet most of these criteria, and these canons are well worth learning to provide a structure for an examination question on taxation.
Classification of taxes
Direct and indirect taxation
- Direct taxation - taxation on income. Direct taxation includes income tax, profits tax and wealth taxes on inheritance.
- Indirect taxation - taxation on expenditure. Indirect taxation includes VAT (sales tax) and customs and excise duties (tax on cigarettes, alcohol etc.).
Progressive, regressive and proportional taxes
Taxes can also be classified according to their impact on different income groups. Taxes, which redistribute from better-off to less well-off groups, are called 'progressive' taxes. Those with an opposite effect are called 'regressive' taxes.
The definitions that you need to know are:
- Progressive tax - a tax that takes a greater proportion of a income as their income rises.
- Regressive tax - a tax that takes a smaller proportion of a income as their income rises.
- Proportional tax - a tax where the percentage of income paid in taxation always stays the same.
The balance of thesetype of taxes will have a significant effect on income distribution in an economy. If a government chooses to switch the balance of taxation from progressive to regressive taxes, then the less well-off in society will be hardest hit. In general, direct taxes tend to be progressive and indirect taxes regressive.
Governments with differing objectives will aim to change the balance of direct and indirect taxes. 'Right-wing' governments may choose to shift the balance of taxation from direct to indirect. They will argue that this is more efficient as it allows people to keep more of what they earn - providing greater incentive to work hard. Taxing people on expenditure is also seen as more economically efficient. However, a switch from progressive direct taxes to regressive indirect taxes will have an adverse impact on the distribution of income.
Why does a government tax? The practical reason is that governments require income to fund their spending, not only on their own administration, but also on behalf of the society that they represent. Countries may have accumulated reserves of cash of over time, but it is unlikely that this could sustain their long-term spending plans. Governments tend to raise most of their income from those who can, in theory, afford it. Some of this tax revenue may be re-directed this to the more vulnerable members of society through benefits and/or focused social investment. Direct taxes, and in particular income tax, are normally progressive. This means that the richer members of society contribute more to government revenues and, as a consequence of government policies, help the less well-off. This is thought to be EQUITABLE, though not everyone would agree. Some economists and politicians argue that by reducing tax, particularly on wealth creators and entrepreneurs, governments will stimulate economic growth and incomes. Additional incomes will be spent within the domestic economy, through investment and higher consumption, and will set up a multiplier effect generating more incomes for those producing the goods and services that satisfy the higher demand. There is a so called 'trickle-down' effect. However, there does seem to be a tendency for the gap between rich and poor to widen when governments follow a more laissez-faire approach, suggesting that trickle down is not particular efficient.

Reflect on the reasons why the trickle-down effect may be inefficient as a means of stimulating economic growth and average incomes.
Other methods of promoting equity
Transfer payments
Tax revenues raised governments may be spent on a huge range of items. However, two of the most significant areas for government expenditure in developed economies are:
- Pensions
- Benefits to those out of work, sick, young or others unable to care for themselves (social security payments)
Benefits (social security) and pensions are known as transfer payments.

Transfer payments
A payment from a government to its citizens, for which no good or service is received in exchange. Governments use transfer payments as means of income redistribution by making payments under social welfare programmes, such as social security, old age or disability pensions and unemployment benefits. Transfer payments are excluded when calculating gross national product. A significant proportion of government expenditure is on transfer payments.
It is the combination of transfer payments and progressive taxes that has the most impact on income distribution. Transfer payments are paid to the poorest and most vulnerable members of society and so will have a significant redistribution effect.
By giving people benefits/social security payments governments are:
- helping the less fortunate live more financially secure lives.
- increasing injections into the circular flow of income which will be subject to a multiplier effect increasing aggregate demand in the economy.
- expecting some of the expenditure to re-enter the government funds via the taxes benefit recipients pay.
Provision of Social infrastructure
Governments spend tax revenues directly on providing social infrastructure including:
- Education
- Health service
- Defence
By making services, such as education and health servies, available to people on low incomes, at zero or reduced prices, poverty is reduced and a more equitable distribution of income is achieved. This will certainly be the case if public servies are funded through a progressive tax structure.
Government subsidy
Government may provide subsidies to those on low incomes to fund consumption of certain goods and services provided by the private sector, such as concessionary bus and train fares.
2.3 Macroeconomic objectives (questions)
In this section are a series of questions on the topic - macroeconomic objectives. The questions may include various types of questions. For example:
- Short-answer questions - a series of short-answer questions to help you check your understanding of the topic
- Case studies - questions based around a variety of information
- Long answer - questions requiring an extended/essay type response
- Data response - responding to data or topical economics news articles
Click on the right arrow at the top or bottom of the page to work through the questions.
Macroeconomic objectives - self-test questions

1 |
Demand-side unemploymentDemand-side unemployment is partly caused by: |
2 |
Types of unemploymentWhich of the following is NOT a type of unemployment? |
3 |
Costs of unemploymentWhich of the following is not a cost of unemployment? |
4 |
Reducing unemploymentWhich of the following might be used by government to lower unemployment? |
5 |
Types of unemploymentWhen there is unemployment caused by a lack of consumer spending, we classify this type of unemployment as? |
6 |
Types of unemploymentWhen there are vacancies in the job-market, but also high levels of unemployment, then we could say that this unemployment is? |
7 |
Demand-pull inflationDemand-pull inflation is said to exist when: |
8 |
Costs of inflationShoe leather costs are: |
9 |
Costs of inflationWhy might uncertainty arise during a period of sustained price rises? |
10 |
InflationWhich of the following would not influence the rate of inflation? |
11 |
Economic growthWhat is economic growth? |
12 |
Increases in consumer spendingWhich of the following is the least likely to occur if there is a sustained rise in consumer spending? |
13 |
Cost-push inflationWhich of the following best defines cost-push inflation? |
Short questions

Question 1
Distinguish between the level of unemployment and the rate of unemployment.
Question 2
Explain why a government might find the goal of full employment difficult to achieve.
Question 3
Explain how a government might tackle structural unemployment.
Question 4
Define what an economist means by the term 'inflation'.
Question 5
Examine which groups within society might be most affected by a permanent rise in prices.
Question 6
Briefly state two reasons why inflation may be considered to be an economic problem.
Question 7
Explain why deflation might be considered to be an economic problem.
Question 8
Explain the factors, which may give rise to an unequal distribution of (a) income and (b) wealth.
Question 9
Evaluate the different approaches, which a government can adopt to reduce the degree of inequality in a society.
Question 10
Statistics indicate that over the past decade the distribution of income in many countries has become more unequal. Identify two reasons why this may have occurred.
Question 11
In relation to taxation, explain the meaning of the terms (a) equity and (b) efficiency.
Data response question (1)
Read the article Families feel pinch as inflation threatens economic miracle and then answer the questions below. (You can read the article in the web window below, or follow the previous link to read the article in a new web window)

Question 1
Distinguish between cost-push and demand-pull inflation.
Question 2
Using aggregate demand and supply diagrams, evaluate the extent to which the inflation taking place in China is of a cost-push nature.
Question 3
Explain the main policies that the Chinese government has been adopting to try to reduce the level of inflation.
Question 4
Discuss the extent to which growth in world food prices will affect the level of aggregate demand in China.
Data response question (2)
Read the article Japan sees end to deflation curse and then answer the questions below. (You can read the article in the web window below, or follow the previous link to read the article in a new web window)

Question 1
Define the terms:
- inflation
- deflation
Question 2
Using aggregate supply and demand diagrams, analyse the changes currently taking place in the Japanese economy.
Question 3
It has been said that "a small amount of inflation in the system is not a bad thing". Evaluate this statement.
Long questions

Question 1
(a) Explain the purpose of the Lorenz Curve and the Gini Coefficient
(b) Evaluate the view that greater income equality can best be achieved through the taxation system.
Question 2
(a) Describe how the Philips curve helps illustrate the relationship between unemployment and inflation.
(b) Explain how the Philips curve helps understanding of the impact of increasing aggregate demand on unemployment in the long run.
2.4 Fiscal policy (notes)
In the previous section we considered the level of overall economic activity, examined the concepts of aggregate demand and aggregate supply and looked at the role of macroeconomic objectives in the development of government policies.
In this section we examine fiscal policy.
By the end of this section you should be able to:

- Explain that the government earns revenue primarily from taxes (direct and indirect), as well as from the sale of goods and services and the sale of state-owned (government owned) enterprises.
- Explain that government spending can be classified into current expenditures, capital expenditures and transfer payments, providing examples of each.
- Distinguish between a budget deficit, a budget surplus and a balanced budget.
- Explain the relationship between budget deficits/surpluses and the public (government) debt.
- Explain how changes in the level of government expenditure and/or taxes can influence the level of aggregate demand in an economy.
- Describe the mechanism through which expansionary fiscal policy can help an economy close a deflationary (recessionary) gap.
- Construct a diagram to show the potential effects of expansionary fiscal policy, outlining the importance of the shape of the aggregate supply curve.
- Describe the mechanism through which contractionary fiscal policy can help an economy close an inflationary gap.
- Construct a diagram to show the potential effects of contractionary fiscal policy, outlining the importance of the shape of the aggregate supply curve.
- Explain how factors including the progressive tax system and unemployment benefits, which are influenced by the level of economic activity and national income, automatically help stabilize short-term fluctuations.
- Explain that fiscal policy can be used to promote long-term economic growth (increases in potential output) indirectly by creating an economic environment that is favourable to private investment, and directly through government spending on physical capital goods and human capital formation, as well as provision of incentives for firms to invest.
- Evaluate the effectiveness of fiscal policy through consideration of factors including the ability to target sectors of the economy, the direct impact on aggregate demand, the effectiveness of promoting economic activity in a recession, time lags, political constraints, crowding out, and the inability to deal with supply-side causes of instability.
Fiscal policy - introduction
 Fiscal policy is the use of government expenditure and taxation to manage the economy. It can be employed:
- to boost the level of economic activity if there is a shortage of demand which is causing a deflationary gap. In this case, it is called reflationary policy.
- to reduce the level of economic activity if too much demand in the economy is causing an inflationary gap . In this case, a deflationary policy is appropriate.
- as a supply-side policy ,used to improve incentives, e.g. through tax cuts, or to improve the quality of resources, such as increased government expenditure on health and education.
The government budget

We will approach the examination of government expenditure by looking at a case study of the UK. As we work through this, you may like to find equivalent data and information for your own country.
We will start the process by examining some terminology.

The budget
The budget is essentially the relationship between government spending on the one hand and government income or taxation on the other hand.
Sources of government income
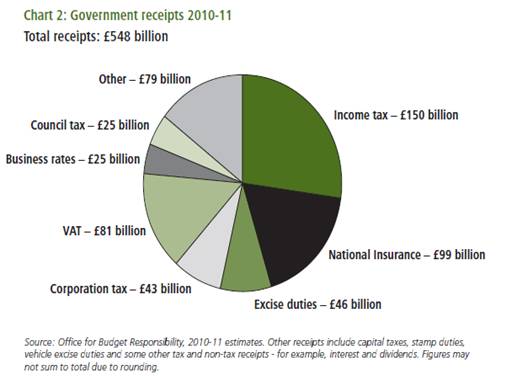
Source: From 2011 UK Budget http://www.hm-treasury.gov.uk/d/junebudget_complete.pdf

Task (1) - sources of government income (UK)
The above chart shows how the UK government raises its revenue. Find out what each of these different forms of collecting revenue relate to.
| Income source | Brief explanation |
|---|---|
| Council tax | |
| Business rates | |
| VAT | |
| Corporation tax | |
| Excise duties | |
| National insurance | |
| Income tax | |
| Capital tax | |
| Stamp duties | |
| Vehicle excise duties | |
| Interest and dividends |

Task (2) - sources of government income (other country)
Build an equivalent table to that in Task (1) for your own country.
Types of government expenditure
Government spending or government expenditure is often divided into three main types:
- Government final consumption expenditure on goods and services for current use to directly satisfy individual or collective needs of the members of the community.
- Gross fixed capital formation (or government investment) - government spending on goods and services intended to create future benefits, such as infrastructure investment in road building and research spending.
- Transfer payments - spending that does not involve the acquisition of goods and services, but instead represent transfers of money, such as social security payments and unemployment benefit.
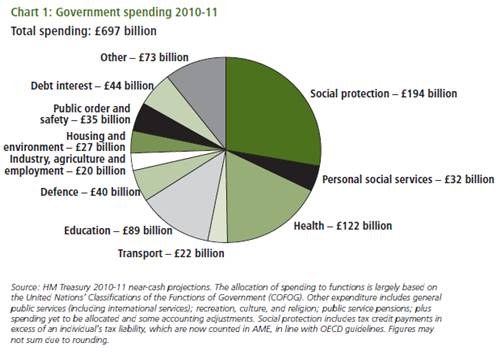

Task (1) - types of government expenditure (UK)
Complete the table below with an example of each type of government spending.
| Government spending types | Example |
|---|---|
| Social protection | |
| Personal social services | |
| Health | |
| Transport | |
| Education | |
| Defence | |
| Industry Agriculture, and Employment | |
| Housing and environment | |
| Public order and safety | |
| Debt interest | |
| Recreation, culture and religion | |
| Public sector pensions |

Task (2) - types of government expenditure (other country)
Build an equivalent table to that in Task (1) for your own country.
A Case study: Government spending in the UK

The following diagram shows the extent of government spending in the UK, and identifies spending by individual government departments.
The following website provides a great deal on information about UK government spending. Specifically it enables you to see information about:
- types of spending
- spending by region
- central and local government spending
- how government spending changes over time
- the proportion of overall GDP spent by the UK government

- Identify the five main areas of government spending in the UK.
- Describe how the proportion of government spending on these five areas changed over the last 5 years.
- Plot the proportion of GDP spent by the government over the last 10 years and describe the results you have found.
- Use the web to find out the above data for your own country.
The budget outcome

- Budget surplus exists where government income from taxation exceeds government spending
- Budget deficit exists where government income from taxation is less than government spending
- Balanced budget exists where government income from taxation equals government spending.
- Fiscal stance refers to the position the government is taking with regard to operating a budget deficit, budget surplus or a balanced budget. Whilst you may think that it would be common sense for a government to always run a budget surplus or a balanced budget, there may be very good reasons for it to deliberately choose to operate a budget deficit.
- National debt refers to the total amount that the government has borrowed over time as a consequence of operating budget deficits.
- Public sector borrowing requirement is where total government income (tax revenue and income from public corporations) is less that government spending. It is largely made up of the budget deficit. In such cases, the government has to borrow money to finance the short fall. It can do this by selling national savings certificates and securities such as gilts or treasury bills.
- Public sector debt repayment is where total government income (tax revenue and income from public corporations) is greater than total government spending. In such cases, the government can repay some its previously accumulated national debt.

What does the data say?
- Using the World Bank website World Bank - data indicators
Record:- Total government revenue
- Total government expenditure
for your country for the most recent 10 years. Put the data into a spreadsheet
- Plot the two data sets on the same graph over time.
- Describe the state of the budget for each of the years.
- Describe changes in the budget over the 10 years i.e. moves from surplus to deficit or vice versa?
- In the event of a budget deficit, identify how this was financed.
Fiscal policy and short-term demand management
Reflationary or expansionary fiscal policy
Governments may choose to employ reflationary or expansionary fiscal policy in times of recession or a general downturn in economic activity. In this situation, they will use fiscal policy to stimulate the economic activity. They may do this by lowering taxes in some form or by increasing the level of government expenditure. This should encourage people to spend more. If they lower indirect taxes then this will lower the prices of the taxed goods and encourage more demand. Alternatively, they could lower direct taxes increasing disposable incomes (take-home pay) and encouraging greater consumption. Either way the level of demand in the economy should rise and stimulate economic growth.
Reflationary fiscal policies can include:
- Cutting the lower, basic or higher rates of tax
- Increasing tax-free allowances
- Increasing the level of government expenditure
The effect of these policies should be to boost aggregate demand and the equilibrium level of income. This can be seen in Figure 1 below.

Figure 1 Reflationary fiscal policy
However, this policy may cause demand-pull inflation. We can see from Figure 1, that there has been an increase in the price level from P1 to P2. Keynesians would differ slightly with this view and argue that reflationary fiscal policy is appropriate where there is spare production capacity as they believe that the economy can settle at any equilibrium level of output. Their view of reflationary policy can be seen in Figure 2 below.
Figure 2 Reflationary fiscal policy - Keynesian analysis
For Keynesians, any increase in AD on the horizontal section of the AS curve will not be inflationary. Prices will only increase when the economy approaches full employment and can only be inflationary as the AS curve becomes vertical.
Deflationary fiscal policy
 Deflationary fiscal policy is likely to be most appropriate in times of economic boom. If the economy is growing at above its capacity, this is likely to cause inflation and balance of payments problems. To slow the growth of the economy, the government could raise taxes in some form and/or reduce government expenditure. Either of these should reduce the level of demand in the economy and, therefore, the level of economic growth. The government may increase indirect taxes, which will result in higher prices for goods and services if firms maintain their profit margins. This should deter consumers from purchasing the same quantity of goods and services. Alternatively, the government may increase direct taxes, which will leave people with less money in their pockets and discourage spending.
Deflationary fiscal policies include:
- Increasing the lower, basic or higher rates of tax
- Reducing the level of personal allowances
- Reducing the level of government expenditure
The effect of these policies will be to shift the aggregate demand curve from AD1 to AD2, as in Figure 3 below.
Figure 3 Deflationary fiscal policy
Impact of automatic stabilisers
"Automatic stabilisers are features of the tax and transfer systems, that tend by their design to offset fluctuations in economic activity without direct intervention by policymakers. When incomes are high, tax liabilities rise and eligibility for government benefits falls, without any change in the tax code or other legislation. Conversely, when incomes slip, tax liabilities drop and more families become eligible for government transfer programs, such as food stamps and unemployment insurance, that help buttress their income."
Source: http://www.taxpolicycenter.org/briefing-book/background/stimulus/stabilizers.cfm
 In section 2.1, you discovered that real GDP fluctuates over time and that these create business, or trade, cycles. Economies move through the following cycle:
- Peak/boom
- Downturn/ recession
- Trough/depression
- Recovery/expansion; leading back to a peak/boom
Income taxation and transfer payments can act as non-discretionary fiscal policy, in that they automatically have the effect of dampening the business cycle. In other words, the government does not necessarily intend, or want, the consequences.
During times of expansion, when real GDP is growing, incomes will be increasing. If the country has a progressive tax, such as an income tax, in place an increasing proportion of those incomes will be paid to the government as incomes rise. This represents a leakage from the circular flow of income and thus is not passed on and spent on new goods and services. The effect of this is to reduce the rate of growth of GDP.
Similarly, during times of recession when real GDP is falling, incomes will fall as unemployment increases. Transfer payments, such as unemployment benefits, will start to kick in, ensuring that consumption does not slow-down in the same proportion as falling employment income. Real GDP, therefore, does not continue to fall at the same rate.
Fiscal drag
We have shown the effect of automatic stabilisers dampening down the business cycle and bringing about certain amount of stability in output, employment and income. However, automatic stabilisers can sometimes cause problems if the economy is in a depression with a great deal of unemployment. The stabilisers can reduce the upward effects of the multiplier as the governments tries to kick start a recovery by increasing government spending. Incomes will not increase as rapidly as hoped, because additional taxation causes some of the injections to be leaked from the circular flow of income. Similarly, ifgovernments want to introduce a discretionary deflationary policy to close an inflationary gap, the existence of transfer payments will not enable the desired reduction in consumer spending to happen as fast as the government may want. In both cases, the discretionary policy is being dragged back by the stabilisers, hence the term, 'fiscal drag'.
Fiscal policy and its impact on potential output
 Supply-side policies are policies that aim to increase the capacity of the economy to produce. However, it is also possible for fiscal policy to act on the level of supply and government will often use fiscal policy as one of their key supply-side policy tools.
Income tax may have an effect on people's incentives to work. This will be true at most income levels. If income tax at low income levels is too high, people may choose to remain unemployed, or not to seek, employment. This is an economically rational decision, because it may be more rewarding to stay on benefits when other expenses of employment, such as transport and child-care, are factored in. This situation is often referred to as a 'poverty trap', because the unemployed cannot improve their financial position. If income tax on high levels of income is too high, people may choose not to work so hard or take risks. Ultimately, they could make the choice to leave a particular country if taxes in other countries are significantly lower This 'flight' out a country to seek lower taxes elsewhere is called a 'brain drain', when the process involves large numbers of the most talented and skilled in a population.
Supply-side fiscal policies can include:
- Cutting the lower and basic rates of tax to open up the gap between the earnings in work and the benefits of those who are unemployed, to ensure people have an incentive to work
- Increasing the level of personal allowances for the same reason
- Reducing the top rate of tax to encourage enterprise, risk-taking and the incentive to work harder
- Government spending on health and education and infrastructure such as roads and railways.
The intended effects of these supply-side policies are known as 'microeconomic effects', although bear in mind that they may have macroeconomic effects as well. Whether, or not, supply-side policies work in the way they are intended, or whether they may are desirable, is considered in section 2.6.
Evaluation of fiscal policy
 The effectiveness of fiscal policy, as a measure to influence aggregate demand and output, is open to much debate. The argument over using fiscal policy revolves around whether:
- it can be used as a fine tuning mechanism
- it can be used to achieve the desired level of national income
- it can be used to reduce unemployment without causing overheating and inflation
- the 'right' levels of government spending and taxation be determined
- changes in government spending and taxation can be offset by changes in other injections and leakages
- time lags between changing policy and the effects are too long for the desirable results to be estimated or achieved
- an increase in aggregate demand will necessarily lead to an increase in output income and employment
- expansionary fiscal policy will have any undesirable effects, such as worsening the balance of payments situation or ' crowding out' private borrowing and investment
Major arguments in favour of fiscal policy
- Increasing aggregate demand through changing government spending and taxation will increase output, employment and income, working through an expenditure multiplier process.
Major arguments against fiscal policy
Fiscal policy - weaknesses
- Inflexibility - changes in direct taxes may take considerable time to implement and government spending is often inflexible in a downwards direction; e.g. for political or moral reasons, it is usually difficult to reduce government spending on pensions and benefits and once a capital project such as a motorway has been started, it is difficult, if not impossible, to stop it in mid-stream.
- Conflicts between objectives - fiscal policy designed to achieve one goal may adversely impact on another. For example, reflationary fiscal policy designed to stimulate aggregate demand and reduce unemployment may worsen inflation (N.B. for HL students only, this is explained in greater detail in the extension section on the long run Phillips curve).
- Supply-side economists believe that certain fiscal measures will have a disincentive effect. For example, an increase in income tax may adversely affect the supply of labour; an increase in profits tax may adversely affect the incentives of firms to invest and an increase in welfare benefits may adversely affect incentives to seek employment.
The multiplier effect & fiscal policy
If you would prefer to view this interaction in a new web window, then please follow the link below:
Accelerator
If you would prefer to view this interaction in a new web window, then please follow the link below:
Importance of the accelerator
The accelerator principle indicates how changes in the level of current income will have an accelerated impact on the level of investment and is, therefore, one explanation of economic instability and the upward and downward swings of the trade cycle.
Accelerator principle - some qualifications
- The upward leverage effect of the accelerator only takes effect if industry is operating at or near full employment. If industry has excess capacity it can meet any increase in demand by increasing output of underutilised equipment.
- Additional machines will only be ordered when the increased demand is believed to be permanent. Otherwise, firms will deal with additional orders by running down stocks or operating waiting lists.
- There may be an increase in demand for investment goods, but if the capital goods industries are fully employed, there may be an increase in the prices of capital goods and there could actually be a fall in demand for capital with more capital saving techniques being adopted. Here the accelerator will be reduced.
Weaknesses of accelerator theory
The accelerator assumes a fixed relationship between a change in consumption and a change in investment - the bullet points above show that this is not necessarily the case. The accelerator principle also ignores the time lags, which would probably occur in reality, between a change in consumption and the implementation of any investment decisions.
Crowding out
 Many economists argue that the government should aim, as a policy objective, to minimise the level of government borrowing and should not increase its spending if this means borrowing to do so. If the government borrows heavily, it will have to compete for funds with private sector firms, which want to borrow to invest themselves. This competition for funds will push up interest rates. Higher interest rates mean that firms will be less willing to invest and individuals may even be more reluctant to borrow to spend. This process is described as government expenditure 'crowding out' private borrowing. In its most extreme form, an increase in government expenditure will lead to an equivalent fall in consumption and investment (because of the higher interest rates) with the result that aggregate demand does not increase at all.
Economists debate how significant the effect of crowding out is and, as with most things, they rarely agree! (Keynesians generally argue that an increase in government spending, through the multiplier process, will crowd in private consumption and investment).
If the problem is one of unemployment, changes in taxation and particularly government spending may have a significant impact on the level of national income through the increase in aggregate demand that they cause. Fiscal policy therefore may be very effective in reducing demand-deficient unemployment. (N.B. For HL students only, the effectiveness of fiscal policy in combating unemployment may be explained through the operation of the multiplier effect. This is dealt with in the HL extension section that follows).
Fiscal policy may also succeed in shifting the LRAS curve to the right, increasing real output and reducing the rate of inflation. This may work via greater government spending on education and training and tax cuts, which improve incentives to work and invest.
As will be seen in Section 2.3, fiscal policy may be used to alter the distribution of income and wealth within an economy. Greater emphasis on direct, progressive taxes and benefits to the less well-off make the distribution more equal. The opposite effect will be achieved through a shift towards indirect, regressive taxes and cuts in benefits for the less well-off.
Section 2 of the course showed how fiscal policy can be used in a selective way, for example, to:
- Increase consumption of merit goods through subsidies and direct government provision
- Decrease consumption of demerit goods and imports through taxation
- Increase consumption of public goods
2.4 Fiscal policy (questions)
In this section are a series of questions on the topic - fiscal policy. The questions may include various types of questions. For example:
- Short-answer questions - a series of short-answer questions to help you check your understanding of the topic
- Case studies - questions based around a variety of information
- Long answer - questions requiring an extended/essay type response
- Data response - responding to data or topical economics news articles
Click on the right arrow at the top or bottom of the page to work through the questions.
Self-test questions

1 |
Progressive taxA progressive tax is one which: |
2 |
Reducing unemploymentWhich of the following might be used by government to lower unemployment? |
3 |
Government policiesMatch the examples of government policy given to the appropriate type. |
4 |
Government policiesMatch the examples of government policy given to the appropriate type. |
Short questions

Question 1
With reference to public expenditure and using suitable examles, distinguish between current, capital and transfer expenditure.
Question 2
A government can fund public spending through taxation and/or borrowing. Discuss the possible consequences of its decisions.
Question 3
When a government's budget deficit increases, this may lead to a worsening of the trade deficit. Explain why this might be the case.
Question 4
Explain two reasons why there may need to be controls on the growth of government spending.
Question 5
Explain why some economists consider crowding out to be important.
Question 6
Define the terms 'national income multiplier' and 'investment accelerator'.
Question 7
In a closed economy with no government sector, an increase in injections of $100 million causes the equilibrium level of national income to rise by $500 million. Calculate the marginal propensity to consume.
Question 8
An open economy with a government sector is in equilibrium. Assume the following:
- Marginal propensity to save = 0.4
- Marginal propensity to tax = 0.2
- Marginal propensity to import = 0.2
Showing your method of working, calculate:
(a) the value of the multiplier
(b) by how much the equilibrium level of national income would fall, if injections in the economy are reduced by $60m.
Question 9
Explain why increasing government expenditure is likely to have a larger multiplier effect than an equivalent reduction in taxation.
Question 10
Government expenditure represents one of the injections of expenditure. Explain how an increase in government spending may have a multiplier effect on the economy.
Data response (1)
Read the article The ups and downs of flat taxes and then consider answers to the questions below. You can either read the article in the window below or you can follow the previous link to read the article in a separate window.

Question 1
Distinguish between a progressive and a regressive tax
Question 2
Explain how a pure flat-rate tax would work in practice.
Question 3
Explain why many groups believe that a flat-rate tax will help boost economic growth.
Question 4
Explain what impact a flat-rate tax is likely to have on the level of tax revenue.
Question 5
Analyse the arguments for and against the adoption of a flat-rate tax in your country.
Data response (2)
Read the article Italy: Silvio Berlusconi pressed to make tax cuts by rightwing partner and answer the questions that follow. (You can read the article in the web window below, or follow the previous link to read the article in a new web window)

Question 1
Distinguish between a budget deficit and national debt.
Question 2
Describe the economic circumstances that Italy finds itself in at present.
Question 3
Using aggregate demand and supply diagrams, examine the impact of cutting taxation on Italian public finances, output, income and employment.
Question 4
Analyse which policy options are most appropriate to Italy in the current economic climate.
Long questions

Question 1
(a) Explain what is meant by a) tightening and b) loosening of fiscal policy.
(b) "Unemployment can best be reduced through the use of demand-side policies". Do you agree? Justify your answer.
Question 2
(a) Explain the difference between discretionary fiscal policy and automatic stabilisers
(b) Discuss the effectiveness of two fiscal policy options available to a country experiencing a recession.
2.5 Monetary policy (notes)
In the previous section we considered the level of overall economic activity, examined the concepts of aggregate demand and aggregate supply and looked at the role of macroeconomic objectives in the development of government policies and the operation of fiscal policy.
In this section we examine monetary policy.
By the end of this section you should be able to:

- Describe the role of central banks as regulators of commercial banks and bankers to governments.
- Explain that central banks are usually made responsible for interest rates and exchange rates in order to achieve macroeconomic objectives.
- Explain, using a demand and supply of money diagram, how equilibrium interest rates are determined, outlining the role of the central bank in influencing the supply of money.
- Explain how changes in interest rates can influence the level of aggregate demand in an economy.
- Describe the mechanism through which easy (expansionary) monetary policy can help an economy close a deflationary (recessionary) gap.
- Construct a diagram to show the potential effects of easy (expansionary) monetary policy, outlining the importance of the shape of the aggregate supply curve.
- Describe the mechanism through which tight (contractionary) monetary policy can help an economy close an inflationary gap.
- Construct a diagram to show the potential effects of tight (contractionary) monetary policy, outlining the importance of the shape of the aggregate supply curve.
- Explain that central banks of certain countries, rather than focusing on the maintenance of both full employment and a low rate of inflation, are guided in their monetary policy by the objective to achieve an explicit or implicit inflation rate target.
- Evaluate the effectiveness of monetary policy through consideration of factors including the independence of the central bank, the ability to adjust interest rates incrementally, the ability to implement changes in interest rates relatively quickly, time lags, limited effectiveness in increasing aggregate demand if the economy is in deep recession and conflict among government economic objectives.
Monetary policy - introduction
 In this section we consider the following topics in detail
- Interest rates
- The role of monetary policy
- The evaluation of monetary policy
Monetary policy is the use of interest rates and money supply changes to manage the overall level of demand in the economy and, therefore, help achieve the economic objectives set out in previous sections. For examinations you will need to show how monetary policy is used to achieve macroeconomic objectives. So, think about how monetary policy is used to:
- Control inflation
- Help produce growth
- Keep employment as high as possible
- Maintain a satisfactory balance of payments
Interest rate determination and the role of a central bank
The responsibility for monetary policy will rest with the government and/or the central bank. Some countries (e.g. the UK and New Zealand) have made their central banks fully independent of government. The bank is then given an inflation target and they set interest rates to keep to that target. In the case of the Eurozone (all the EU countries who use the euro - the single European currency), this responsibility for monetary policy rests with the European Central Bank, which sets a single interest rate for the whole Eurozone.

Case study - The role of a Central Bank

Now visit the website of the Norges Bank at http://www.norges-bank.no/en/about/
- Identify who owns Norges Bank.
- Describe the main functions and responsibilities of the Norges bank and, for each function, briefly explain how Norges Bank carries out this function.
- Use the internet to identify who is responsible for monetary policy (setting interest rates) in your country. Is it the government or the central bank? If it is the central bank - is it independent? Find figures for how interest rates have changed in recent years.
Interest rate determination
If you would prefer to view this interaction in a new web window, then please follow the link below:
How can the Central Bank increase the supply of money?
This is a complicated topic, because there are many different measures of money; each differing according which assets are actually considered to be 'money'. Money in its most liquid form consists of cash and is demanded as a medium of exchange for transactionary purposes, in other words for buying things. However, other more illiquid assets, such as short-term government securities, treasury bills and long dated government securities are often considered to be money from the commercial banks point of view.
The most straightforward way for Central Banks to increase the money supply is to either:
- Print more cash to finance government spending which is then passed on in the circular flow of income, or
- Sell short-term securities such as treasury bills to commercial banks, which then use these as the basis for creating credit and lending out more to their customers.
Case study

Read the article ECB hikes interest rates as UK rates remain at record low and then answer the questions that follow. (You can read the article in the web window below, or follow the previous link to read the article in a new web window)

- Identify the reasons whythe European Central Bank is increasing its interest rates.
- Explain, why is the UK's Bank of England is keeping its base interest rates at a 28 month all-time low of 0.5%.
- Describe what is meant by the Bank of England's base rate (you might have to do some research here).
- Explain whythere is pressure from some quarters for the Bank of England to increase its base rate.
Monetary policy and short term demand management
Expansionary monetary policy
Governments may choose to use expansionary (loose) monetary policy in times of recession or a general downturn in economic activity. This was in widespread use by many governments following the financial crisis on 2008. In this situation, governmentsuse monetary policy to stimulate the economy. They may do this by lowering interest rates or by increasing the money supply. Following the 2008 credit crunch, periods of Quantitative Easing (Q.E.) took place where governments increased the money supply by purchasing assets of longer maturity than only short-term government bonds with the objective of lowering longer-term interest rates.
Lowering interest rates encourage firms and individuals to borrow and spend more. Increasing the money supply into the national income will similarly increase spending. Either way, the level of demand in the economy should rise and help encourage economic growth.
Reflationary monetary policies include:
- Lowering interest rates
- Increasing money supply
Thesepolicies should boost aggregate demand and, therefore, the equilibrium level of income. This can be seen in Figure 1 below.

Figure 1 Reflationary monetary policy
However, this policy may cause demand-pull inflation. We can see from Figure 1, that there has been an increase in the price level from P1 to P2. Keynesians would differ slightly with this view and argue that reflationary monetary policy sometime referred to as a loosening or easing of monetary policy, is appropriate where there is spare capacity, as they believe that the economy can settle at any equilibrium level of output. Their view of reflationary policy can be seen in Figure 2 below.

Figure 2 Reflationary fiscal policy - Keynesian analysis
For Keynesians, any increase in AD on the horizontal section of the AS curve will not be inflationary. Prices will only increase when full employment is reached and the AS curve becomes vertical.
Monetarists, sometimes referred to as neo-classicalists would take a very different view. They would argue that increasing the money supply, either directly by printing more money, or indirectly by expanding commercial banks capacity to lend more, would feed through into increases in aggregate demand. They believe that the long-run supply curve (LRAS) is vertical and hence increases in aggregate demand would have no effect on output in the long run, but simply result in prices being pushed up through demand-pull inflation.
Figure 3 Reflationary monetary policy - Classical analysis
Contractionary monetary policy
 Contractionary (tight) montary policy is likely to be most appropriate in times of economic boom. If the economy is operating at full capacity, further increases in aggregate demand will result in inflation and potential balance of payments problems. In an attempt to slow economic growth and control inflation, the government could increase interest rates and/or reduce the money supply. Either, or both of these policies, will reduce the level of demand in the economy and the level of economic growth.
Contractionary (tight) monetary policies include:
- Increasing interest rates
- Reducing the money supply
The effect of these policies will be to shift the aggregate demand curve from AD1 to AD2, as in Figure 3 below.

Figure 3 Deflationary fiscal policy
Both Monetarists and Keynesians maintain that raising interest rates or reducing the supply of money will lower aggregate demand and close an inflationary gap. Keynesians would argue that such actions may overshoot and cause a deflationary situation, with rising unemployment. They have traditionally argued that reducing the money supply may not always be effective. Indeed, any attempt to control the money supply may only speed up the velocity of circulation, to fund spending. In other words, the existing stock of money will simply be used more frequently and changes hands at a quickening rate.
The analogy of the balloon
To help imagine how these policies work, think of the economy as a balloon. The air in the balloon is the level of demand or economic activity. If the balloon is a little low and short of air, you want to reflate it; if it is over-expanded and in danger of bursting, then you deflate it.
This is similar to the economy. However, when an economy over-expands, instead of bursting, it suffers from other problems including higher inflation and a deteriorating balance of payments. Supply-side policies are policies that manage the capacity of the balloon: making it bigger so it can take more air or making the balloon material more 'stretchy', so it can expand further.

Contractionary Policies (Reducing aggregate demand)
Tight Fiscal Policy
- reducing governments spending
- Increasing taxation
Tight Monetary Policy
- Increase interest rates
- Reduce money supply

Expansionary Policies (Increasing Aggregate Demand)
Loose Fiscal Policy
- increasing government spending
- reducing taxation
Loose monetary policy
- decreasing interest rates
- increasing the money supply
Interest rate changes & Aggregate Demand
 The impact of changes in interest rate on Aggregate Demand
Interest rate changes will affect aggregate demand. For example, if interest rates rise, the impact on aggregate demand will be:
- Consumption - if interest rates are increased then consumers will find that their disposable income is lower (because debt repayments and mortgage repayments will be higher) and they will be less likely to borrow as it is more expensive. This will reduce their consumption. Higher interest rates also make saving more attractive than consuming.
- Investment - higher interest rates will make investment less attractive, as the cost of borrowing and the returns are relatively lower.
- Government expenditure - government also often borrow large amounts of money and if interest rates rise then they will face higher 'debt servicing' costs (higher interest payments).
- Exports and imports - an increase in interest rates may lead to a rise in the exchange rate and this will make exports less price competitive. Exports may fall and imports may rise. However, an increase in interest rates may reduce the overall level of demand and thus the demand for imports in particular.
The aim of monetary policy is generally to manage the economy without causing sudden increases in either inflation or unemployment. Price stability is now central to macroeconomic policy, although following the financial crisis in 2008, and the resultant recession, some governments appear to be prepared to allow inflationary pressures to build (following cost push pressures from increase in commodity prices) and adopt expansionary fiscal and monetary policies in an attempt to avoid a recurring recessions and depressions. Many governments borrowed large amounts to finance expansionary policies in response to the credit crunch and are now having to make large cuts in their government spending in order to pay back the debts incurred.
A successful monetary policy allows for price stability and maximum employment. It should also allow supply-side policies to work. This will be covered in the next section 2.6
Monetary policy and inflation targeting
Many countries opt not to aim to achieve full employments or low levels of inflation. Rather, the decisions relating to the monetary policy of their Central Banks are guided by establishing explicit or implicit targets for inflation.
Let's revisit the Norwegian Central Bank, the Norges Bank, to consider what this means. The bank operate a system of flexible inflation targeting. Their annual report for 2010 explained it as follows
Flexible inflation targeting
Norges Bank operates a flexible inflation targeting regime, so that smoothing fluctuations, both in inflation and in output and employment, is given weight in interest rate setting. Flexible inflation targeting builds a bridge between the long-term objective of monetary policy, which is to keep inflation low and anchor inflation expectations, and the objective of smoothing developments in output. Expectations regarding future interest rates play an important role for developments in output, employment, incomes and inflation. Through its interest rate forecasts, Norges Bank influences the interest rate expectations of market participants, enterprises and households.
Interest rate forecasts should satisfy the following main criteria:
- The interest rate should be set with a view to stabilising inflation at target or bringing it back to target after a deviation has occurred. The relevant time horizon will depend on the type of disturbances to which the economy is exposed and their effect on the path for inflation and the real economy ahead.
- The interest rate path should, at the same time, provide a reasonable balance between the path for inflation and the path for overall capacity utilisation in the economy.
In the assessment, potential effects of asset prices, such as property prices, equity prices, and the krone exchange rate on stability in output, employment and inflation are also taken into account.
Assuming the criteria above have been satisfied, the following additional criteria are useful:
- Interest rate adjustments should normally be gradual and consistent with the Bank's previous response pattern.
- Interest rate developments should result in acceptable developments in inflation and output also under alternative assumptions concerning the economic situation and the functioning of the economy. Any substantial and systematic deviations from simple, robust monetary policy rules should be explained.
- The interest rate forecast is an expression of Norges Bank's overall judgement and assessment based on the criteria above. Usually, the criteria cannot all be satisfied simultaneously, and the various considerations must therefore be weighed against each other. Forecasts of the key policy rate and other economic variables are based on incomplete information concerning the economic situation and the functioning of the economy. Should developments in the economy differ from assumptions or should the central bank change its view of the functioning of the economy, developments in the interest rate and other variables may deviate from the forecasts.
Source: Taken from Norges Bank Annual Report 2010 http://www.norges-bank.no/Upload/82632/activities.pdf

Task
Visit the websites of a selection of central banks, including that of Norges Bank, and determine whether the Central Government has identified an explicit inflation target. Once you have done this, complete the following table:
| Country | Name of Central Bank | Inflation target | Interest rate |
|---|---|---|---|
| | | |||
| | | |||
| | | |||
| | | |||
| | |

The websites of many of the world's Central Banks can be found here:
Evaluation of monetary policy
If you would prefer to view this interaction in a new web window, then please follow the link below:
Case Study - The Credit Crunch

The late-2000s witnessed a financial crisis (often called the 'Credit Crunch' that resulted in the collapse of large financial institutions, the bailout of banks by national governments, declines in national housing markets and collapses in the institutions that financed house purchase, failures in businesses, increased unemployment, declines in consumer wealth, downturns in stock markets around the world, decline in economic activity and global recession in 2008.
Read the following article, Credit crunch: A sickness in the heart of Britain, and watch the two videos below and then consider the questions below.

Watch the following two video clips.
Video (1) - The credit crunch explained
Video (2) - Quantitative easing

- Examine the causes of the credit crunch. Specifically address the role of the US property market in the crisis.
- Explain why the crisis in the US property market spread to banks outside the US.
- Examine the factors that lead to a recessionary situation in 2008 following the bank crisis.
- Identify the characteristics of the recession in the UK.
- Describe how did the governments of affected countries reacted to the recession.
- To what extent do you consider that the policies introduced were effective in promoting a recovery? Identify the economic costs associated with these policies.
2.5 Monetary Policy (questions)
In this section are a series of questions on the topic - monetary policy. The questions may include various types of questions. For example:
- Short-answer questions - a series of short-answer questions to help you check your understanding of the topic
- Case studies - questions based around a variety of information
- Long answer - questions requiring an extended/essay type response
- Data response - responding to data or topical economics news articles
Click on the right arrow at the top or bottom of the page to work through the questions.
Self-test questions

1 |
Interest ratesWhich is the most likely to occur if interest rates are increased? |
2 |
Rising interest ratesIf interest rates were to rise the impact on consumption would be: |
3 |
Rising interest ratesIf interest rates were to rise the impact on consumption would be: |
4 |
Government policiesMatch the examples of government policy given to the appropriate type. |
5 |
Government policiesMatch the examples of government policy given to the appropriate type. |
6 |
Inflation policyWhich of the following would be an acceptable policy to reduce the inflation rate? |
7 |
Inflation policyWhich policy is mainly used in the UK to control inflation? |
Short questions

Question 1
Explain the possible effects of an increase in interest rates.
Question 2
Distinguish between the nominal rate of interest and the real rate of interest.
Question 3
Distinguish between monetary and fiscal policy.
Question 4
Explain the link between an increase in the money supply lead to and an increase in interest rates.
Question 5
Distinguish between tight (contractionary) and loose (expansionary) monetary policy
Question 6
Describe the process of quantitative easing.
Question 7
Describe the role of the Central Bank.
Question 8
Explain how a government can use monetary policy to expand aggregate demand.
Data response (1)
Read the article China to raise interest rates again and then answer the questions below. (You can read the article in the web window below, or follow the previous link to read the article in a new web window)

Question 1
Explain what is meant by monetary policy.
Question 2
Identify examples of monetary policy used by the Chinese government and explain the desired outcomes.
Question 3
Evaluate the effects of the monetary policy measures the Chinese government is using on output, employment, prices and incomes.
Data response (2)
Read the article After the flood and then consider answers to the questions below. (You can either read the article in the window below or you can follow the previous link to read the article in a separate window).

Question 1
Explain what is meant by tight and loose monetary policy
Question 2
Identify the main features of Japanese monetary policy in recent years and explain the reasons for recent changes.
Question 3
Analyse the impact of these changes in monetary policy on the main Japanese macroeconomic targets.
Question 4
The Bank of Japan defines price stability as "a state where the change in the price index is zero". Examine the advantages and disadvantages of setting a zero target rate.
Long questions

Question 1
(a) Distinguish between monetary and fiscal policy.
(b) Using the appropriate aggregate demand and supply diagrams, and specific examples, evaluate the effect of loosening monetary policy on the economy of a country.
Question 2
Analyse the policy options available to a government that is experiencing both moderate levels of unemployment and inflation.
Section 2.6 Supply-side policies (notes)
In the previous section we considered the level of overall economic activity, examined the concepts of aggregate demand and aggregate supply and looked at the role of macroeconomic objectives in the development of government policies and the operation of fiscal and monetary policy.
In this section we examine supply-side policies. By the end of this section you should be able to:

- Explain that supply-side policies aim at positively affecting the production side of an economy by improving the institutional framework and the capacity to produce (that is, by changing the quantity and/or quality of factors of production).
- State that supply-side policies may be market-based or interventionist, and that in either case they aim to shift the LRAS curve to the right, achieving growth in potential output.
- Explain how investment in education and training will raise the levels of human capital and have a short-term impact on aggregate demand, but more importantly will increase LRAS.
- Explain how policies that encourage research and development will have a short-term impact on aggregate demand, but more importantly will result in new technologies and will increase LRAS.
- Explain how increased and improved infrastructure will have a short-term impact on aggregate demand, but more importantly will increase LRAS.
- Explain that targeting specific industries through policies including tax cuts, tax allowances and subsidized lending promotes growth in key areas of the economy and will have a short-term impact on aggregate demand but, more importantly, will increase LRAS.
- Explain how factors including deregulation, privatization, trade liberalization and antimonopoly regulation are used to encourage competition.
- Explain how factors including reducing the power of labour unions, reducing unemployment benefits and abolishing minimum wages are used to make the labour market more flexible (more responsive to supply and demand).
- Explain how factors including personal income tax cuts are used to increase the incentive to work, and how cuts in business tax and capital gains tax are used to increase the incentive to invest.
- Evaluate the effectiveness of supply-side policies through consideration of factors including time lags, the ability to create employment, the ability to reduce inflationary pressure, the impact on economic growth, the impact on the government budget, the effect on equity, and the effect on the environment.
Supply-side policies - introduction
 In this section we consider the following topics in detail:
- The role of supply-side policies
- Interventionist supply-side policies
- Market based supply-side policies
- Evaluation of supply-side policies
The history of supply-side policy
From 1945 until the mid-1970s, Keynesian fiscal policy (influencing aggregate demand levels) was the major instrument of government economic policy in most countries around the world. The Phillips curve represented the observed inverse relationship between the rate of unemployment and the rate of inflation in an economy, which had been recorded historically. In other words, the lower the level of unemployment in an economy, the higher the rate of inflation (and vice-versa). This observed relationship had underpinned many governments' macroeconomic policies since the 1950s. However, while this trade off appeared to exist in the short-run, the relationship broke down in the long-run. In the early 1970s, 'stagflation', or 'slumpflation' occurred in many countries, which was the simultaneous increase in both prices and unemployment; a situation that Keynesian economists believed was not possible. As a result, the use of monetary policy to achieve macroeconomic goals became widespread, and has dominated government policies in major economies since the 1970s. The 'radical right', or monetarists, in the USA particularly (although similar moves were happening in Europe), suggested that concentration on the demand-side of the economy was untenable and that governments should focus instead on the use supply-side policies to create greater flexibility in the economy to react to changes in aggregate demand. Monetarist policies became to dominate government economic approaches in most developed economies with a growing importance placed on the use of interest rates to fine tune economic development. The debate moved away from Keynesian policies to arguments over the nature of about supply-side policies and whether these should be more or less interventionist in nature as both liberals and conservatives embraced policy measures focusing on increasing aggregate supply.
However, it should be noted that many governments reacted to the financial crisis of 2007 - 2010, by using traditional Keynesian approaches to stimulate aggregate demand, in face of opposition from Monetarists who saw these policies as inevitably inflationary in the longer-term.

Read the following articles and reflect on the reaction of governments around the world to the financial crisis of 2007-2010, and why did so many governments revert to policies that appear to be Keynesian in nature?
The role of supply-side policies
Supply-side policies are designed to make aggregate supply (AS) more responsive to changes in national income. Supply-side policies tend to concentrate on improving efficiencies in either product markets, i.e. specific good or services such as cars, or labour markets. Supply-side policies are designed to increase competition and efficiency of production by improving the quality and quantity of labour available to firms. When combined with other macro policies, they are supposed to deliver a more competitive and efficient economy.
Supply-side policies focus on:
- Removing market imperfections - barriers to the smooth operation of product and labour markets
- Removing restrictive practices - rules that do not allow the free movement of factors within an economy
- Making work more attractive
- Making workers more efficient
Supply-side policies aim to shift the LRAS curve to the right, increasing the level of real output and lowering the price level. This is shown in Figure 1 below:
Figure 1 Supply-side policies - LRAS shifts
Supply-side policies were initially advocated only by free-market oriented economists and politicians. However, policies designed to affect the aggregate supply of goods and services are now embraced by those in favour of a more interventionist approach. It may, therefore, be better to think of supply-side policies in terms of being either market based or interventionist.
Interventionist supply-side policies
If you would prefer to view this interaction in a new web window, then please follow the link below:
The supply-side - case study


Read the article:
Now read the following article taken from the UK's Daily Telegraph:

Answer the following questions:
- Having read both articles, explain why the governments of South Korea and the UK are investing in the respective sectors of the economy?
- Explain why the private sector does not provide all the necessary investment and analyse the possible risks if it did.
- Examine the economic consequences of a government not investing in the technical infrastructure of the country.
Market based supply-side policies
If you would prefer to view this interaction in a new web window, then please follow the link below:
Market-based supply-side policies - case study (1)


Watch the following video on the state of the Indian economy prior to the introduction of liberalization policies in the 1990s

Read the Washington Post article Air India strike sparks debate over privatization considering the case of privatization in India. (You can read the article in the web window below, or follow the previous link to read the article in a new web window)

Answer the following questions:
- Identify the areas of production highlighted by the video as important if the productive efficiency and the supply-side of the Indian economy is to be improved.
- Examine the problems highlighted by the article associated with government owning and controlling business.
- Describe the supply-side policy measures to improve efficiency advocated by some sectors of the India media. Analyse the economic arguments for, and against, such measures.
Evaluation of supply-side policy
 Supply-side policies - strengths
Supply-side policies may be targeted at particular sections of the economy raising efficiency there. Successful application for the economy, as a whole, will shift the LRAS to the right, increasing the level of real output and lowering the price level.
Achievement of the major macro-economic goals of economic policy may be achieved if LRAS is shifted to the right. Such a shift:
- Represents an increase in the productive potential of the economy (economic growth)
- Will lower the price level (thus helping to reduce inflation)
- Will increase the level of real output and, more than likely, the level of employment as the two are closely correlated.
- Will help to improve the balance of payments if the improved efficiency represented by greater LRAS transmits itself through to increased competitiveness for firms engaged in exporting.
Policies that cut the rate of income tax, in addition to increasing the incentive to work and to be entrepreneurial are considered by some economists to lead to an increase in tax revenue. As employment and incomes increase they generate more tax revenue, albeit with lower tax rates. This is demonstrated by the Laffer curve. However, there is some dispute as to the precise rate of tax which maximizes potential tax revenue.
If you would prefer to view this interaction in a new web window, then please follow the link below:
More interventionist supply-side policies may, in addition to increasing productive efficiencies, have the effect of injecting money into the circular flow of income and setting up a multiplier process leading to an increase in output, employment and income. The benefits, or otherwise, of this expansionary fiscal effect can be further considered by reviewing Section 2.4.
Supply-side policies - weaknesses
As we have seen, whilst some supply-side policies represent a more interventionist approach, most supply-side policies are associated with neo-classical, free market or supply-side economists. There is considerable disagreement between free market economists and economists, who favour an interventionist approach, as to how best the economy should be managed.
Some interventionist objections to particular free market oriented supply-side policies are as follows:
- Education and training - few would disagree with the wisdom of committing government spending to these areas, but such expenditure may be insufficient in itself to guarantee permanent jobs without ensuring an adequate level of aggregate demand in the economy; in supply-side policies they need to be accompanied by appropriate fiscal and/or monetary policies.
- Reduction in unemployment benefits - apart from the economic objection, that such a policy would lower the spending power of such recipients and therefore reduce aggregate demand, output and employment, such a policy can be questioned on moral and political grounds. Is it right to make a group of people who are likely to be amongst the poorest in society, even poorer, while at the same time making the rich richer through tax cuts? Moreover, the idea that 'taking a stick' to the unemployed to force them back to work, presupposes that all unemployment is of a voluntary nature. In practice, people may be involuntarily unemployed, due to lack of demand in the economy or as the result of scarce employment opportunities in their geographic area.
- Reduction in direct taxes - while low income individuals and families are given the 'stick' to improve their incentives (via cuts in welfare benefits), the better-off are given the 'carrot' in the form of tax cuts. Apart from the morality of such policies, which make life more unpleasant for the least fortunate and make society more unequal, the alleged incentive effects of lower taxes have little empirical basis. A number of studies have shown that cutting income tax does not make people work harder and longer; with a minority being fully aware of the reality of their marginal tax rate. Indeed, it has been found that lower taxes may encourage some employees to take more leisure time as they can now gain the same disposable income by working fewer hours.
- Reduction in the power of trade unions - for those economists who are not of the free market persuasion, this is simply viewed as another measure to shift wealth, income and the balance of power away from the less well-off to the better-off. The individual employee is always weaker than the individual employer, especially where the employer is a large multinational corporation, and trade unions act as a counterbalance to those unequal power relations. Trade unions may reduce the firm's costs by acting as a channel for communication between employers and employees - it is likely to be cheaper for the firm to negotiate with one organisation through 'collective bargaining', rather than employers talking with individual employees.
- Deregulation - over recent years the world financial system has been largely deregulated with a 'free' market being largely establishedThis lack of regulation that has widely been blamed for the recent credit crunch and the world - wide economic crisis that followed. It is only the subsequent government intervention, in the form of nationalisation and re-regulation that avoided total economic melt-down.
- Privatisation - this has been at the heart of supply-side, free market economies since the early 1980s and has been a central component of the structural adjustment programmes imposed on less developed countries by the IMF and the World Bank. Click on QUOTES to get a flavour of the degree of opposition privatisation has caused.
In particular, privatisation has been criticised on the following grounds:
- Political arguments - for those who believe that socialism represents a superior form of society to capitalism, the movement towards privatisation of the means of production will inevitably lead to greater class conflict, greater exploitation of workers and a more unequal and unfair society in general.
- Management of the economy - a privatised laissez-faire economy, as opposed to one with varying degrees of government control, is likely to be particularly prone to the vagaries of the market, the violent swings of the trade cycle and the movement in an out of the country of speculative capital flows.
- Natural monopolies - the case against the privatisation of utility industries such as gas, water and electricity rests upon the enormous potential for private monopoly abuse in terms of high prices, poor quality service for consumers, worsened conditions and redundancies for employees, with high dividends for shareholders and high salaries for senior managers (the 'fat cat' syndrome).
- Fraud - while claiming that 'popular capitalism' has returned industries to the public, the opposite has been the case. When an industry is nationalised, in theory it is jointly owned by everyone in the country. Privatisation, therefore, represents a process of selling shares or assets to people, who may already own those assets, a confidence trick which if carried out by any individual would carry a stiff custodial sentence! At the same time, those individuals, who are either unable or unwilling to purchase shares are, in effect compelled to relinquish their assets.
- Deregulation - this has also been a central plank of supply-side policy and its advantages are based on the general arguments for a freely operating price system, e.g. the promotion of competition and enterprise, greater efficiency, lower prices and wider choice for consumers and 'getting the state of the backs' of businesses by the removal of 'red tape' and bureaucracy. However, like privatisation, it has been fiercely criticised. Follow the criticisms of deregulation link to see these.
2.6 Supply-side policies (questions)
In this section are a series of questions on the topic - supply-side policies. The questions may include various types of questions. For example:
- Short-answer questions - a series of short-answer questions to help you check your understanding of the topic
- Case studies - questions based around a variety of information
- Long answer - questions requiring an extended/essay type response
- Data response - responding to data or topical economics news articles
Click on the right arrow at the top or bottom of the page to work through the questions.
Self-test questions

1 |
Supply-side policiesWhich of the following is NOT something on which supply-side policies are normally focused? |
2 |
Supply-side policiesWhich of the following would be considered supply-side policies? Tick all answers that are correct. |
Short questions

Question 1
Describe the aims of supply-side policies.
Question 2
Explain why has 'privatisation' become such a popular economic policy and examine the problems it may have caused.
Question 3
Outline the major supply-side policies, which could be used by a government.
Question 4
Discuss the extent to which supply-side policies have been successful in improving the performance of an economy with which you are familiar.
Question 5
Identify two possible disadvantages which might arise from the privatisation of a nationalised postal service.
Data response (1)
Read the article Kaliningrad erases stains of past and then answer the questions below. You can either read the article in the window below or you can follow the previous link to read the article in a separate window.

Question 1
Define the term economic growth.
Question 2
Identify the main determinants of the increase in the rate of economic growth in Kaliningrad.
Question 3
Explain the policies that the government is putting in place to maintain economic growth.
Question 4
Examine whether the policies being put in place can be considered supply-side policies.
Question 5
Discuss the likely principal constraints on the long-term rate of economic growth in Kaliningrad.
Data response (2)
Read the article Protecting the silent majority - and the Royal Wedding and then answer the questions below. (You can read the article in the web window below, or follow the previous link to read the article in a new web window)

Question 1
Explain what are meant by supply-side policies.
Question 2
Using appropriate diagrams to support your analysis, explain how supply-side policies can increase output, employment and income.
Question 3
Explain how supply-side policies that reform labour markets can increase output, employment and income.
Question 4
Discuss the potential hazards of introducing labour market supply-side policies, such as those described in the article.
Long questions

Question 1
(a) Distinguish between market based and interventionist supply-side policies.
(b) Using specific examples and diagrams where appropriate, analyse the costs and benefits to the economy of the government implementing a market based approach to supply-side policy.
Question 2
(a) Explain why the shape of the aggregate supply curve may differ in the short and long run.
(b) Evaluate the extent to which supply-side policy attempts is effective in influencing output, employment and income in the long run.