Example 2 - the market for fish

 Let's look at another example, and make sure that you understand how the shifts and movements occur and interact. Now work through the following changes, and adjust the diagram as you go. After you have had a go at each change, follow the answer link below and see if you made the right changes.
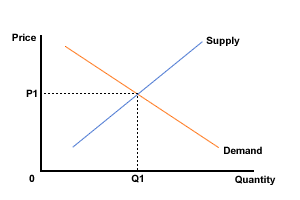
Figure 1 represents the market for fish at the start of a week. Assume that all demand and supply changes occur without delay, i.e. they react instantly. The changes given are all sequential. In other words use the diagram you end up with as the starting point for the next change.

Figure 1 The Market for fish
Change 1. There are very rough seas and small boats cannot fish.
Change 1 - answer
Change 2. It is Thursday, a day where the demand for fish is very high. Seas become even rougher and even fewer boats can go to sea.
Change 2 - answer
Change 3. It is Friday, when demand for fish is even higher. Storms weaken, though, and fishing becomes easier.
Change 3 - answer
In this example, we have seen price rises accompanied by an increase in sales. This does not mean that the rules of price and demand are wrong, just that in such cases there will have been changes in the determinants, other than price, of supply and demand. Be careful to separate shifts from movements. Notice that movements along a demand curve come as the result of movements (shifts) of supply.
