Example - shifts and movements along a demand curve
You must be absolutely certain about what causes shifts and movements along a demand curve. Work carefully through the following example.

Example 1 - Movements along and shifts of demand curve
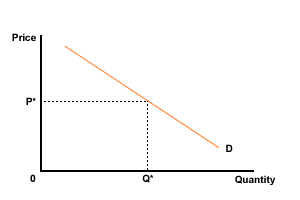
The diagram below, Figure 1, represents the demand for a product at a point in time. The price then was P*.

Figure 1 Demand curve
Copy this onto another piece of paper, then sketch on this new diagram the effect of the following changes. Treat each change as a separate change - in other words start each time from Figure 1. Once you have had a go at each one then follow the link below to check you got the change right.
(a) The firm launches a new, effective advertising campaign.
Answer - change (a)
(b) The market price of the product rises to P2.
Answer - change (b)
(c) The price of a substitute good is reduced.
Answer - part (c)
(d) The price of a good falls from P1 to P2.
Answer - part (d)
(e) The real incomes of the buyers of this desirable product increase significantly.
Answer - part (e)
(f) There is an increase in the population size and the size of the potential market.
Answer - part (f)
These should not be difficult if you keep calm. Ask yourself three questions:
- Has a 'ceteris paribus' factor (or another determinant of demand other than the price of the good itself) changed? If the answer is yes, then there is a shift.
- Will demand increase or decrease? This will determine if the shift is to the right or left?
- If the price has changed, will there be an extension or contraction of demand?
