Shifts and moves of supply curve
You must be absolutely certain about what causes shifts along or movements of a supply curve. Work carefully through the following example.

Example 1
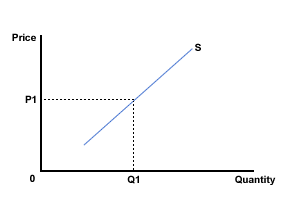
The diagram below, Figure 1, represents the supply of a product (X) at a point in time. The price then was P1 and the quantity supplied Q1.

Figure 1 The supply of Product X
Copy this onto another piece of paper, then sketch on this new diagram the effect of the following changes. Treat each change as a separate change - in other words start each time from Figure 1. Once you have had a go at each one then follow the link below to check you got the change right.
(a) Market price of the product falls from P1 to P2.
Answer - part (a)
(b) The government passes new minimum wage legislation, which will have the effect of increasing the cost of labour to the firm (an increase in costs of production).
Answer - part (b)
(c) The government places a tax on the sale of the product.
Answer - part (c)
(d) A new and highly efficient production process has been developed for a good.
Answer - part (d)
(e) Producers in a market can easily produce two products - chocolate chip cookies and chocolate coated cookies. The market for chocolate coated cookies has considerably declined. Producers decide to supply more chocolate chip cookies to the market instead.
Answer - part (e)
This should not be too difficult if you keep calm. Ask yourself three questions:
- Has a ceteris paribus factor changed - in which case the curve will shift?
- Will supply increase or decrease?
- If price has changed will there be an extension or contraction of demand?
