Costs and revenue - shape of cost curves
Figure 1 below shows how average costs change as output increases. As you can see from the diagram, average cost falls as the firm increases its output and moves towards its capacity.
What determines the actual shape of this cost curve?
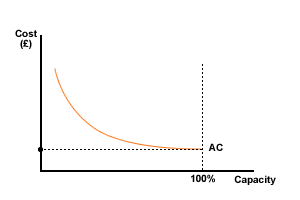
Figure 1 Average cost curve
The answer is the distribution between fixed and variable costs. Let's examine two situations - where fixed costs are a very high proportion of total costs, and where they are a low proportion.
Fixed costs are a high proportion of total costs
This type of firm would be described as being capital-intensive. A good example is a scheduled airline where most costs are fixed, at least in the short to medium term. It would have a cost curve as follows:
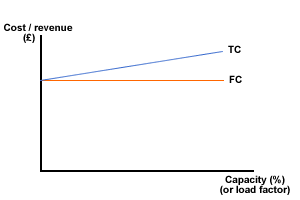
Figure 2 Total costs - capital-intensive firm
Total costs would vary little with changes in capacity, but average costs, however, would be very sensitive to output. Look at the diagram below:
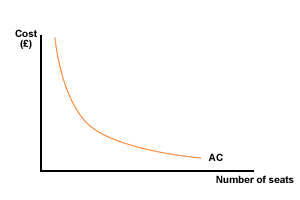
Figure 3 Average cost - capital-intensive firm
Average costs would change significantly as the numbers of passengers increase or decrease. Profits or losses would be very sensitive to capacity; in other words the number of seats sold.
Fixed costs are a low proportion of total costs
This is the reverse of the above. Any such firm would be considered to be labour-intensive. An example would be a market stall selling fruit and vegetables. Its cost curves are as follows:
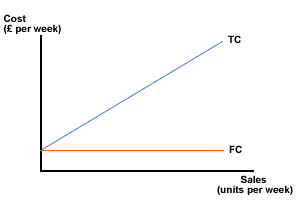
Figure 4 Total cost - labour-intensive firm
Costs vary considerably with output, or capacity. The average cost curve now is very different to that of a capital-intensive firm. Look below:
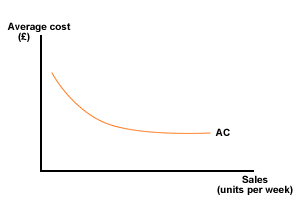
Figure 5 Average cost curve - labour intensive firm
Average costs are less sensitive to changes in output.
