Traditional approaches to stock control

Large stocks increase the possibility of the firm experiencing cash flow problems; stock-control charts are used to monitor a firm's stock position with the objective of avoiding this. These stock charts include details on stock levels, usage rates, order quantities and delivery times. A typical stock shows the following:
- Minimum stock holding. This is the minimum level of stocks that a firm aims to hold under normal conditions. This is sometimes known as the buffer stock level. It is there to absorb 'shocks' and act as a contingency stock should things go wrong with delivery or there is unexpected demand. Again firms will wish to minimise the level of the buffer stock as this is tied-up capital, but must balance the cost of this against the cost of a having to shut production down.
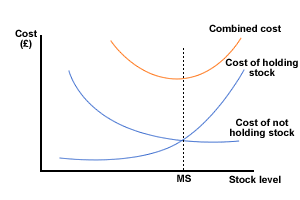
- Economic order quantity (EOQ). Firms can order a large amount infrequently or small quantities very frequently. Purchasing managers may wish to order large quantities to gain the highest possible discounts, but these discounts will be offset by the high costs of stock-holding. There is an optimum level, however and stock managers need to work this out. It will depend on the cost of deliveries and the nature of the stocks themselves. The EOQ will differ from product to product e.g. bulky goods tend to be delivered in larger quantities to keep the cost of delivery down. The optimum stock level will be at the lowest point of the total stock cost graph, which is the combination of the cost of holding stock and the cost of not holding stock and is shown in Figure 1 below.

Figure 1 Minimum stock level

Economic order quantity (EOQ)
The stock re-order method, which attempts to calculate the optimum order quantity of a specific product by balancing the conflicting costs of holding stock and delivery of replenishment stocks.
- Planned usage rate. Firms must record how much stock is used over a given time period. Although this may not be consistent over a year, there are often predictable variations in demand patterns caused by seasonal patterns and spikes in demand during holidays and festivals. These need to be built into any forecasting process.
- Lead time/delivery time. The time it takes to place and receive an order. It includes all the time it takes the firm to get the order to the supplier, as well as the supplier's delivery time.
- Re-order level. This is the level of stock at which the firm will have to reorder to ensure they have sufficient stock to stay above their minimum stockholding. This level takes the lead time into account.

