PlotIT - Profit maximisation
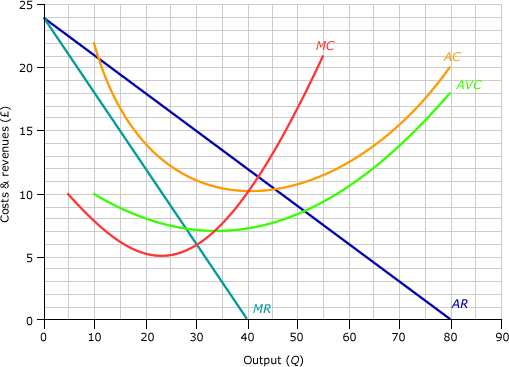
As we saw earlier, profit maximisation will occur for a firm where MC=MR. The following diagram shows the costs and revenues for a product Y over a range of output from zero to 80 units per week. Product Y is one of many products produced by the firm. The fixed costs associated with producing Y are £120 per week, £60 of which is normal profit.

What happens when the demand for a firm's product changes? How will this affect the profit maximising price and output? The following diagram is the same as the one above. It shows the cost and revenue curves for firm X in the production of good Y.
Now assume that a close competitor of product Y has dropped the price of its product. As a result demand for product Y changes by 15 units per week.
In the diagram below, click on the two points in turn where the new AR curve strikes the axes. Then do the same for the MR curve.
You may like to check your answer.

1 |
