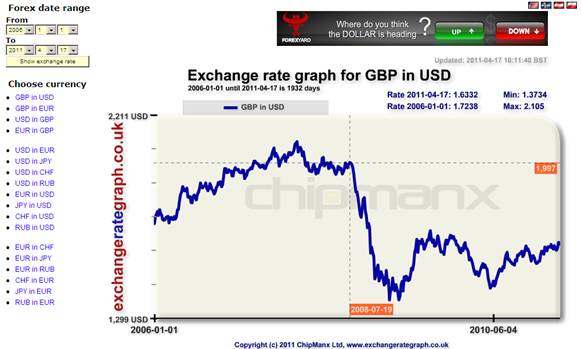
Pound takes a dive

There are a number of excellent websites you can access to provide exchange rate graphs. The graph above shows the pound in US dollars from 2006 to 2011. With this particular site, you can set the currencies and dates required, and then move your cursor along the graph to read off the date and exchange rate.

Question 1
Referring to the graph above, describe the change in GBP / USD exchange rate in the months following July 2008.
Question 2
Analyse the likely impact of this change in value of the pound on the major UK economic targets.
Question 3
Select two policies the UK government can use to influence the value of sterling against the dollar and evaluate their likely success.
