Moving average
The nature of the latest business and management programme and the nature of the papers means that this has proved a less popular question than in earlier programmes as the calculations can be quite time consuming leaving little time to analyse or evaluate.
A moving average is used to 'smooth' the data and remove the variations produced by seasons, trade cycles and random variations. There are a number of moving averages that can be used, with the following being the most common.
- Three-point average
- Four-point moving average.
Three-point moving average:
This is by far the easiest and quickest moving average to calculate, but it does not completely smooth the trend line and so makes accurate extrapolation more difficult.
Three-point averages are calculated by taking a number in the series with the previous and next numbers and averaging the three of them.

| Series: Actual sales |
| 2080 |
| 1200 |
| 1520 |
| 2560 |
| 2160 |
| 2000 |
The underlying trend in the series above is not clear because of the variations within the data. If we calculate a moving average, however, we are able to remove some of these variations.

For any series of numbers you are able to calculate 2 less three-point moving averages than there are numbers in the series because:
- the first number does not have a previous number
- the last number does not have a next number
Moving Average (1): take the first three figures in the series and average them:
![]()
Moving Average (2): drop the first figure from the front and add in the next in the series
![]()
Moving Average (3): continue to use the next set of three figures in the series
![]()
Moving Average (4): continue to use the next set of three figures in the series
![]()
So from a set of six sales figures, we have produced 4 three point moving average calculations:
1600
1760
2080
2240
From these results the trend has become obvious - it shows that the trend is positive and there is sales growth.
Three point moving averages are also useful in working out the average variations across a longer period. This is because the average of three numbers falls on the middle of the series and so can be compared directly with the actual sales for that period
|
Series: Actual sales |
Trend (3-point) Sales |
Variation Sales - Trend |
| 2080 | ||
| 1200 | 1600 | -400 |
| 1520 | 1760 | -240 |
| 2560 | 2080 | +480 |
| 2160 | 2240 | -80 |
| 2000 |
If these variations are seasonal or cyclical they can be used to predict actual sales by adjusting the extrapolated future sales to take account of the predictable variation. In the example above we can see that the trend sales are NEVER equal to the actual sales and so could not be used to plan future production for instance without further analysis. The trend on its own can only be used to show whether future sales are likely to be higher or lower than past sales.
Four-point moving average:
A four-point moving average will smooth out the trend line more effectively than a three-point moving average, but has the following problems which make calculations more difficult:
- There are fewer moving average results
- The average of four figures falls on the mid-point which does not correspond to an actual sales figure - an example is given later. This requires a further adjustment to be made to allow direct comparisons to be made.
However, a four point moving average does correspond with how sales are often reported which is quarterly - i.e. every three months.
|
Series: Actual sales |
| 2080 |
| 1200 |
| 1520 |
| 2560 |
| 2160 |
| 2000 |
The underlying trend in the data is not clear because of the variations within the data. If we calculate a moving average we are able to remove some of these variations.

For any series of numbers you are able to calculate 3 less four point moving averages than there are numbers in the series
Moving Average (1): take the first four figures in the series:
![]()
Moving Average (2): drop the first figure from the front and add in the next in the series
![]()
Moving Average (3): continue to use the next set of three figures in the series
![]()
For a moving average based on an odd number, the midpoint coincides with one of the original sales values. For a moving average based on an even number it does not:
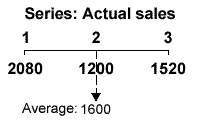
Mean of three-point average

The average falls on the mid-point of the series which is the second sales figures, so it can be compared directly with the actual sales, showing the trend sales are 400 higher than actual sales.
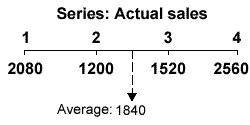
Mean of four-quarter average

The trend average falls between 2 and 3 in the series and cannot be directly compared with either the actual sales for period 2 or period 3
So with a four-point moving average we only produce three results from our series, and these do not correspond with actual sales and so no variation can be established:
1840
1860
2060
|
Series: Actual sales |
Trend (4-point) Sales |
| 2080 | |
| 1200 | |
| 1840 | |
| 1520 | |
| 1860 | |
| 2560 | |
| 2060 | |
| 2160 | |
| 2000 |
So how can a variation be established?
Well statisticians use a method called Centreing. This means averaging two averages to produce a result which does correspond with an actual sales figure.
In our very small series we would do this by averaging 1840 + 1860 and 1860 + 2060:
![]()
![]()
The resulting figures now correspond to an actual sales figure and so a variation can now be established.
|
Series: Actual sales |
Trend (4-point) Sales |
Centred trends |
Variation Sales - Trend |
| 2080 | |||
| 1200 | |||
| 1840 | |||
| 1520 | 1850 | - 330 | |
| 1860 | |||
| 2560 | 1960 | + 600 | |
| 2060 | |||
| 2160 | |||
| 2000 |
By averaging (centreing) two four-point moving averages we have managed to produce results that can be compared, but only TWO of them. It must be clear that this method is not very suitable with only a small series of results. However, follow the example below to see how it can work with a larger series of figures, related to quarterly sales.