Table of Contents

  1. Topic pack - Marketing - introduction
  2. 4.1 The role of marketing - notes
  3. 4.1 The role of marketing - questions
  4. 4.2 Marketing Planning - notes
    1. Marketing planning
    2. The marketing mix
    3. The Total Product Concept
    4. Ethics of marketing
    5. Marketing audit
    6. Porter's five forces
    7. Porter's five forces - activities
    8. Marketing objectives
    9. Market research - introduction
    10. The role of market research
    11. Primary and secondary research
    12. Primary research - information gathering techniques
    13. Observations - case studies
    14. Group-based market research
    15. Market research - summary
    16. Questionnaires
    17. Sampling
    18. Methods of sampling - introduction
    19. Main methods of sampling
    20. Sampling errors
    21. Market segmentation
    22. Consumer Profiles
    23. Types of segments
    24. Demographic segmentation
    25. Psychographic segmentation
    26. Psychographic segmentation - case study
    27. Geographic segmentation
    28. Industrial markets
    29. Targeting
    30. Positioning
    31. Corporate image
    32. Position/perception maps
    33. Unique selling point/proposition USP
    34. Marketing strategies and tactics
    35. Sales forecasting
    36. Qualitative forecasting/data
    37. Forecasting and correlation
    38. Forecasting techniques
    39. Constructing time-series analysis
    40. Moving average
    41. Four point moving average - worked example
    42. Identifying the seasonal variation
  5. 4.2 Marketing planning - questions
  6. 4.3 Product introduction - notes
  7. 4.3 Product - questions
  8. 4.3 Product - simulations and activities
  9. 4.4 Price - notes
  10. 4.4 Price - questions
  11. 4.4 Price - simulations and activities
  12. 4.4 Promotion - notes
  13. 4.5 Promotion - questions
  14. 4.6 Place (distribution) - notes
  15. 4.7 International marketing - notes
  16. 4.7 International marketing - questions
  17. 4.8 E-commerce - notes
  18. 4.8 E-commerce - questions
  19. Printable version

Forecasting and correlation

S:\TripleA\Design\icons\small\hl_start.gif

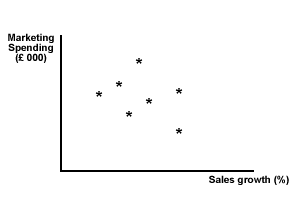
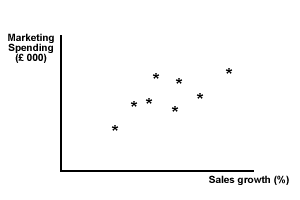
Correlation describes a relationship between two sets of numbers. A scatter diagram can be used to see if there is a possible correlation between two sets of data. The closer the relationship between the two data sets, the closer the correlation and the higher the 'correlation coefficient'. We can see this from the two scatter graphs shown below - one has a high level of correlation between marketing spending and sales growth, while the other shows a low correlation.
scatter1

Figure 2 Low correlation - sales growth and marketing spending
scatter2

Figure 3 High positive correlation - sales growth and marketing spending

Correlation is a tool that is perhaps most used in marketing.

  • It can show you the extent of a relationship between the sets of data.
  • It can help plan with greater certainty and allocate resources accordingly.

Correlation can be placed alongside forecasting in that extrapolation needs to be considered in relation to other positive or negative variables. Changes in the external environment that are positively or negatively correlated with a firm's sales will have to be factored into any predictions of future sales growth.

S:\triplea_workshops\economics\level_1\warning.jpg

Without being too repetitive, it is necessary to treat data with caution ... numbers can often be used to prove opposing points of view - it is a matter of the quality of the data (GIGO) and the nature of the interpretation and tools used.

Note:

  • The sample may be too small and therefore not significant
  • The industry may be subject to fast technical change
  • The external environment can change

S:\TripleA\Design\icons\small\hl_start.gif