Production possibility curves
Production possibility curve
A production possibility curve (sometimes known as a production possibility frontier, boundary or line) is a curve which indicates the maximum combination of any two goods which an economy could produce if all its resources were
(a) fully employed and
(b) organised as efficiently as possible.
How is the curve constructed?
Consider the choice facing many economies today, i.e. between producing say armaments or welfare services (economists sometimes refer to this as the 'guns versus butter' problem). This is a problem in the allocation of society's scarce resources. (Clearly more of one means less of another, so this is also a problem of opportunity cost). We can represent this choice on a diagram as in Figure 1 below.
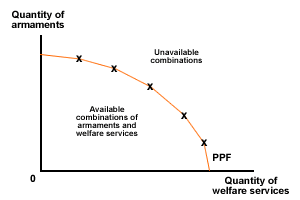
Figure 1 Constructing a production possibility curve
- On one axis we measure the quantity of armaments, on the other welfare services
- Next plot all those combinations of armaments and welfare services, if resources are fully employed (the X's in figure 1)
- Join up these points and the resulting line is called the production possibility curve
The PPC and opportunity cost
The downward slope of the line or curve indicates that there is an opportunity cost in producing more of one type of commodity.
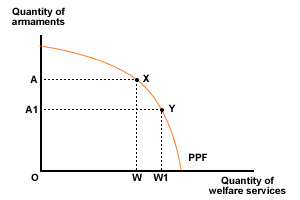
Figure 2 Opportunity cost
We can see this opportunity cost in figure 2. If we move from point X to point Y we are reallocating resources out of armaments production and into welfare services production. Armaments production falls from OA to OA1 and welfare services production increases from OW to OW1. The opportunity cost of WW1 additional welfare services is AA1 armaments foregone.
The economy inside the PPC
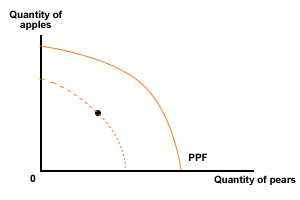
Figure 3 Unemployment=Inefficient resource use
The economy may be producing at some point inside the curve (producing less of both goods). There are two main reasons for this:
- Unemployment of resources
- Inefficient use of resources
So, in figure 3 the solid curve is the PPC with full employment, while the dotted line is the PPC with unemployment.
Actual growth and potential growth
Actual growth
If an economy is operating inside its PPC and produces more as a result of using previously unemployed resources, or using resources more efficiently, this is referred to as actual growth. This is illustrated in figure 4 below by a movement from a point within the PPC to a point towards or on the PPC.
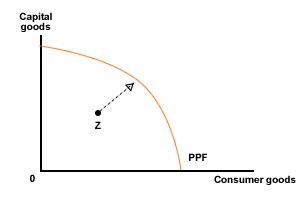
Figure 4 Actual growth
The movement from point Z towards the PPC represents an increase in actual growth.
Potential growth
The productive potential of an economy may be increased by an increase in the quality and/or quantity of resources and, when this occurs, this is known as potential growth.
This is illustrated in figure 5 below by an outward shift of the PPC.
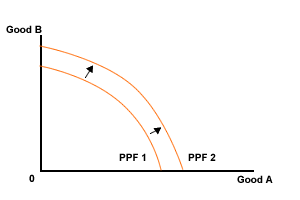
Figure 5 Potential growth
This denotes an increase in the productive capacity or potential of the economy as more of both goods can now be produced.
Difference between growth and development
As noted in Section 1.3, economic development is a broader concept than economic growth. While economic growth is measured by the increase in a country's real level of output over time, economic development might additionally involve changes in the composition of output, a more equal distribution of income, greater access to health care etc.
This difference can be illustrated using a PPC. The two previous diagrams (Figures 4 and 5) indicate an increase in economic growth through an increase in potential and actual output. Figure 6 below indicates economic development.
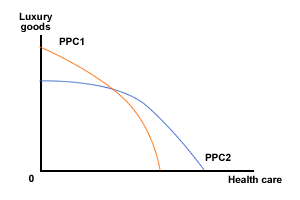
Figure 6 Economic development
The switch from PPC1 to 2 shows more of society's resources being used for the production of health care and less for the production of luxury goods. This is one indicator of economic development, providing sufficient people have access to the greater health care.
Figure 7 shows economic growth and development occurring together.
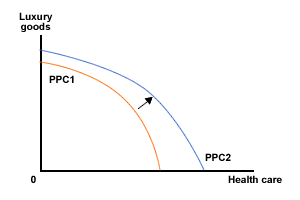
Figure 7 Economic growth and development
The PPC has shifted outwards denoting economic growth, but proportionately more of the economy's resources are now devoted to the output of health care rather than luxury goods as compared with the original position (PPC1).
The productive potential of the economy has increased (economic growth) and there has been a qualitative improvement in the composition of the nation's output (economic development).
