Float analysis

A float is a measure of the spare time within a project.
Two types of float exist:
- Total float
- Free float

Total float
The total float measures the spare time available on a single activity without delaying the project as a whole.
Free float
The free float measures the spare time available on a single activity, so that there is no delay on the start of the following activity, i.e. it does not delay the EST of the following activity. This float is a stricter requirement than total float. The free float will never exceed the total float.

Critical activities have no float, because they have no spare time.
Calculation of float times
The formulae for calculating the float times are as follows:
Total float:
Latest finishing time (this activity) - (Earliest starting time (this activity) + Duration (this activity))
TF = LFT - (EST + D)
For activity F
TF = 15 - (3 + 3) = 9 days
Free float:
Earliest starting time (next activity) - Duration (next activity) - Earliest starting time (this activity)
FF = EST (next) - D (next) - EST (this)
For activity F
FF = 6 - 3 - 3 = 0 days
Free and total float formulas are illustrated below.
Figure 10 Free and total float times
Float should be passed on to the next activity whenever it can be. This is why CPA is a management philosophy as well as a planning tool. It encourages teamwork, helping others, and generates and requires a positive and open approach to problem solving.
Results are usually tabulated. Remember, critical activities have no float at all.
The following is the float analysis chart for the test market project. Make sure you are clear about how all the floats are calculated.
| Activity | Start | Time | Finish | Float | |||
|---|---|---|---|---|---|---|---|
| Earliest | Latest | Earliest | Latest | Total | Free | ||
| A | 0 | 0 | 1 | 1 | 10 | 9 | 0 |
| B | 0 | 0 | 2 | 2 | 5 | 3 | 0 |
| C | 0 | 0 | 3 | 3 | 3 | 0 | 0 |
| D | 2 | 5 | 1 | 3 | 6 | 3 | 0 |
| E | 1 | 10 | 2 | 3 | 12 | 9 | 0 |
| F | 3 | 12 | 3 | 6 | 15 | 9 | 0 |
| G | 3 | 6 | 2 | 8 | 8 | 3 | 3 |
| H | 3 | 3 | 5 | 8 | 8 | 0 | 0 |
| I | 8 | 8 | 10 | 18 | 18 | 0 | 0 |
| J | 6 | 15 | 3 | 18 | 18 | 9 | 9 |
What does this table tell us about the priority we should give to activities? Which one is more important than others?
It is clear that the critical activities are C, H and I and should take priority. What about the rest?
Let's examine the total float first. There are 2 figures in the chart:
3 - activities B, D and G - a chain:
All three have the same 3 days float. If B uses it up, then D and G have nothing.
The aim is to pass on float, to work as a team and to cooperate. It is not a competition.
9 - Activities A, E, F and J - another chain.
Again this is the same float which is passed on to the next activity in the chain.
Now for the free float. This exists only with activities G and J, at the end of chains. If it gets to them, they can do what they like with it. They have nowhere to pass it to.
The priorities? B, D and G are sub-critical by 3 days and A, E, F and J by 9 days. So:
- 1st priority - critical activities - C, H and I
- 2nd priority - activities B, D and G
- 3rd priority - activities A, E, F and J.
This would be the agenda, in effect, at all project review and planning meetings.
What if there is a delay on a critical activity?
The project manager will identify critical activities from the network diagram. If there is a delay on any of these, the whole project will also be delayed. This may have serious consequences. Many contracts for projects contain penalty clauses, should the project be delayed - road repairs are a prime example. The project manager has a number of choices to prevent the delay on the entire project.
Firstly, he or she can look to see if there is any spare capacity. For instance, if there is a float on another activity, employees working on this may be transferred from this activity to the delayed critical activity to bring it back on track. Of course, there may be a flaw here, since these 'spare' employees may not have suitable skills. For example the manager should not use plumbers to install electrics - it is likely to be dangerous and against the law! The same will go for other resources, such as idle machinery.
 Alternatively, the project manager could persuade existing employees to work longer hours or could hire new staff on a temporary basis to rectify the problem. Again, these are far from perfect as both options carry additional cost, which may result in the project going over budget. Indeed, the project manager may decide it is cheaper to incur the penalty charge.
Whatever the option taken, at least the planning process using CPA allows a potential problem to be identified at an early stage, offering the possibility of corrective action.
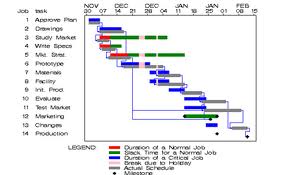
Many project managers use additional visual tools to monitor projects. One particularly useful tool is Gannt Chart, a form of bar chart, which provides a visual representation of progress on every activity. Unlike CPA, however, dependencies between activities are not easy to recognise.
