Supply and demand

 N.B. The Business and Management IB syllabus does NOT require students to produce supply and demand diagrams in examinations. However, supply and demand is difficult to understand and apply without knowledge of the diagrams that underpin the concepts.
A market is a place where buyers and sellers meet to trade and it is the market that determines the price of the goods and services that we buy. The market price (or equilibrium price) is determined by the levels of demand and supply in the market. Figure 1 below shows a market in equilibrium with an equilibrium market price of P* and an equilibrium quantity being bought and sold of Q*.
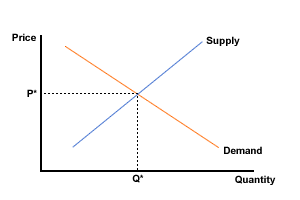
Figure 1 Market equilibrium
Though markets aim to reach equilibrium they can record excesses. This can happen both with demand and supply. When this occurs it is called a disequilibrium and figure 2 below shows possible excess supply and excess demand.
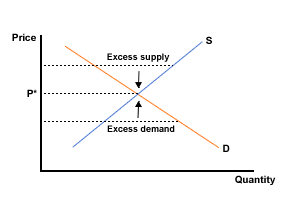
Figure 2 Excess demand and excess supply
Where there is excess demand in a market this will tend to drive the price upwards, whereas excess supply will tend to drive it downwards.
Demand and supply alter because of changes in certain conditions. If the price of the product you are looking at changes there will be a MOVEMENT along its demand or supply curve (see figure 3 for a move along a demand curve and figure 5 for movements along a supply curve), whilst if any other condition, apart from price of the item you are looking at, changes, then you will have to SHIFT either the demand or the supply curve (see figure 4 for shifts in a demand curve and figure 6 for shifts in a supply curve).
A movement along the demand or supply curve is called a contraction or an extension.
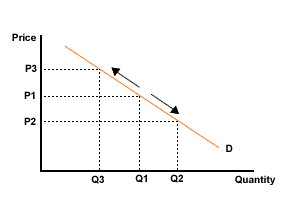
Figure 3 Possible movements along a demand curve
A shift in the demand or supply curve is either an Increase or a Decrease.
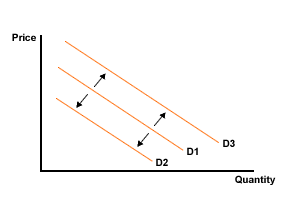
Figure 4 Possible shifts of a demand curve
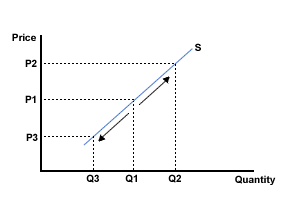
Figure 5 Possible movements along a supply curve
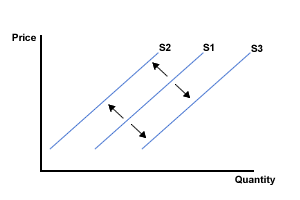
Figure 6 Possible shifts of a supply curve

A short exercise

Hint: Ask yourself the following questions when attempting supply and demand questions:
- Has the price of the item you are looking at changed? If yes, you move along the existing curve. If no, you will have to construct a new curve to the right or left.
- Is the factor examined a condition of demand or a condition of supply?
- Is the change positive or negative for the demand or supply of the product?
On demand and supply diagrams illustrate the following:
(a) An increase in the price of a product - on the demand curve.
(b) A fall in consumer income.
(c) An increase in the production costs of a product.
(d) A fall in the price of a product - on the supply curve.
(e) A rise in the price of a direct competitor's product.
Once you have had a go at these follow the links below to see how the diagrams should have looked.
Answer (a)
Answer (b)
Answer (c)
Answer (d)
Answer (e)
